Rapport
nr. 124
R
Contextual data for the
European Social Survey
An overview and assessment
of extant resources
Lars Tore Rydland, Sveinung Arnesen and Åse Gilje Østensen
ISBN 82-7170-225-4 ISSN 1501-6447
Contextual data for
the European Social Survey
An overview and assessment
of extant sources
Lars Tore Rydland, Sveinung Arnesen and Åse Gilje Østensen
ISSN 1501-6447
Deliverable in the project "ESS Infrastructures: Improving Social Measurement in Europe"
Norsk
samfunnsvitenskapelig datatjeneste AS
i Prepared by
Norwegian Social Science Data Services Harald Hårfagres gate 29
5007 Bergen Norway
Phone: +47 55 58 21 17 Fax: + 47 55 58 96 50 Internet: www.nsd.uib.no Email: nsd@nsd.uib.no
Published in December 2007.
ii
Preface...v
Introduction ...1
1. Background and objectives...1
2. Availability of contextual data...2
3. Coverage of contextual data ...4
4. Quality and comparability...5
5. Documentation ...9
6. Room for improvements ...10
7. Outline of the report ...12
Part 1: Comparability and quality of contextual data ... 15
Chapter 1: Regional-level data ...16
Chapter 2: GDP statistics...27
Chapter 3: Unemployment statistics...42
Chapter 4: Education statistics ...59
Chapter 5: Political indicators...65
Part 2: Data sources... 100
List of data sources ...104
1. ACLP Political and Economic Database...106
2. Centripetal Democratic Governance ...110
3. CIRI Human Rights Project...113
4. CivicActive ...116
5. Comparative Parties Dataset ...120
6. Comparative Political Datasets ...123
7. Comparative Welfare Entitlements Dataset...132
8. Comparative Welfare States Dataset ...135
9. Constituency-Level Elections Dataset ...138
10. Cross-National Time-Series Data Archive...141
11. Database of Political Institutions...144
12. Democratic Electoral Systems Around the World ...147
iii
16. Fractionalisation Data ...165
17. Freedom House...168
18. Groningen Growth and Development Centre ...175
19. International Labour Organisation...179
20. International Monetary Fund ...185
21. Inter-Parliamentary Union...190
22. Judicial Checks and Balances ...192
23. Lijphart Elections Archive...195
24. Migration DRC...198
25. Minorities at Risk Project...201
26. OECD ...206
27. Party Policy in Modern Democracies ...218
28. Penn World Table...221
29. Political Constraint Index Dataset...225
30. Political Terror Scale ...228
31. Political Transformation in Post-Communist Europe ...232
32. Polity Project ...235
33. Polyarchy and Contestation Scales ...239
34. Polyarchy Dataset (Vanhanen)...242
35. Psephos (Adam Carr’s Election Archive)...246
36. Quality of Government (La Porta et al.) ...249
37. Quality of Government Datasets (QoG Institute) ...252
38. Reporters sans frontières ...256
39. Terrorism in Western Europe: Events Data...259
40. Transparency International...262
41. UNESCO ...267
42. UNICEF...274
43. Union Centralisation Among Advanced Industrial Societies...280
44. United Nations Economic Commission for Europe ...283
45. United Nations Statistical Division ...288
46. World Bank...293
iv 50. Worldwide Governance Indicators ...311
v This report has been prepared for the European Social Survey (ESS) and examines the availability
and comparability of extant sources of contextual statistics that may be of interest to users of
ESS data.∗ It is organised in two main parts. In Part 1 we examine the comparability and quality of some widely used contextual statistics, with the aim of illustrating common problems of
comparability that users of the data should be aware of. In Part 2 we offer a more schematic
presentation of 50 different sources of contextual data. The purpose of this part is twofold. Most
importantly, the overview in Part 2 forms the basis for our assessment of the current availability
and coverage of contextual data sources. But we also believe that the overview can be of interest
as a user’s guide for researchers looking for contextual data to incorporate in their analyses. In
the Introduction we explain the background and objectives of the report in further detail, and
present some tentative conclusions.
The report was written by Lars Tore Rydland, Sveinung Arnesen and Åse Gilje Østensen,
all at the Norwegian Social Science Data Services (NSD). Rydland wrote the Introduction, most
of the chapter on regional-level data (Chapter 1), parts of the chapter on GDP statistics (Chapter
2), the chapters on unemployment statistics (Chapter 3) and political indicators (Chapter 5), and
27 of the sections in Part 2. Arnesen wrote most of the chapter on GDP statistics (Chapter 2),
the chapter on education data (Chapter 4), and 19 of the sections in Part 2. Østensen wrote the
section on electoral districts in Chapter 1, and four of the sections in Part 2.
We wish to thank several of our colleagues at NSD – Astrid Nilsen, Kyrre Moe, Gyrid
Havåg Bergseth, Kirstine Kolsrud, Knut Kalgraff Skjåk and Atle Alvheim – for constructive
comments on earlier versions of this report. A special thanks goes to Sally Widdop (City
University, London) for her detailed and helpful comments. Any remaining faults are our own.
∗
1. Background and objectives
Contextual data describe the environment in which individuals reside and behave (Johnson,
Shively and Stein 2002: 220), and include a wide range of macro statistics such as data on
demography, employment, economic development and characteristics of the political system.1
This kind of data may be a valuable supplement to the survey data collected by the European
Social Survey (ESS), since individual behaviour in many cases is contingent upon the social
environment. By combining micro-level data from the ESS with information about the social
context in the same analysis, it is possible to examine how external factors influence the attitudes
and choices of individuals.2
Scholars have long recognised the potentially great advantages of combining contextual
variables with individual-level data. Linz (1969: 107), for example, has emphasised “the need to
specify further many of our generalizations by taking into account contextual variables (…) in
understanding individual attitudes and behaviour”. Similarly, Dogan (1994: 58) has claimed that
“Survey data and aggregate data should be combined whenever possible.” In recent years,
renewed interest in hierarchical analysis and multilevel modelling has further underscored the
potential in linking individuals with their social environment.3
The survey data collected by the ESS are particularly useful in this context, since the
availability of comparable individual-level data for a wide range of countries now makes it
possible to carry out multilevel analyses covering a large number of countries.4 However, a
fruitful combination of contextual and individual-level data is contingent upon the quality and
comparability of the former, and several scholars have expressed their doubts about the
1 We use the terms “contextual”, “macro” and “aggregate” interchangeably throughout this report, even though not
all the macro data we discuss are aggregates in the strict sense of the word. The term aggregate data usually refers to “data or variables for a higher level unit (for example, a group) constructed by combining information for the lower level units of which the higher level is composed (for example, individuals within a group)” (Diez-Roux 2002: 588). Many political indicators, such as institutional variables and regime indices, are not based on summaries of the properties of lower-level units, but measure characteristics of the higher-level units themselves. See Diez-Roux (2002) for definitions of concepts and terms used in multilevel analysis.
2 See Steenbergen and Jones (2002: 219-221) for a discussion of the advantages of combining contextual data with
survey data. In addition to theoretical reasons for combining data from multiple units of analysis, an important statistical motivation is the need to control for group effects in the survey data that may be difficult to detect otherwise.
3 See Achen (2005) and Steenbergen and Jones (2002) for discussions of hierarchical and multilevel models.
4 In fact, one of the proposed Eurocores programmes, the HumVIB, specifically addresses the great potential in
combining contextual variables with individual-level ESS data in cross-country comparisons. See the HumVIB website for further details about the programme:
2 availability and quality of aggregate statistics (e.g., Eberstadt 1995; Herrera and Kapur 2007;
Maddala 1999: 431; Srinivasan 1994).
This report addresses the challenge of providing comparable macro statistics that can be
used in combination with ESS data. The report has two main objectives. First, it provides an
overview of extant sources of contextual data that may be of interest to ESS users. And second, it
examines the comparability and quality of some widely used contextual statistics.
The objectives can be further specified in four questions: are contextual data easily
available for most topics that could be of interest to ESS users? Is the coverage of the data
sufficient? Is the quality and comparability of the data good enough? And finally, is the
documentation of the data adequate? In the following pages we elaborate on these questions and
explain the reasoning behind our answers.
2. Availability of contextual data
The availability of contextual data has improved appreciably over the last couple of decades, a
development that has been noted and welcomed by several scholars (e.g., Atkinson 2002: 12;
Collier 1999: 1; Harkness 2004: 1). Cheibub (1999: 21), for example, argues that “there has been
an explosion of cross-national studies examining all sorts of relationships; relationships that, only
a few years ago, would have been definitely beyond systematic scrutiny for lack of data.” This
trend is also reflected in the overview of extant sources of contextual data presented in this
report. We have examined 50 different sources that, taken together, offer data on most of the
major areas of research in the social sciences. International organisations such as Eurostat, the
OECD, the United Nations and the World Bank publish a wide range of general background
statistics on topics such as demography, education, economic development and finance, the
labour market, communication and culture, living conditions and welfare, minorities and
immigrants, and health conditions. In addition, non-governmental organisations and individual
research projects provide data on a host of other issues, including political institutions, elections
and electoral systems, political parties, ethnic and religious minorities, corruption, human rights,
and political regimes.5
Hence ESS users who wish to incorporate contextual background data in their analyses
can choose between numerous sources that provide data on a variety of topics. What is more,
most of the data sources are freely available on the internet. Of the 50 different sources we have
5 See Section 51 in Part 2 for a list of topics covered by various data sources, and an index of relevant sources for
3 examined, only a few require payment.6 And since most of the major sources of contextual
statistics make their data available online, scholars anywhere in the world can easily download the
data they are looking for.
However, this positive assessment of the current situation of data availability must be
qualified in five important respects. First, the technical solutions for disseminating data are
sometimes cumbersome and lack flexibility. Second, there are still several areas where there is a
lack of data. Third, the coverage of some of the datasets is rather limited, in both temporal and
geographical terms. Fourth, the quality and comparability of many widely used datasets in
cross-country comparisons have been challenged. And fifth, the documentation of the data is often
inadequate, making it difficult for users to examine independently the comparability and quality
of the data.
The first of these caveats is arguably the least important, but it is not insignificant. Some
of the databases are very intuitive and easy to use, and allow users to individually specify the
variables, units and years that are to be included in a dataset before downloading it.7 But other
databases are more cumbersome to use. For example, the data in Eurostat’s Dissemination
database are stored in various subfolders and tables, and it is not possible to select variables from
different folders or tables and download them in a single file. Instead, users must download data
from each table separately, making it unnecessarily time-consuming to construct a single dataset
with various types of data.8 It should be noted, though, that Eurostat’s database is fairly
straightforward to use, and in most cases it is possible to create subsets of data from a single table
by specifying various dimensions. Many other sources are less flexible still, and only provide users
with the option of downloading the entire dataset in a single file, typically as an Excel spreadsheet
or an SPSS file. Though it is very easy to download the data in this manner, it is not very flexible
for users who are only interested in a couple of variables for selected units and years.
The second caveat is a more significant problem: there are still several areas where there is
a lack of data, especially of the detailed sort.9 While the sources examined in this report publish
data on most topics that may be of interest to ESS users, the data are often only made available at a highly aggregate level. Hence users looking for detailed series may find the data published by
6 The databases that require payment are the Cross-National Time-Series Data Archive, the IMF’s International
Financial Statistics, the World Bank’s World Development Indicators and the World Christian Database. In addition, some of the datasets published by the OECD and the International Labour Organisation (ILO) must be purchased, but these two organisations also provide data free of charge.
7 Examples of databases that are easy and flexible to use are the United Nations Statistical Division’s Common
Database, the CIRI Human Rights Dataset and the World Bank’s World Development Indicators.
8 Another example of this problem is the OECD’s SourceOECD database.
9 Cheibub (1999: 23), for example, notes that “sometimes we simply lack the data, even on the most basic,
4 international organisations inadequate: such data are often only available from national statistical
offices, which generally hold more comprehensive statistical collections. Furthermore, the
contextual data in international databases are usually only available at a highly aggregate level in a
geographical sense as well. In most cases, international organisations only publish statistics at the country level; the only international agencies that provide regional data are Eurostat and, to a lesser extent, the OECD.10 Comprehensive data collections, including both country-level and
regional-level statistics, are thus frequently only available from national statistical offices. Yet for an
individual researcher to compile a dataset with information from the national statistical offices in
all European countries would be both difficult and time-consuming, given the number of
national agencies, language difficulties and differences in definition and data collection. Hence
the only feasible alternative is, in many cases, to make do with the collections stored in
international databases.
3. Coverage of contextual data
The availability of data varies significantly across countries. Many scholars have pointed out that
data on key variables of interest to scholars are either incomplete or not collected at all, especially
in developing countries (Herrera and Kapur 2007: 368; see also Srinivasan 1994, and Widner
1999). This brings us to the third qualification: coverage is rarely, if ever, complete. Generally
speaking, the availability of data is a lot better for developed countries, i.e. the western European
member states of the OECD and the European Union. For these countries, the OECD and
Eurostat publish data on most topics, often covering a fairly long time period and sometimes at a
lower level of aggregation than the nation-state. Thus, even though there are many instances of
missing data also in Eurostat’s statistical collections, it is reasonable to say that the geographical
and temporal coverage of contextual data is fairly good for western Europe.
However, the availability of data is more limited for eastern European countries, some of
which also participate in the ESS.11 Data on many central variables are either not collected at all
or are only available for a limited time period. Even though there are several organisations that
publish data for eastern European countries, their data series are generally less detailed than the
10 See Chapter 1 in Part 1 for a discussion of regional-level data.
11 See Part 2 for further information about which ESS countries that are poorly covered or not covered at all in the
5 ones published by Eurostat for western Europe, and in many instances information is missing for
several countries.12
Since the majority of countries participating in the ESS are covered by the OECD’s and
Eurostat’s databases, one possible solution to the problem of limited coverage could be to
supplement these sources with other data whenever necessary. For example, scholars could use
data from Eurostat as a starting point, and complement these with information from national
statistical offices and organisations such as the United Nations Economic Commission for
Europe (UNECE) and the United Nations Statistical Division, which have a broader
geographical scope. Yet combing data from different sources may be problematic if the data are
of different quality. According to Herrera and Kapur (2007: 371), the combination of data from
sources with different degrees of measurement error may lead to biased and inconsistent results if
the measurement error is correlated with other variables of interest, and perhaps also with the
dependent variable. Scholars should therefore be careful when mixing seemingly comparable data
from various sources, since there may be significant differences between them even when they
purport to measure the same thing. This leads us to the fourth and probably most important
caveat: the quality and comparability of the available contextual data.
4. Quality and comparability
Most sources of contextual statistics present their data in a common framework and in
standardised tables. But this does not necessarily imply that the data are truly comparable – in the
sense that they are measuring the same overarching concept – nor does it mean that the data are
of a high quality.13 In fact, several scholars have argued that many of the most commonly used
datasets with contextual statistics are very unreliable, suffering from problems of inaccuracy and a
lack of comparability. Writing in the mid-1990s, Srinivasan (1994: 23-24) reached the conclusion
“that the situation with respect to the quality, coverage, intertemporal and international
comparability of published data on vital aspects of the development process is still abysmal in
spite of decades of efforts at improvements.”14 Even though some have argued that the quality of
contextual data has improved in recent years (e.g., Atkinson 2002: 12; Harkness 2004: 6), a recent
12 Examples of organisations that publish data for eastern Europe countries are the United Nations Economic
Commission for Europe (UNECE), the United Nations Statistical Division, the World Bank and several other specialised agencies of the United Nations. In addition, some of Eurostat’s collections contain data for eastern Europe.
13 See Gerring and Thomas (2005) for a discussion of the concept of comparability.
6 review found that there are still many instances of inaccuracy or outright errors in widely used
datasets (Herrera and Kapur 2007).15
Problems of comparability and data quality affect most kinds of data, though some
statistics are more susceptible than others. In some areas, such as national accounts and labour
force statistics, international guidelines exist that specify how central concepts are defined and
how data should be collected. As a result, the definition of variables such as the gross domestic
product (GDP) and the unemployment rate are now broadly similar across countries.
Nonetheless, as we discuss in chapters 2 and 3 (Part 1), even for these highly standardised
variables there are some differences in definition and measurement between countries. Hence
even in cases where international organisations have spent decades to coordinate how data
should be defined and collected, problems of comparability remain. Similar and sometimes even
more serious problems affect the quality of other socio-economic statistics in areas such as
income inequality (Atkinson and Brandolini 2001), social indicators (Strauss and Thomas 1996),
education (Chapter 4; see also Behrman and Rosenzweig 1994, and de la Fuente and Doménech
2006), demography (Chamie 1994), poverty and inequality (Fields 1994), and social welfare
spending (De Deken and Kittel 2007; Kühner 2007; Siegel 2007). In short, socio-economic
variables, though often perceived as objective and equivalent across countries, may upon closer
examination turn out to be less comparable than they first appear.
There are, then, problems of comparability and quality even in areas where national
governments and international organisations have strived to improve the situation. It is therefore
not surprising that data may be even more uncertain on issues that governments have not tried to
measure quantitatively. This is clearly reflected in datasets trying to measure political issues such
as human-rights violations, corruption, political institutions and political regimes. Such datasets
are usually produced by individual research projects or non-governmental organisations, which
have limited resources. In some areas, such as human-rights conditions and corruption, it is
nearly impossible to get reliable data; other topics are difficult to measure objectively because of
lack of consensus on the definition of basic political concepts (see Chapter 5 for a discussion of
political indicators).
The studies cited above are mainly concerned with the quality of quantitative data for
developing countries, and the situation is better when it comes to developed countries in western
Europe. In general, according to Dogan (1994: 41), “the lower the level of development, the
lower is also the validity of quantitative data.” Yet low data quality is not exclusive to poor
15 For example, Herrera and Kapur (2007: 370) find that there are often “discrepancies either within the data
7 countries (Harkness 2004: 11; Herrera and Kapur 2007: 377). For example, in an analysis of the
comparability and quality of social expenditure data, De Deken and Kittel (2007: 99) conclude
that “even our best sources for internationally comparable data (the OECD social expenditure
database and [Eurostat’s] ESSPROS database) are conceptually ambivalent and inconsistent to an
extent which seriously undermines the conceptual validity of the indicators used.” Scholars
should therefore be mindful of problems of comparability even when using data from Eurostat
and the OECD.
Still, the central question is: how important are the problems of quality and
comparability? Are the existing data good enough? Claiming that data quality is important would
seem like stating the obvious. Yet some scholars argue that researchers generally do not care
much about the quality of the data they use. Herrera and Kapur (2007: 366), for example, claim
that “Inattentiveness to data quality is, unfortunately, business as usual in political science.”
Srinivasan (1994: 4), in a similar vein, maintains that “it would appear that researchers are either
not aware of or, worse still, have chosen to ignore the fact that the published data, national and
international, suffer from serious conceptual problems, measurement biases and errors, and lack
of comparability over time within countries and across countries at a point in time.”
Ignoring deficiencies in the data is clearly not a good way to do science. Yet whether or
not the existing data sources are satisfactory in terms of quality and comparability depends on the
research question at hand. Some scholars argue that reliability problems should not discourage
researchers from doing quantitative analyses,16 and in some respects it seems reasonable to claim
that the available contextual data are, indeed, good enough for many ESS users. If a researcher is
simply interested in some background information in order to interpret the survey data within a
broader social context, it will not matter much that the aggregate data are not measuring the
variable of interest with absolute precision. For example, whether the unemployment rate in the
Netherlands in 2005 was 5.2, as the ILO (2007) reports, or 4.6, as the OECD (2007: 245) says,
does not matter much for a researcher interested in comparing people’s attitudes in countries
with different levels of unemployment; the Netherlands’ unemployment rate in 2005 was
significantly lower than Poland’s whichever way you measure it.17
Another reason for treating the existing and deficient contextual data as satisfactory is
that it is sometimes unrealistic to expect that better data can be collected. Many of the most
significant aspects of political and social life cannot be measured with precision, but this does not
16 Temple (1999), in a review of the literature on economic growth in developing countries, argues that even though
cross-country data are often subject to problems of mismeasurement, quantitative cross-section analyses can still provide valuable insights (ibid: 130).
17 The unemployment rate in Poland in 2005 was 17.7 according to the ILO (2007) and 17.8 according to the OECD
8 mean that measures are worthless (Dogan 1994: 54). Issues such as human-rights violations and
corruption, for example, can never be measured with accuracy, but it is possible to obtain rough
estimates that can still be useful. As Tukey (1962: 13-14) notes: “Far better an approximate
answer to the right question, which is often vague, than an exact answer to the wrong question, which can always be made precise.”
This is not to say that scholars should be inattentive to problems of data quality and
comparability. The validity and reliability of contextual variables are important even when they
are only used to put survey data in a broader social context. And in cases where scholars are
primarily interested in properties of the contextual data themselves, such as in pooled time-series
cross-section analysis, the quality of the data becomes all the more important. As we discuss in
chapters 2 and 5, differences between datasets purporting to measure the same thing may
sometimes lead to significantly different results. Various ways of estimating GDP at
purchasing-power parity, for example, may lead to different estimates of the GDP of poor countries relative
to rich ones (Hill 2000), and the impact of different variables on regime type varies depending on
which democracy index you use (Casper and Tufis 2003).
ESS users who incorporate contextual data in their analyses should, therefore, take the
question of data quality seriously. First, they should take the uncertainty of the data into account
when they interpret their results, possibly by factoring the measurement error into an estimate of
the degree of confidence attached to the data. Second, they should try to find data that are of as
high a quality as possible, and if existing data are not good enough, they should try to collect
primary data themselves. And third, they should engage the data critically to examine whether
supposedly comparative data really are comparable.
Yet the effort required to resolve the last two tasks is substantial (Cheibub 1999: 23;
Widner 1999: 18), and it is therefore not surprising that many researchers choose the simple
option of downloading easily accessible, ready-made datasets without paying too much attention
to the quality of the data. This option becomes all the more tempting since many of the datasets
are already widely used and/or are published by highly regarded institutions, thus giving “the data
sets a badge of credibility” (Herrera and Kapur 2007: 381). In order to help researchers avoid this
common problem, existing data sources should provide them with enough information to
examine the data critically. Unfortunately, this is not always the case; hence the final caveat: the
9
5. Documentation
In fact, the sources examined in this report vary greatly when it comes to how much
documentation they provide. All sources provide some information on the definition of variables
and the sources on which the data are based. Some datasets also provide easily accessible and
detailed information on methodology and sources, allowing independent users to examine how
the data were collected and sometimes also replicate the results. The CIRI Human Rights dataset,
for instance, is documented in a codebook that gives a detailed description of how each variable
is coded, what sources are used and how instances of ambiguity are treated. Another example of
fairly good documentation standards is Eurostat’s Dissemination database, which provides easily
accessible metadata online, although the detail of the documentation varies between topics.
But in many cases the documentation is either too sketchy or too difficult to get access to.
Sometimes the documentation is so limited that it is outright misleading. For example, the
documentation of the adult literacy variable in the World Bank’s World Development Indicators
is limited to a short definition of literacy that presumably is the same for all countries in the
database. The primary sources of the data are not listed; the documentation merely states that the
data are taken from UNESCO’s Institute for Statistics (UIS). Hence a user who accepts the
documentation provided by the World Bank at face value would assume that the adult literacy
rate really reflects “the percentage of people ages 15 and above who can, with understanding,
read and write a short, simple statement on their everyday life.”18 But the documentation of the
same variable in the UIS’s online database reveals a different picture: the definition of literacy
varies across countries, and sometimes over time within the same country. For some countries,
such as Afghanistan and Zambia (in 1999), the definition does not require people to be able to
write; anyone who can “read easily or with difficulty a letter or a newspaper” is defined as
literate.19 Furthermore, the data are based on self-declaration or household-declaration, and the
primary sources of the data vary from country to country. In most cases the data are taken from
population censuses, but labour force surveys, household surveys and even estimates calculated
by the UIS are also used. Thus the quality and comparability of the data are a lot shakier than one
would think when reading the documentation provided by the World Bank.
18 Definition of adult literacy rate in the World Bank’s World Development Indicators.
http://devdata.worldbank.org/dataonline/ (4 September 2007).
19 The definitions used in various countries are documented in an Excel spreadsheet that can be downloaded from
the UIS online database. Note that the literacy rate for Zambia in 1990 is based on a definition that classifies as literate only people who can both read and write. The change of definition is not documented by the World Bank.
10 Even in cases where the documentation is sufficient (albeit limited), the metadata may be
difficult to get access to, and inattentive users may treat as comparable data that are not. For
example, the UNECE’s Statistical Database contains a table with unemployment rates for various
European countries. The general note to the table states that “The UNECE secretariat presents
time series ready for immediate analysis,” and the definition of the unemployment rate is
allegedly based on the recommendations of the ILO.20 The footnote to the table also states that
not all countries provide data according to this definition, but many users may be misled to
believe that the data in the table are actually comparable. It is only when looking at another
webpage, linked to the footnote, that one sees that the table contains a mix of data based on
labour force surveys and administrative data. Data from these two sources cannot be treated as
comparable (see Chapter 3), and it is highly misleading to present them in the same standardised
table.21
These examples show that the documentation of extant sources of contextual data is
sometimes inadequate, making it difficult for external users to find out whether the data are really
comparable. ESS users who wish to use contextual data in their analyses must therefore be
prepared to spend some time examining the data in order to find out whether they can be used.
This will often be quite time-consuming and may involve comparing data from different
organisations, studying the available documentation carefully and consulting independent reviews
of the data sources.
6. Room for improvements
To summarise, the assessment of existing sources of contextual data reveals a rather mixed
picture. The availability of data is fairly good for many topics, and most sources provide their
data free of charge. Furthermore, some sources have good technical solutions for disseminating
data, cover a large number of countries and a fairly long time period, publish data of good quality,
and provide detailed documentation that allows for independent review. Nonetheless, the
coverage of existing sources is, by and large, not good enough, and the quality and comparability
20 UNECE Statistical Database. http://w3.unece.org/pxweb/Dialog/Default.asp (5 September 2007).
21 A similar problem pertains to some of the OECD’s data collections. OECD data can be accessed in various ways,
11 of many types of data are questionable. In addition, the documentation of problems of quality
and comparability is often inadequate. There should therefore be plenty of room for
improvements when it comes to providing comparable, high-quality contextual data with a broad
geographical and temporal coverage.
There is, admittedly, little that can be done with the most fundamental problems, at least
within the short term. The main reasons for the unsatisfactory current situation are that the
definitions and data collection procedures of national statistical offices often differ, and that
primary data in many cases simply do not exist. Solving these problems requires a coordinated
and continuing effort by national statistical offices and international organisations.22
Nonetheless, there are two things that can be done that would improve data availability
for ESS users considerably. First, contextual statistics can be made more accessible by storing
data that are of particular relevance to ESS users in one place. This would involve developing a
new database that could, in addition to bringing together data from different sources, provide
users with a more flexible and user-friendly way of accessing data. Ideally, such a database should
include a system for appending contextual data as background variables directly to the ESS
survey data, both at country level and in accordance with the regional classification used in the
survey. This would make it a lot easier for ESS users who are interested in contextual data to
incorporate such information in their analyses, especially since the regional breakdown used in
the survey varies across countries. Furthermore, a new database, specifically designed to
accommodate the needs of ESS users, would draw attention to the many possibilities that exist
for combining macro and micro data, possibilities that many users are unaware of.
Second, the problems of comparability and data quality can be better documented. This
can be done either by developing a better documentation standard in a new database, or by
describing problems that users of contextual data should be aware of in some sort of user’s guide.
As Dogan (1994: 38) notes, the problem of poor data quality is not so much the nature of
evidence as its uncritical use. By alerting researchers of the potential deficiencies of the contextual
data they use, the common practice of drawing too firm conclusions from shaky data can be
discouraged.
22 In fact, several international organisations already work to coordinate the collection of comparable statistics across
12
7. Outline of the report
The rest of the report is organised in two main parts. In Part 1 we examine the comparability and
quality of contextual data in some detail. Since these issues vary greatly between different types of
statistics (and between data producers), we only examine a limited number of variables and
indicators. A full discussion of the comparability of all relevant statistics is beyond the scope of
this report. The purpose of Part 1 is therefore only to illustrate and exemplify problems of comparability that users of contextual data should be aware of. Then, in Part 2, we provide an
overview of extant sources of contextual data that may be of interest to ESS users. We give a
brief summary of 50 sources, detailing the contents of the datasets and explaining how users can
get access to them.
Sources
Achen, Christopher H. 2005. “Two-step hierarchical estimation: beyond regression analysis”.
Political Analysis 13 (Autumn): 447-456.
Atkinson, Anthony B. 2002. “Data matter”. Presented the Australasian Meetings of the Econometric Society, Auckland, New Zealand, July 2001. Revised version.
http://www.nuff.ox.ac.uk/users/atkinson/ (27 August 2007).
Atkinson, Anthony B., and Andrea Brandolini. 2001. “Promise and pitfalls in the use of “secondary” data-sets: income inequality in OECD countries as a case study”. Journal of Economic Literature 39 (September): 771-799.
Behrman, Jere R., and Mark R. Rosenzweig. 1994. “Caveat emptor: cross-country data on education and the labor force”. Journal of Development Economics 44 (June): 141-171.
Casper, Gretchen, and Claudiu Tufis. 2003. “Correlation versus interchangeablity: the limited robustness of empirical findings on democracy using highly correlated datasets”. Political Analysis
11 (Spring): 1-11.
Chamie, Joseph. 1994. “Population databases in development analysis”. Journal of Development Economics 44 (June): 131-146.
Cheibub, José Antonio. 1999. “Data optimism in comparative politics: the importance of being earnest”. APSA-CP Newsletter 10 (Summer): 21-24.
Collier, David. 1999. “Letter from the president: data, field work and extracting new ideas at close range”. APSA-CP Newsletter 10 (Winter): 1-6.
13
Change: The “Dependent Variable Problem” in Comparative Analysis, eds. Jochen Clasen and Nico A. Siegel. Cheltenham: Edward Elgar.
de la Fuente, Angel, and Rafael Doménech. 2006. “Human capital in growth regressions: how much difference does data quality make?” Journal of the European Economic Association 4 (March): 1-36.
Diez-Roux, Ana V. 2002. “A glossary for multilevel analysis”. Journal of Epidemiology and Community Health 56 (August): 588-594.
Dogan, Mattei. 1994. “Use and misuse of statistics in comparative research. Limits to quantification in comparative politics: the gap between substance and method”. In Comparing Nations, eds. Mattei Dogan and Ali Kazancilgil. Oxford: Blackwell.
Eberstadt, Nicholas. 1995. The Tyranny of Numbers: Mismeasurement and Misrule. Washington: AEI. Eurostat. 2007. The European Statistical System. Website.
http://epp.eurostat.ec.europa.eu/portal/page?_pageid=1153,47169267,1153_47183518&_dad=p ortal&_schema=PORTAL (12 November 2007).
Fields, Gary S. 1994. “Data for measuring poverty and inequality changes in the developing countries”. Journal of Development Economics 44 (June): 87-102.
Gerring, John, and Craig W. Thomas. 2005. “Comparability: a key issue in research design”. C&M Political Methodology Working Papers 4, IPSA (October). http://www.concepts-methods.org/papers_list.php?id_categoria=2&titulo=Political%20Methodology (3 September 2007).
Harkness, Susan. 2004. “Social and political indicators of human well-being”. UNU-WIDER Research Paper no. 2004/33 (May). http://www.wider.unu.edu/publications/publications.htm
(27 August 2007).
Herrera, Yoshiko M., and Devesh Kapur. 2007. “Improving data quality: actors, incentives, and capabilities”. Political Analysis 15 (Autumn): 365-386.
Hill, Robert J. 2000. “Measuring substitution bias in international comparisons based on additive purchasing power parity methods”. European Economic Review 44 (January): 145-162.
ILO. 2007. ILO Comparable Estimates. Online database. http://laborsta.ilo.org/ (4 September 2007).
Johnson, Martin, W. Phillips Shively and Robert M. Stein. 2002. “Contextual data and the study of elections and voting behavior: connecting individuals to environments”. Electoral Studies 21 (June): 219-233.
Kühner, Stefan. 2007. “Country-level comparisons of welfare state change measures: another facet of the dependent variable problem within the comparative analysis of the welfare state?”
Journal of European Social Policy 17 (1): 5-18.
14 Maddala, G.S. 1999. “On the use of panel data methods with cross-country data”. Annales d’économie et de statistique (55-56): 429-448.
OECD. 2007. OECD Employment Outlook 2007. Paris: OECD.
Siegel, Nico A. 2007. “When (only) money matters: the pros and cons of expenditure analysis”. In Investigating Welfare State Change: The “Dependent Variable Problem” in Comparative Analysis, eds. Jochen Clasen and Nico A. Siegel. Cheltenham: Edward Elgar.
Srinivasan, T.N. 1994. “Data base for development analysis: an overview”. Journal of Development Economics 44 (June): 3-27.
Steenbergen, Marco R., and Bradford S. Jones. 2002. “Modeling multilevel data structures”.
American Journal of Political Science 46 (January): 218-237.
Strauss, John, and Duncan Thomas. 1996. “Measurement and mismeasurement of social indicators”. American Economic Review 86 (May): 30-34.
Temple, Jonathan. 1999. “The new growth evidence”. Journal of Economic Literature 37 (March): 112-156.
Tukey, John W. 1962. “The future of data analysis”. Annals of Mathematical Statistics 33 (March): 1-67.
UNSD (United Nations Statistics Division). 2007a. Good Practices on National Official Statistics. Website. http://unstats.un.org/unsd/dnss/gpintro.aspx (12 November 2007).
UNSD (United Nations Statistics Division). 2007b. Committee for the Coordination of Statistical Activities. Website. http://unstats.un.org/unsd/workpartner_ccsa.htm (12 November 2007). Widner, Jennifer. 1999. “Maintaining our knowledge base”. APSA-CP Newsletter 10 (Summer): 17-21.
World Bank. 2007. Statistical Capacity Building. Website. http://go.worldbank.org/2OZ8NF6XU0
The purpose of this part of the report is to illustrate some problems of comparability and data
quality that users of contextual data may encounter. By examining a limited number of variables
and indicators, we seek to demonstrate that even widely used statistics from reputable sources
can be prone to comparability problems. Even though we only examine a few types of data in
detail, the chapters in this part exemplify a more general argument: countries frequently use
slightly different definitions and methodologies when they collect contextual statistics, and users
of such data should therefore interpret differences across countries and regions with caution.
The part is organised in five chapters, the first of which is concerned with regional-level
data. After a brief presentation of the European Union’s system for classifying regions at various
levels, the chapter discusses some of the problems of comparability that affect regional-level data
in general.
The next three chapters focus on three widely used statistics collected by national
statistical offices: gross domestic product (GDP) data (Chapter 2), unemployment rates (Chapter
3), and education statistics (Chapter 4). In all these areas, national governments and international
organisations have spent decades coordinating the collection of data in order to ensure
comparability across countries. Yet as we show in our review, some differences remain when it
comes to how countries define and measure GDP, unemployment and education. Our discussion
of these topics thus illustrates that ESS users should be mindful of comparability problems even
when using highly standardised contextual data.
Nonetheless, the reliability problems associated with these three statistics are small
compared with the data we examine in the final chapter. In Chapter 5 we turn to indicators of
various aspects of political systems, an area were governments generally do not collect much data.
Datasets with political indicators are therefore usually compiled by non-governmental
organisations and individual research projects. However, scholars frequently disagree when it
comes to how central political concepts should be defined and measured, hence political
16
Chapter 1: Regional-level data
Most countries are characterised by internal diversity (Dogan 1994: 41-42), and many users of
ESS data will therefore find contextual data at a regional level useful.23 Furthermore,
regional-level data are of particular relevance to ESS users, since the surveys contain information on the
respondents’ region of residence. Most of the data sources examined in this report publish data at
country level only, but some also provide data on lower levels of aggregation. For practical
purposes, the main source of regional data in Europe is Eurostat, which strives to compile
statistics that are comparable across countries and regions.24 Still, producing comparable
regional-level data poses some specific problems that users of the data should be aware of.
1.1 The NUTS system
Eurostat (and some other data sources) publishes regional data according to the nomenclature of
territorial units for statistics, which is usually referred to by the French acronym NUTS
(nomenclature des unités territoriales statistiques). The nomenclature was established in the early
1970s in order to provide a single, coherent system for dividing up the then European
Community’s territory.25 The main purpose of the system was to facilitate the production of
comparative regional statistics (Eurostat 2002: 3), in large part in order to address the needs that
arose as the community started to develop regional policies. A community regulation adopted in
May 2003 gave the NUTS system legal status in EU countries (Eurostat 2007a: 4). Several other
countries, such as members of the European Free Trade Association (EFTA) and candidate
countries for the EU, have adopted similar regional classifications.
When the regional breakdown was established in the 1970s, the categorisation was largely
determined by the political needs to differentiate between the main administrative divisions of
France and Germany, the two dominant states in the European Community at the time (Casellas
and Galley 1999: 552). Hence the classification divides countries into three main regional levels:
NUTS 1 (corresponding to German Länder), NUTS 2 (French régions) and NUTS 3 (French
départments). The various levels are organised in a nested hierarchy, so that each country is subdivided into a whole number of regions at level 1, each of these is then divided into regions at
23 In this report, the term “region” or “regional” is generally used to denote a subdivision of a sovereign state, e.g.
German Länder or French régions. A region is thus a tract of land with marked boundaries, which may (but need not) serve as an administrative unit below the level of the nation state (Eurostat 2007a: 2). Note that many international agencies use the term in reference to a group of countries or an entire continent, e.g. eastern Europe or Africa.
24 The primary source of Eurostat’s regional data is usually national statistical offices.
25 Lists with codes and names and occasionally maps of NUTS regions were published in internal Eurostat papers
17 level 2, which again are divided into regions at level 3.26 A particular territorial unit may be
classified as several levels; Hamburg in Germany, for instance, is a region at levels 1, 2 and 3
(Eurostat 2007c). At the beginning of the 1990s, two further levels were defined in accordance
with the same principles: local administrative unit (LAU) 1 and 2.27 Only the last and smallest of
these – LAU 2, usually corresponding to the concept of municipality – has been fixed for all
member states of the European Union (Eurostat 2007a: 6).
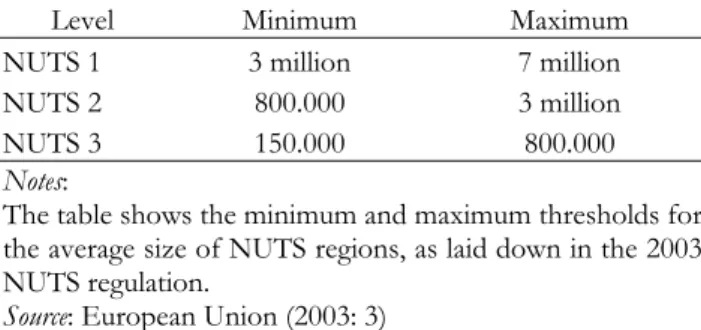
The division of a country into NUTS regions is largely determined by two factors:
population size and existing administrative units. The regulation adopted in 2003 specifies the
minimum and maximum thresholds for the average population size of regions at the three levels
in a country, as shown in Table 1.1.
Table 1.1: Average population size of regions
Level Minimum Maximum NUTS 1 3 million 7 million
NUTS 2 800.000 3 million
NUTS 3 150.000 800.000
Notes:
The table shows the minimum and maximum thresholds for the average size of NUTS regions, as laid down in the 2003 NUTS regulation.
Source: European Union (2003: 3)
If the population size of a country is below the minimum threshold for a given NUTS level, the
whole country is classified as one territorial unit for this level (European Union 2003: 3).
The regional classification is to a large extent based on the administrative divisions
applied in the various countries, mainly because these are often used by the national statistical
offices for data collection and dissemination. Hence when applying the NUTS system to a
particular country, the first step is an analysis of its administrative structure. If the average size
(mainly in terms of population) of the territorial units at an administrative level corresponds more
or less with one of the NUTS levels, the administrative structure is adopted in its entirety as the
regional breakdown for this level. If, on the other hand, no administrative structure has an
average size similar to the thresholds laid down in the regulation, a non-administrative level is
created by grouping together smaller administrative units (Eurostat 2007c: 7).
26 This has not always been the case. In an earlier version of the nomenclature, not all level 1 regions in Belgium were
divided into a whole number of level 2 regions. Brussels was a separate region at levels 1 and 3, but part of the province of Brabant at level 2 (Dunford 1993: 733). In the present version, Brussels is a separate region at all three levels.
27 Prior to July 2003, LAU 1 and 2 were denoted NUTS 4 and 5 respectively (Eurostat 2007e), but references to the
18 The larger EU countries usually have functional administrative units corresponding to
two of the three NUTS levels. This may be, for example, at levels 1 and 3 (respectively the Länder
and Kreise in Germany), or at levels 2 and 3 (comunidades autónomas and provincias in Spain). In order to complete the breakdown, a third level is created in each country. This additional level may be
based on a regional structure that is less extensively used for administrative functions, or it may
be created solely for statistical purposes (ibid: 6). The smaller states often have administrative
units only at one of the three levels; hence two additional, non-administrative levels must be
created in an ad hoc fashion. This is the case, for example, with Bulgaria and Portugal.
Table 1.2 shows the number of regions in the 27 member states of the EU according to
the 2003 version of the nomenclature, and the average population size of the regions.
Non-administrative levels are in grey. The table also contains information on the statistical regions in
19
Table 1.2 Number of statistical regions and average population size in thousands
Level 1 Level 2 Level 3
Country No. Av. pop. Size No. Av. pop. size No. Av. pop. size
EU member states:
Austria 3 2 736 9 912 35 234
Belgium 3 3 482 11 950 43 243
Bulgaria 2 3 881 6 1 294 28 277
Cyprus 1 749 1 749 1 749
Czech Republic 1 10 221 8 1 278 14 730
Denmark 1 5 411 1 5 411 15 361
Estonia 1 1 347 1 1 347 5 269
Finland 2 2 618 5 1 047 20 262
France 9 6 903 26 2 390 100 621
Germany 16 5 156 41 2 012 439 188
Greece 4 2 771 13 853 51 217
Hungary 3 3 366 7 1 443 20 505
Ireland 1 4 109 2 2 055 8 514
Italy 5 11 692 21 2 784 103 568
Latvia 1 2 306 1 2 306 6 384
Lithuania 1 3 425 1 3 425 10 343
Luxembourg 1 455 1 455 1 455
Malta 1 403 1 403 2 201
Netherlands 4 4 076 12 1 359 40 408
Poland 6 6 362 16 2 386 45 848
Portugal 3 3 510 7 1 504 30 351
Romania 4 5 415 8 2 707 42 516
Slovakia 1 5 385 4 1 346 8 673
Slovenia 1 1 998 1 1 998 12 166
Spain 7 6 148 19 2 265 52 828
Sweden 1 9 011 8 1 126 21 429
United Kingdom 12 4 975 37 1 613 133 449
EU 27 95 5 159 267 1 836 1284 382
Non-EU countries:
Croatia 1 4 444 4 1 111 21 212
Iceland 1 294 1 294 1 294
Liechtenstein 1 35 1 35 1 35
Norway 1 4 606 7 658 19 242
Switzerland 1 7 415 7 1 059 26 285
Turkey 12 6 005 26 2 772 81 890
Notes:
Number of NUTS regions at levels 1, 2 and 3 in EU member states according to the 2003 NUTS regulation, and average population size of the regions on 1 January 2005 (in thousands). Population data for France and the United Kingdom from 1 January 2004. Non-administrative levels are in grey. For non-EU countries, the table shows the number of statistical regions at the corresponding levels as of 2007, and average population size of the regions in 2005 (in thousands). Information on non-administrative levels is not provided for non-EU countries. Sources:
20
1.2 Comparability of regional data
There are at least three problems associated with the use of the NUTS system in comparative
analysis. First, even though the classification is supposed to form a coherent system of regional
units, it remains very heterogeneous in character. With some exceptions – notably countries that
are too small to be subdivided into regions at levels 1 and 2 – the average size of the regions in
the countries fall within the upper and lower thresholds specified by the regulation (see Table
1.2). However, within each country, the size of regions at the same level varies considerably. For
example, of the 277 level 2 regions for which population figures are available for 2004, 39 had a
population of over 3 million, while 70 had fewer than 800.000 inhabitants. Thus, nearly 40% of
the regions at level 2 fall outside the thresholds set for the average size of regions at this level.
The differences between the biggest and smallest regions (in terms of population size) are even
more striking: the two most populous regions – Lombardi in Italy and Île de France – have about
10 million inhabitants, while the three least populous ones have less than 100.000 (the Finnish
autonomous region of Åland and the Spanish autonomous regions of Melilla and Ceuta).28
Regions at the same level are often markedly different in other respects as well. Casellas
and Galley (1999: 553) note that the level 2 units encompass a wide range of different
geographical areas: cities and metropolitan areas (Hamburg, Île de France, Greater London),
small countries (Luxembourg, Denmark), agglomerations of small islands (Voreio Aigaio, Åland),
remote territories (Guyane, Réunion) and huge rural regions (Calabria, Alentejo). Several scholars
have pointed out that it is problematic to treat these units as comparable, and that the regional
classification may have negative implications for cross-sectional analyses (e.g., Boldrin and
Canova 2001: 212-213; Dunford 1993: 727). Casellas and Galley (1999), for example, find that
the regional disparities within the EU are overstated as an artefact of the regional definitions laid
down in the NUTS system.29
A second and related issue concerns the accuracy of certain types of data. In some cases
the borders between territorial units are drawn in such a way that regional data are quite
misleading. For example, GDP statistics may sometimes leave the impression that large cities
have a much higher income per person than is actually the case. The example of the city of
Hamburg, pointed out by Boldrin and Canova (2001: 212), is illustrating. Hamburg is a level-2
28 The data cited in this paragraph were retrieved the General and regional statistics-domain in Eurostat’s (2007b)
Dissemination Database.
29 For ESS users, this problem is exacerbated by the fact that the regional level assigned to the respondents in the
21 region with one of the highest incomes per person in the EU. But a substantial amount of the
work force in the city commutes from the nearby regions of Schleswig-Holstein and Lower
Saxony, thus contributing to the GDP of Hamburg without residing there. As a result, the GDP
per person of Hamburg is overstated by about 20% relative to its effective population, while that
of the neighbouring regions is understated. Similar arguments could be repeated for most
metropolitan areas and many other types of data (ibid.).
And third, there have been a number of changes in the NUTS structure over the years.
The reliance on the administrative divisions of countries means that changes in these lead to
changes in the corresponding NUTS level. The regulation adopted in 2003 sought to limit the
frequency of changes in the statistical regions, and amendments to the structure can now be
made only every three years (European Union 2003: 1, 3). Still, past and future changes in the
regional breakdown may cause problems for the comparability of regional data over time. Even
though most agencies that publish regional data try to compile statistics in accordance with a
stable regional breakdown, it is sometimes difficult to do this in practice. For example, all data in
Eurostat’s Regio Database respects the latest version of the NUTS, at least in principle.30
Countries where the regional breakdown has changed between the latest and earlier versions are
asked to supply Eurostat with historical data according to the latest classification. But national
statistical offices are, unfortunately, often negligent about sending historical data, hence certain
regional statistics may be lacking for some regions (Eurostat 2005: 14).
Furthermore, even when regional statistics are published in accordance with a stable
regional classification, it may be difficult for ESS users to use them as contextual data. In the ESS
datasets, the region variable, which places respondents by their region of residence, usually
follows the nomenclature that was valid when the survey was carried out. This means that it may
be difficult to get access to contextual data corresponding with the classification in the ESS
datasets in cases where the regional breakdown in a country has changed after a survey has been
conducted. For example, in the ESS 2002/2003 survey, the region variable is coded in
accordance with the 1999 version of the NUTS structure, in which Finland was divided into six
regions at level 2. After a major rearrangement of the regional division in Finland in 2003, the
number of level 2 regions was reduced to five and the borders of most regions were redrawn
(Eurostat 2005: 9). Since Eurostat only publishes regional data following the current version of
the NUTS system, the changes in Finland means that it is now difficult to find contextual data
30 Similarly, the CivicActive project’s election statistics are published in accordance with the 2003 version of the
22 that corresponds with the regional breakdown in the 2002/2003 survey.31 This problem is likely
to persist in the future, as the NUTS structure will change from time to time. A new
nomenclature that will enter into force on 1 January 2008 will entail changes in several countries,
leading to some differences between the regional breakdown in the first three rounds of the ESS
and the classification that Eurostat will follow from 2008 onwards. The number of regions in
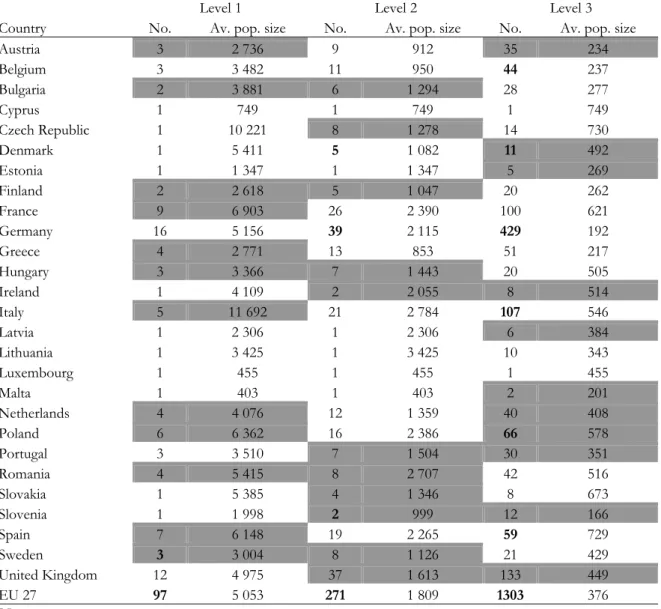
each EU member state according to the new NUTS version is shown in Table 1.3.
31 Regional data corresponding with the former regional breakdown can still be found in databases maintained by
23
Table 1.3 Number of NUTS regions in EU countries and average population size, 2006 regulation
Level 1 Level 2 Level 3
Country No. Av. pop. size No. Av. pop. size No. Av. pop. size
Austria 3 2 736 9 912 35 234
Belgium 3 3 482 11 950 44 237
Bulgaria 2 3 881 6 1 294 28 277
Cyprus 1 749 1 749 1 749
Czech Republic 1 10 221 8 1 278 14 730
Denmark 1 5 411 5 1 082 11 492
Estonia 1 1 347 1 1 347 5 269
Finland 2 2 618 5 1 047 20 262
France 9 6 903 26 2 390 100 621
Germany 16 5 156 39 2 115 429 192
Greece 4 2 771 13 853 51 217
Hungary 3 3 366 7 1 443 20 505
Ireland 1 4 109 2 2 055 8 514
Italy 5 11 692 21 2 784 107 546
Latvia 1 2 306 1 2 306 6 384
Lithuania 1 3 425 1 3 425 10 343
Luxembourg 1 455 1 455 1 455
Malta 1 403 1 403 2 201
Netherlands 4 4 076 12 1 359 40 408
Poland 6 6 362 16 2 386 66 578
Portugal 3 3 510 7 1 504 30 351
Romania 4 5 415 8 2 707 42 516
Slovakia 1 5 385 4 1 346 8 673
Slovenia 1 1 998 2 999 12 166
Spain 7 6 148 19 2 265 59 729
Sweden 3 3 004 8 1 126 21 429
United Kingdom 12 4 975 37 1 613 133 449
EU 27 97 5 053 271 1 809 1303 376
Notes:
Number of NUTS regions at levels 1, 2 and 3 according to the 2006 NUTS regulation, and average population size of the regions on 1 January 2005 (in thousands). Population data for France and the United Kingdom from 1 January 2004. The 2006 regulation will enter into force on 1 January 2008, and entails changes in the number of regions at one or more levels in eight countries (Belgium, Denmark, Germany, Italy, Poland, Slovenia, Spain and Sweden; changes indicated by figures in bold). Non-administrative levels are in grey.
Sources:
Adapted from Eurostat (2007a: 7-8). Population data from the General and regional statistics-domain in Eurostat’s (2007b) Dissemination Database.
A possible solution to this problem could be to harmonise (e.g., aggregate or disaggregate) the
available contextual data to bring them in accordance with the regional classification in the ESS
surveys. But this would require detailed information on the changes in the nomenclature over the
years, and such information is, unfortunately, not always available. Changes in the period 1981-99
24 adoption of the 2003 version of the NUTS system can be found on a separate Eurostat website,32
and some of the subsequent changes are documented in Eurostat’s annual series European Regional and Urban Statistics: Reference Guide. However, it is not always possible to trace from which region to which region a territory has been moved, nor is it possible to document the extent of the
changes in terms of surface area or population. Furthermore, there have been a number of
territorial changes that have not been reported, and though Eurostat has tried to compile a list of
such changes this list is not complete (Eurostat 2002: 5).33 It is therefore difficult to find a
method of harmonising regional data in a way that would bring Eurostat’s regional-level
contextual data in accordance with survey data from the ESS.
1.3 The NUTS system and electoral districts
The harmonisation problem is further accentuated when it comes to regional election data. Not
only are electoral districts subject to their own changes; they also rarely correspond with the
NUTS structure. In a few cases, such as Norway, the electoral districts coincide with the NUTS 3
level, and in some cases electoral districts correspond with a lower level of the nomenclature,
such as LAU 1 or 2. But electoral districts frequently maintain an entirely separate structure. Still,
election authorities often publish results according to counties or municipalities, and as a result it
is usually possible to get hold of data corresponding to the NUTS structure.
In order to adjust election data to the nomenclature, it is often necessary to aggregate or
disaggregate the data. For some countries this is a fairly straightforward procedure, as in the case
of Greece where 56 electoral districts can be aggregated to form the 51 level 3 units. In other
cases, such as Belgium, both disaggregation and aggregation at fairly low levels must be
performed only to attain results at level 2. But for some countries it is simply not possible to
adjust election data to the NUTS system, since there is no overlap in electoral and administrative
structures. Ireland is a case in point: the country is divided into two level 2 units and eight level 3
units, while electoral districts vary according to census polls.34
Aggregation of LAU 1 or LAU 2 data not only requires knowledge of which electoral
units belong to which NUTS unit, but it can also easily become quite time-consuming, especially
in the case of larger countries. Working with electoral data in a NUTS context thus poses the
32 See Eurostat (2007d). From the website it is possible to download a detailed correlation table from NUTS 1999 to
NUTS 2003 and vice versa.
33 This will probably be less of a problem with future changes, since the NUTS regulations oblige EU member states
to inform Eurostat of any changes in the regional breakdown (European Union 2003: 3).
34 Ireland and Malta periodically delimit their electoral districts, as the single transferable vote electoral system