UNIVERSIDADE DA BEIRA INTERIOR
Ciências Sociais e Humanas
Driving Factors of the Adoption of Electric
Vehicles- a panel approach
(Versão final após defesa pública)
Ana Isabel Carneiro Rocha
Dissertação para obtenção do Grau de Mestre em
Economia
(2º ciclo de estudos)
Orientador: Professor Doutor José Alberto Serra Ferreira Rodrigues Fuinhas
Coorientador: Professor Doutor António Manuel Cardoso Marques
ii
Resumo alargado
O setor dos transportes é crucial para a atividade económica, sendo este reconhecido como um dos setores mais poluentes da economia, é necessária uma transição para uma tecnologia limpa e que permita reduzir a emissão de gases poluentes para atmosfera. De modo a combater as alterações climáticas é necessário desenhar políticas que relembrem a população das consequências e causas das alterações climáticas. A introdução do veículo elétrico pode permitir a diminuição da dependência de combustíveis fósseis (petróleo), diminuir as emissões de dióxido de carbono e melhorar a qualidade do ar. Contudo, o presente trabalho foca-se na análise dos fatores que promovem a compra de veículos elétricos face aos veículos convencionais. Para além disto, também pretende observar se os fatores que influenciam a compra de veículos 100% elétricos são idênticos aos fatores que influenciam a compra de veículos híbridos plug-in.
O estudo utiliza dados em painel com frequência anual, o horizonte temporal é de 2010 a 2015, para vinte países da Europa. Os veículos elétricos foram introduzidos no mercado elétrico em 2010, sendo este um horizonte temporal curto para recorrer a técnicas de séries temporais. A utilização de métodos de séries temporais pode levar ao enviesamento da estimação devido à omissão de variáveis. Enquanto que a análise de dados em painel permite aumentar o número de observações. Procedendo-se à análise empírica, foram realizados os testes: Modified Wald, que nos indica a presença de heterocedasticidade; Wooldridge, demonstra a autocorrelação contemporânea e utilizou-se, também, o teste Pesaran para observar a dependência entre países. Após a realização dos testes, foi detetada a presença de heterocedasticidade e correlação contemporânea entre países o que nos indica que o estimador Panel Corrected Santard Error (PSCE) é o mais apropriado. De modo a investigar quais os fatores que permitem aumentar a percentagem de veículos elétricos no mercado automóvel foram estimados três modelos. No primeiro modelo é utilizada como variável dependente a soma dos veículos puros elétricos com os veículos plug-in híbridos, no segundo modelo estimado é utilizado apenas o número de veículos 100% elétricos, no terceiro modelo é utilizada como variável dependente o número de veículos híbridos plug-in. Procedeu-se à estimação de três modelos para observar se os fatores que influenciam a compra são idênticos para os veículos 100% elétricos e para os veículos híbridos plug-in.
Os resultados demostram que o preço da eletricidade e os transportes públicos são fatores que restringem a compra tanto de veículos puros elétricos como veículos híbridos plug-in. Os fatores socioeconómicos apenas influenciam a compra de veículos 100% elétricos. O preço do petróleo tem efeito positivo na compra destes veículos, o que contraria de certa forma a
iii revisão de literatura, o que pode ser explicado devido ao horizonte temporal do estudo ser apenas cinco anos não permitindo a observação da volatilidade dos preços do petróleo. Tendo ainda em conta que o número de veículos elétricos em circulação é reduzido. A introdução destes veículos no mercado automóvel tem um grande impacto na rede elétrica, sendo necessário implementar medidas que permitam controlar a procura de eletricidade, transferir a procura de eletricidade em hora de pico para os períodos de vazio, o que irá permitir maximizar a utilização das fontes renováveis. As infraestruturas de carregamentos são um fator crucial para aumentar o número de veículos elétricos, uma vez que permitem aumentar a autonomia do veículo. Para além de aumentar os postos de carregamento públicos também será necessário analisar a sua localização. Deve ser definida uma estratégia que permita localizar os postos onde as pessoas estacionam os seus veículos por longos períodos de tempo tais como: locais de trabalho, universidades, estações de comboios. Na estimação dos modelos: modelo [I] e modelo [II] os resultados obtidos são similares, uma vez que o número de veículos 100% elétricos é superior aos dos veículos híbridos plug-in.
iv
Resumo
Motivado pela dependência do petróleo e pelos danos ambientais que os transportes produzem, o foco tem sido o desenvolvimento de novos modelos de mobilidade, tais como os veículos elétricos. Este artigo pretende analisar os fatores que influenciam a compra de veículos elétricos. Neste trabalho são utilizadas técnicas de dados em painel que abrange vinte países europeus com frequência anual e um horizonte temporal de 2010 até 2014. Os fenómenos de correlação contemporânea entre países e heterocedasticidade foram detetados o que indica que o estimador mais apropriado é o Panel Corrected Santard Error. De modo a distinguir as diferenças entre os tipos de veículos elétricos foram estudados os veículos 100% elétricos e os veículos híbridos plug-in, bem como a soma de ambos. Os resultados demonstram que os fatores socioeconómicos influenciam positivamente a compra de veículos 100% elétricos. O preço da eletricidade e os transportes públicos em todos os modelos têm um efeito negativo na compra de veículos elétricos, o que nos indica que estes fatores restringem a adoção desta forma alternativa de mobilidade.
Palavras-chave
v
Abstract
Motivated by the energy dependence on oil and the impact of environmental damage, people from all around the world have been compelled to focus on new models of mobility such as Electric Vehicles. This paper analyses the factors that promote the use of Electric Vehicles. Working upon a panel of twenty European countries, during the time span from 2010 to 2014, the phenomena of contemporaneous correlation and heteroscedasticity were detected, baking of the Panel Corrected Standard Error estimator. In order to distinguish between different types of Electric Vehicles it was decided to study the Battery Electric Vehicle (pure electric vehicle), the Hybrid Electric Vehicles, and a combination of both. The results show that socioeconomic factors positively influence the adoption of Battery Electric Vehicles. In all models, the electricity price and public transportation have a negative effect in adoption of Electric Vehicle. This suggests that these factors restrict the purchase of this technology.
Keywords
vi
Index
1. Introduction 1
2. Electric Vehicles development 3
2.1. The purchase incentives 3
2.2. How many vehicles are sold? 4
2.3. How do they work 5
2.4. Charging Infrastructures 6
3. On the factors of EVs growth: debate in the literature 9
3.1. Literature overview 9
3.2. Variables and hypothesis 9
4. Data and Methodology 13
5. Results and Discussion 15
5.1. Results 15
5.2. Discussion 18
6. Conclusion and policy implications 20
References 22
vii
Figures List
Figure 1 – National subsidies when buying an electric vehicle in selected countries
in 2016, by type (in U.S. dollars per vehicle). 3 Figure 2 – Battery Electric Vehicles and Plug-in Hybrid Electric Vehicles, new
registrations, by country, in 2015 (thousands). 5 Figure 3 – Market estimates for Lithium-ion battery used in EVs (in million U.S.
dollars). 6
Figure 4 – Number of charging infrastructures, by EU-28. 7 Figure 5 – Expected relationships between the variables and factors to promote
viii
Tables List
Table 1 – The different types of charging. 7
Table 2 – Description of Models. 13
Table 3 – Specification tests. 13
Table 4 - The results for Model [I], Electric Vehicle, jointly BEVs and PHEVs. 15 Table 5 – The results, Electric Vehicles, jointly BEVs and PHEVs with Random
Effects 16
Table 6 - The results for Model [II], BEVs. 17 Table 7 - The results for Model [III], PHEVs. 17 Table A1 – Description of variables, source and statistics 25
ix
Acronyms List
AC Alternating Current BEVs Battery Electric Vehicles CO Carbon Monoxide CO2 Carbon Dioxide
COP21 The 21st Conference of the Parties DC Direct Current
DR Demand Response
DSM Demand Side Management EU European Union
EVs Electric Vehicles FE Fixed Effects
FGLS Feasible Generalized Least Squares GHG Greenhouse effect gas
HEV Hybrid Electric Vehicles HC Hydrocarbons
IPI Industrial Production Index LR Likelihood Radio test NOX Nitrogen Oxides
PCSE Panel Corrected Standard Error PHEV Plug-in Hybrid Electric Vehicles PM Particulate Matter
RE Random Effects
RESET Regression Equation Specification Error Test TCO Total Cost of Ownership
TOU Time-of-Use
UNFCC United Nations Framework Conventional on Climate Change V2G Vehicle-to-Grid
1
1. Introduction
The transport sector is crucial for economic growth. Right now, it is facing a huge challenge in making a transition to new and cleaner technologies that will reduce the emission of harmful gases. The challenge of fighting climate changes has now become a recurring theme for the energy policy design. The 21st Conference of the Parties (COP21) under the United Nations Framework Conventional on Climate Change (UNFCC), which was held in Paris in December 2015 reminded us of the urgent need to reinforce the joint global response to the threat of climate change. The transport sector is widely recognized as one of the most polluting sectors and, as such, it is a crucial piece of the energy transition process. For that, it must swiftly follow the worldwide trend of electrification, which includes the development of Electric Vehicles (EVs) capable of reducing the emission of harmful gases.
Electric Vehicles (EVs) can be divided into Hybrid Electric Vehicles (HEVs), Plug-in Hybrid Electric Vehicles (PHEVs) and Battery Electric Vehicles (BEVs). HEVs are driven by both an internal combustion engine that is powered by gasoline, diesel, methane or liquid gas, and an alternative electric motor, which is powered by electricity stored in a battery. These vehicles combine high autonomy with low carbon dioxide (CO2) emissions, when compared to
conventional vehicles. The batteries of these cars are charged by regenerative braking systems or by their combustion engines. In the same way, PHEVs use both an electric motor powered by batteries and an internal combustion engine powered by fossil sources. PHEVs generally have larger batteries than the hybrids and can also be charged from mains electricity. These vehicles can run solely on electricity or a specific fossil fuel. BEVs (also known as 100% EVs) only use batteries to power an electric motor, with the number of these vehicles increasing significantly (Brenna et al. 2012).
The European Parliament, following inter-institutional negotiations, has taken measures to enable Member States to develop national policies to promote alternative fuels and their infrastructures, and to provide consumers with information on the comparative prices of alternative and traditional fuels. In particular, the new "Directive for the deployment of alternative fuels infrastructure", requires member states to construct a minimum number of infrastructure facilities for alternative fuels such as electricity, hydrogen and natural gas (Europen Commission 2014). In the case of electricity, this directive compels all the member states to build public charging points by 2020, in order to ensure that EVs can at least circulate in urban and suburban areas. Therefore, the number of a recharging infrastructures should be built taking in to consideration the number of EVs. The number of charging infrastructures should be, in average, equivalent to at least one recharging infrastructure point per vehicle. This directive makes it compulsory to use a common plug throughout the European Union (EU) to allow the movement of these vehicles across the EU (European Commission 2014).
2 Nowadays the EVs only have a small market share in the automotive market but, within just a few decades, it should be much more meaningful, bringing the purpose of this paper to study the factors that influence the adoption of EVs. To the adoption of these technologies, a separate analysis of the BEVs, PHEVs and a combination of both types, will allow compare and conclude about the eventual need of specific policies for each type of vehicle. The paper has two research question, actually: (a) what are the factors that promote the purchase of EVs, as opposed to conventional vehicles; and (b) are these factors identical for all BEVs and PHEVs. Therefore, the main objectives for this paper are: (i) to analyse the differences between the BEVs and PHEVs, in order to understand which policies should be establish for each type; (ii) to show the importance of the interaction of EVs and renewable energy; and (iii) to study the influence of incentive policies on the number of EVs in circulation. To do that, a Panel Corrected Standard Error (PCSE) estimator was used to analyses a panel of twenty European countries, for the annual data time span from 2010 to 2014. The results show that the number of charging infrastructures are significant for all models, suggesting this variable is a crucial factor to increase the number of EVs in automotive market. Our contribution in this paper is to confirm that the environmental awareness is an important factor, considering that consumers are sensitive to climate issues such as global warming.
The reminder of this paper is organized as follows: section 2 describes the developing of EVs; section 3 revises the literature and supports the research hypothesis; section 4 describes the period studied and the methodology used. The results and discussion are presented in section 5 and lastly, the section 6 concludes.
3
2. Electric Vehicles development
This section it will be divided into sub-sections: 2.1 the purchase incentives that are offered by the Government, in 2.2 will be discussed the number of EVs that are sold in some countries, in 2015, in 2.3 will be described how do work the EVs, where we will explain the relationship between the consumption of lithium and the sales of EVs and in 2.4 we will analyse the evolution of charging infrastructures.
2.1. The purchase incentives
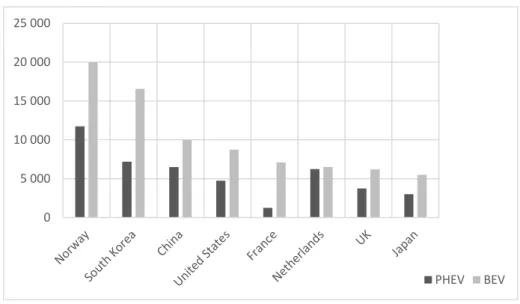
The purchase incentives of EVs it is a way of encouraging the consumers to opt for EVs instead of a conventional vehicle. These incentives are observed primarily on countries with higher share of EVs into the automotive market. Namely, 80% of EVs only move in countries, such as: Norway, Japan, Unites States, China and the Netherlands.
0 5 000 10 000 15 000 20 000 25 000 PHEV BEV
Figure 1: National subsidies when buying an EV in selected countries in 2016, by type (in U.S. dollars per vehicle).
SOURCE: https://www.statista.com
The characteristic of purchase incentive is explored in the list below:
● In Norway, the EVs are exempt from purchase taxes (USD 12 000). The 100% electric vehicles are exempt from Value-Added Tax (VAT), but this measure does not apply to PHEVs (Mock, 2014).
4 ● In China, the EVs are exempt from excise tax and from the acquisition tax, being based on engine displacement and price (Mock, 2014). In 2016, the value of incentives was in the range of USD 6 500 for PHEVs and USD 10 000. According to Mock, 2014, the incentives for BEVs should be higher.
● In the United States, in 2016, the American buyers of PHEVs could reduce the cost of their vehicle by USD 4 750, when compared to the purchase of a conventional vehicle, and for a BEVs they were able to reduce the cost in USD 8 750.
● In France, in 2013, the purchase incentives for BEVs were USD 7100 (vehicles emitting less than 20 grams of CO2 per kilometer [g CO2 /km]) and for PHEVs was offered USD 1 100
(vehicles emitting between 20 [g CO2 /km] and 60 [g CO2 /km]). Being the same value in 2016,
as it is possible to observe in the Figure 1.
● In the Netherlands, in 2016, the BEVs were exempt from paying the registration tax. For other vehicles, there is a differentiated taxation, according to the levels of CO2 emissions. For
PHEVs, the consumers pay EUR 6 per [g CO2 /km] and for vehicles fed by diesel emitting more than 70 [g CO2 /km], the consumers would pay EUR 86 per [g CO2 /km]. This kind of taxation allows to benefit the consumers that opt to purchase BEVs and PHEVs.
● In Portugal, BEVs are exempt from vehicle registration and circulation tax.
● In the United Kingdom (UK), the consumers that pretend to acquire a BEV could reduce the cost into USA 6 200 and for a PHEV could reduce the total cost into USD 3 750.
● According to Lutsey (2015), in Japan, the subsidies are based on the price difference between an EV and conventional vehicle. In 2016, the incentives increase allowed the Japanese’s to reduce their cost by purchasing vehicles about USD 3 000, if they choose a PHEV. However, if they choose a BEV they could save about USD 5 500.
In accordance with the literature, the fiscal and financial incentives are a significant factor to influence the consumers to opt for EVs. Therefore, the policymakers should have in consideration: when they should implement incentives for EVs; analyze how the vehicles taxation schemes are structured; which incentives influence the consumers; the countries with a higher number of EVs registered and levy substantial taxes on high-emitting vehicles.
2.2. How many vehicles are sold?
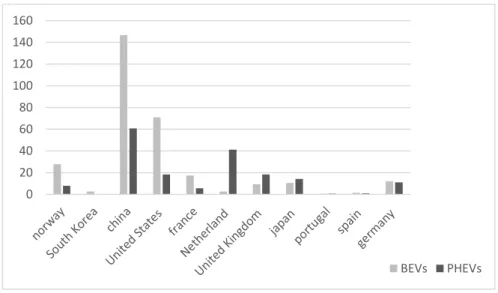
In Europe, initially the manufactures start to promote the BEVs and then start to produce the PHEVs, being these vehicles a recent technology. Relatively the sales of the EVs, in some countries, this technology has a few available models in comparison to the conventional vehicles. The EVs sales vary significantly across the world. The demand for BEVs and PHEVs varies between countries and that factor could be explained due to the fiscal and financial incentives that the Government offer.
5 0 20 40 60 80 100 120 140 160 BEVs PHEVs
Figure 2: BEVs and PHEVs, new registrations, by country, in 2015 (thousands).
SOURCE: https://www.statista.com
On Figure 2, it is possible to observe that China has the highest number of EVs registrations, for both (BEVs and PHEVs), once about 200 000 EVs were sold in 2015. The United States has the second-highest of number of EVs registration, about 90 000 EVs. Countries such as the Netherlands and Norway, the structures of the two markets, BEVs and PHEVs are completely different. While in the Netherlands we observe that the number of PHEVs registered is higher than the number of BEVs, in Norway the BEVs account for most of the automotive market. In 2015, most of the EVs were sold in: China, Japan, Norway, The Netherlands, France, Germany and the United Kingdom.
2.3. How do they work?
Electric motors are moved using electricity stored in batteries. These motors present several advantages over conventional motors, such as, greater durability, lower cost of maintenance and reduction of noise pollution, which in large cities will have a significant impact on the noise (Alexander and Gartner 2012).
6 0 500 1 000 1 500 2 000 2 500 3 000 3 500 4 000 2012 2013 2014 2015 2016 2017 2018 2019 2020
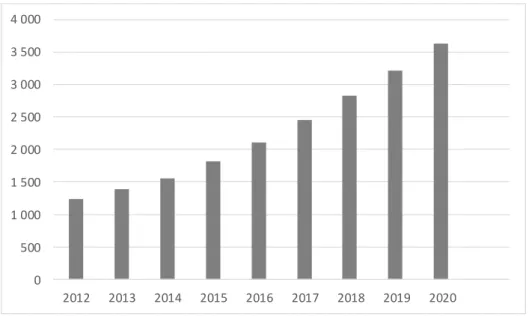
Figure 3: Market for Lithium-ion battery used in EVs (in million U.S. dollars).
SOURCE: https://www.statista.com
The clear majority of EVs use lithium, which allows greater capacity to store electricity and increases the lifespan. As it is possible to observe on Figure 3, the consumption of lithium increased considerably. The same was verified in the sales of EVs. The battery is the main component of the EVs, thus it is fundamental more research and development concerning the battery, which will allow an increase of the vehicle autonomy and to improve its performance.
2.4. Charging infrastructure
With the increase in the number of EVs in circulation, it is necessary to increase the number of charging infrastructures. In several European countries, there has been a significant increase in these infrastructures. On Figure 4 it is possible to observe that in 2010 the number of accessible public points was approximately 3000, while in 2016 the number of charging points is more than 100 000. As the autonomy of these vehicles is limited, it is essential to improve the technology to charge the vehicle in less time, and this is an important factor influencing the behavior of consumers. The charging points are a crucial factor for the BEVs since it only owns the electric motor, while the PHEVs have an alternate engine powered by fossil fuels. There are three ways to charge an EV:
● Plug-in charging, is the most common in Europe, in which vehicles are connected to a charging infrastructure using one cable and plug. This type of charge can occur at household or public places. The charging of the vehicle lasts approximately 8 hours;
7 ● Battery swapping, this charging involves replacing the battery with a charged one, this change occurring one at a special station. It is a quick way to charge the vehicles, but it presents faults, as the size does not adapt to the vehicle and involves considerable costs associated with charging and swapping infrastructures;
● Wireless charging, this type of charging does not require a physical infrastructure. Instead, the system creates an electromagnetic field located around a charging pad, which is activated when the vehicle is positioned over the field. This type of charging is not yet in the market. 0 20000 40000 60000 80000 100000 120000 2010 2011 2012 2013 2014 2015 2016
normal charge =<22 Type-2AC ChaMeDo CCS Tesla SC
Figure 4: Number of charging infrastructures, by EU-28.
SOURCE: http://www.eafo.eu
There are several ways to charge the vehicle's battery through plug-in charging. Each of them can involve different combinations of power level supplied by the charging station (Kw), types of electric current used (alternating current (AC)) and direct current (DC). The power level of the charging depends on the voltage and maximum of the current power being supplied, determining the duration of the charging (Alexander and Gartner 2012). Four modes are available:
Table 1 – The different types of charging
Mode Current Time Location
Slow Charging AC 6 →8 hours Household; office buildings
Slow or Semi Fast
Charging AC 3 → 4 hours Household; office buildings Slow, Semi-Fast or
Fast Charging AC 1 →3 hours Public Charging poles; office buildings Fast Charging DC 10 → 30 minutes Motorway service or dedicated charging stations in urban areas
8 One of the frequently cited obstacles to the increase in electric vehicles is the lack of charging infrastructure. Indeed, this is a major challenge for the EV industry, and one in which policymakers must play an active role by encouraging charging infrastructure, offering direct subsidies, and guiding business strategies for companies to grow sustainably. Furthermore, policymakers should educate and encourage these companies to provide the option of charging from renewable sources. Both, EV owners and the general public should be informed of these charging options (Nienhueser and Qiu 2016).
9
3. On the factors of EVs growth: the debate in
the literature
This section merges both the scarce literature, namely empirical one, about the adoption of EVs with the operationalization of the research, by the definition of the research hypothesis. Each of them will be properly supported on that literature.
3.1. Literature overview
The electric mobility has several objectives, namely reduce greenhouse gases (GHG) emissions, reduce the fossil fuel energy dependence or even contribute to rationalize the electricity system as whole, namely by storage electricity on the off-peak periods and cutting electricity demand on the peak periods. As sated before, that kind of mobility represents only a tiny share of the total vehicles in use. To enable EVs to contribute to a sustainable future, a new paradigm of electric mobility must be created and encouraged in order to capture advantages of diversification of the electricity mix, namely the increasing penetration of renewable sources. With this in mind, and closely following the literature, the potential factors promoting the acquisition of EVs growth are categorized into six categories: (a) policy factors (financial incentives and non-financial incentives); (b) socioeconomic factors; (c) environmental factors; (d) technical of EVs factors; (e) transports factors; and (f) crude oil price factor.
3.2. Variables and Hypotheses
The literature inspired us to formulate six research hypotheses, covering the several factors potentially determinants of the EVs acquisition decision:
a) Policy factors
Policies incentives (POLICIES) have already been offered in many countries, as well as other fiscal and non-fiscal incentives, such as free car parking and privileged road access. According to Matthews et al., (2017), incentive programmes should be created for both sales staff and dealers, in which they provide information that could encourage buyers to opt for a EVs rather than a conventional vehicles. Programmes should also be developed to inform car salesmen and dealers, so that they are more knowledgeable about this innovative technology, and can explain to consumers which model and battery type is more suitable for each situation (Cahill et al. 2014). Sellers and resellers should have information about vehicle costs and EVs -related incentives, and explain about the different types of charging (normal or fast)
10 and their duration (Matthews et al. 2017). In order to be efficient, incentive policies must be tailored to the behaviour of potential clients: people who are more likely to change their behaviour and are less sensitive to changing prices. The government should create measures focused on this group in the early stages of changing their behaviour, and create specific incentives for them (Langbroek et al. 2016). We test the hypothesis: H1 – The incentives
policies motivate the EVs penetration into the automotive market. We expect that these
incentive policies motivate the penetration of EVs in the automotive market.
b) Socioeconomic factors
The Industrial Production Index (IPI) is one of the main economic indicators used by policymakers to make policy decisions and create new policies. As such, the LIPI variable is used as a proxy for economic activity (e.g. Marques et al., (2016 ) and Park and Ratti, (2008 )). This indicator is used by several institutions such as European Central Bank, financial markets, national governments and central banks. One of its strengths is that it allows a detailed measurement of industrial activities (Jaegers and Amil 2011). The effects of the variables (LIPI and LEMPLYMENT) were tested. Overall it is expected that better socioeconomic indicators such as income, employment rate or higher education level should allow easier access to the EVs and as such, positive effects on purchasing EVs are anticipated (Javid and Nejat 2017). Regarding the level of education, in general, people with a higher education level have greater concern about environmental problems. Bearing that on mind, the lowing hypothesis is defined: H2 - There is a positive effect of socioeconomic factors in
the widespread of EV. According to the literature the socioeconomic stimulate the consumers
to purchase a EV.
c) Environmental factors
The reduction of the pollutant gases emissions (CO, HC, NOx, PM and CO2) in the
transportation sector, is one of the main reasons for promoting the penetration of EVs (Manjunath and Gross 2017). EVs have zero tailpipe emissions and this contributes positively to achieving the targets established by the EU (Nanaki and Koroneos 2016). According to Nienhueser and Qiu, (2016), countries that have a large percentage of electricity generated from renewable energy, such as Norway and Spain, should be developing PHEVs or BEVs industries, not only to reduce GHG emissions, but also to reduce the need for oil. However, countries where the electrical power structures generate electricity from non-renewable source, such as coal, should develop HEVs industries, which are more appropriate for reducing electricity consumption and emissions. To control the role of pollutant LGHG gases, we test the hypothesis: H3 - The environmental awareness has impact on the adoption of EVs. We expect to verify a positive relationship between the environmental awareness and adoption of EVs.
11 d) Technical of EVs factors
The charging of EVs could have a significant impact on the power grid, as this could be used to make use of energy produced from renewable sources (Habib et al. 2015). The introduction of more EVs may require changes in the power grid, which may not be able to cope with the increased demand for electricity. Given this, we decide to study the effects of these variables (LCHARGING, LELECTRICITY, LPEAK and LRENEWABLE). To address this, it will become necessary to implement Demand Response (DR) programmes. Concisely, these consist of reducing electricity peaks and valleys (valley-filling), which then lead to reduced electricity costs. The interaction of EVs with renewable energy production is particularly suited for the implementation of these programmes (Nienhueser and Qiu 2016). DR programmes aim to control the demand for electricity, and lead to a reduction in the costs of an electrical systems (López et al. 2015). Specifically, they require optimisation of consumption so that grid operators can control peak loads, although they do require consumers to plan their consumption more carefully. Thus, it is fundamental to rethink the electrical system, especially with respect to the management of electrical demand. Demand Side Management (DSM) aims to implement capacity utilization measures through changes in the demand for electricity, to provide information, such as tariffs, for the consumers, and to promote devices that control consumption (Riesz et al. 2016). EVs are a tool of DSM and by charging these vehicles it is possible to reduce demand (high demand peaks are “clipped”) and thereby reduce loads at peak periods. This makes it possible to reduce dependence on fossil fuels, since EVs can be an instrument in reinforcing the use of renewable sources. As such, the following hypothesis is defined: H4: The technical factors have impact on EVs
purchase. We expect that the technical factors influence the purchase of EVs.
e) Transports factors
It is important to analyse the impact of alternative means of transport, since potential consumers of EVs may be susceptible to this factor, i.e. if a country has an advanced rail system and provides safe and cost-effective travel. This may influence the consumer not to buy an EVs, since the consumer has a safer and cheaper means of transportation (Helveston et al. 2015). We test the following hypothesis: H5 – The use of public transport demotivates
the electric mobility. We expect that an accessible public transport will have a negative
influence on increasing EVs use.
f) Crude oil price factor
EVs use could be a good indicator of progress on several targets related to environmental sustainability issues. The transport sector is the largest consumer of oil, so the electrification of vehicles would result in a decrease in the global demand for it and increase the crude oil price (LCRUDE) (Helveston et al. 2015). We pursue by testing the hypothesis: H6 – There is a
12
persistent effect in the consumption of fossil fuels. The sign of the effect we expect that be
a positive.
Fig 5: Expected relationships between the variables and factors to promote the penetration of EVs into the automotive market
On figure 1 it is possible to observe the expected relationship between the variables and the factors that influence the EVs purchase, according the literature. In next sections, we will prove if these results are confirmed.
Factors to promote the
penetration of EVs into the
13
4. Data and Methodology
This paper works upon a panel of 20 European countries namely: Austria, Belgium, Czech Republic, Denmark, Estonia, Finland, France, Hungary, Ireland, Italy, Luxembourg, Netherlands, Norway, Poland, Portugal, Slovakia, Slovenia Spain, Sweden and the United Kingdom. Annual data from 2010 to 2014 were used, making use of the entire available data for the number of BEVs and PHEVs. The data used is small, since these vehicles were only introduced into the automotive market in 2010, which is too short for empirical research based on time series. We choose to work with a panel data, given that it can offer some advantages, such as (i) increase the number of observations, therefore achieving a higher quality of estimations; and (ii) in panel data, the omitted variables reduce the risk of bias the results. Table, A1 (see Appendix) shows the source, description, and statistics of the variables.
To investigate the factors that contribute to increasing the share of EVs in the automotive market, we used three models for panel data (Table 2).
These countries have experienced dissimilar growth rates for EVs. As such, the Modified Wald test was performed to confirm the presence of group-wise heteroscedasticity, under null hypothesis: homoscedasticity (the constant variance of error). It was rejected, supporting the presence of heteroscedasticity. While the Wooldridge test was carried out, and was rejected the null hypothesis (model [I] and model [III]). Finally, the presence of cross-section dependence was tested by the Pesaran parametric test (Table 3).
Table 3 – Specification tests
Models
Tests I II III
Pooled RE FE Pooled RE FE Pooled RE FE
Modified Wald test 834.53*** 214.60*** 1312.33*** Wooldridge test F (N (0,1)) 4.894** 2.939 10.45*** Pesaran 6.41*** 4.38*** 6.23*** 4.16*** 8.57*** 5.18***
Note: ***, **, *, denote statistical significance level at 1%, 5% and 10%, respectively. FE means Fixed Effects and RE means Random Effects.
Table 2 – Description of Models
Description Dependent
variable
Model I Electric Vehicles (Battery Electric vehicles +Plug -in Hybrid Electric Vehicles) LEVS Model II Battery Electric Vehicles LBEVS
14 The functional form of the models was tested using the Ramsey RESET test (Regression Equation Specification Error Test). The rejection of the null hypothesis means that the model suffers of misspecification, which may cause inaccuracies on the coefficients estimation. The results show that all three models are well specified, the P-value is 0.2691, 0.5792 and 0.1981 for model 1,2 and 3, respectively. In order to verify the importance of the variables in the model [III], the Likelihood Radio test (LR) was computed, and confirm that the variables
LIPI (P-value was 0.1369); LGHGPC (P-value was 0.6801); LRENEWABLE (P-Value was 0.3855); POLICIES (P-value was 0.0.4477) and LEMPLOYMENT (P-value was 0.4632), should be excluded
from the model.
The Variance Inflation Factor (VIF) was calculated to assess the presence of multicollinearity, and the means were 2.73, 2.73, and 1.11 for the, model [I], model [II], and model [III] respectively, which revealed the nonexistence of multicollinearity. We proceed to the analysis econometric using the Stata 14.1.
15
5. Results and Discussion
5.1. Results
From the specification tests, the presence of heteroscedasticity and contemporaneous correlation were proved. To deal with these phenomena, the Panel Corrected Standard Errors (PCSE) or Feasible Generalized Least Squares (FGLS) estimators should be applied. Considering that, T < N, i.e. the panel is constituted by twenty countries (N) and five years (T), due this, the PCSE is the best estimator and conversely, the use of the FGLS is inappropriate ( e.g. Marques and Fuinhas, (2012)). A pooled OLS estimation was provide and PCSE estimator were carried out and compared with the following options: (i) with first-order autocorrelation AR (1) that was different for each country (Psar1); (ii) first-order autocorrelation but the same AR(1) coefficient for all countries (AR1); (iii) independent (Ind) unspecified autocorrelation, but correlation over countries; and lastly (iv) AR(1) common to all countries. The table 4 discloses the results for the model [I].
The model [I] is estimated through a combination of both vehicles types, (BEVs and PHEVs). On table 4 it is possible to observe that the variables LIPI, LEMPLOYMENT and LCRUDE have a large and positive effects on the penetration of BEVS in the automotive market.
Table 4 - Results for Model [I], Electric Vehicle, jointly BEVs and PHEVs
Independent variables OLS PCSE
Pcse Psar1 Ar1 Ind
LIPI 4.8210*** 4.8210** 4.5368** 5.0066** 4.8210** LCHARGINGPC 0.2987*** 0.2987*** 0.2784*** 0.2892*** 0.2987*** LRAILPC -1.0016*** -1.0016*** -1.2801*** -1.0182*** -1.0016*** LRENEWABLE 0.3697** 0.3697*** 0.4401*** 0.3924*** 0.3697*** LEMPLOYMENT 5.5802*** 5.5802*** 6.4695*** 5.7786*** 5.5802*** LGHGPC 1.0031*** 1.0031*** 0.8112*** 1.0084*** 1.0031*** LELECTRICITY -1.0342** -1.0342*** -1.1800*** -1.0269*** -1.0342*** LCRUDE 5.8038*** 5.8038*** 5.6296*** 5.8194*** 5.8038*** LPEAK 0.7470*** 0.7470*** 0.5411*** 0.7419*** 0.7470*** POLICIES 0.0570*** 0.0570*** 0.0721*** 0.0547*** 0.0570*** CONS -88.3182*** -88.3182*** -89.9848*** -90.6990*** -88.3182** N 100 100 100 100 100 R2 0.8614 0.8614 0.9375 0.8233 0.8614 Adjusted R2 0.8458 - - - - F (N (0,1)) 55.32*** - - - - Wald Test - 4655.73*** 4435.47*** 3061.38*** 4655.73***
Notes: OLS – Ordinary Least Squares; PCSE – Panel Corrected Standard Errors; F-test is normally distributed N (0,1),
where the null hypothesis is of non-significance of the estimate parameters. The Wald test has 𝜒2 distribution, where
the null hypothesis is the non- significance of all coefficients’ explanatory variables. The Stata command xtpcse was used that calculates PCSE that estimate for linear series cross-section models, the parameters were estimated by OLS regression. The command xtpcse was used specifically for models that are both contemporaneously correlated cross panel, with or without autocorrelation. ***, **, *, denote statistical significance at 1%, 5% and 10% levels, respectively.
16 The Hausman test helps to determine which estimator is more suitable. This could be the Fixed Effects (FE) estimator or the Random Effects (RE) estimator, where the null hypothesis is that the preferred model is RE. The null hypothesis was confirmed, which meant that the RE estimator was more appropriate and efficient than the FE estimator. The RE estimator can deal with the presence of heteroskedasticity. The table 5 discloses the result with RE.
Table 5 – Model [I] – Electric Vehicles with Random Effects
Independent variables RE RE rob LIPI 1.8739 1.8739 LCHARGINGPC 0.2587*** 0.2587*** LRAILPC -1.2918*** -1.2918*** LRENEWABLE 0.7595*** 0.7595*** LEMPLOYMENT 7.3557*** 7.3557*** LELECTRICITY -1.7261*** -1.7261*** LCRUDE 6.1930*** 6.1930*** POLICIES 0.0656** 0.0656* CONS -82.7975*** -82.7975*** N 100 100 Hausman test 15.72** Wald Test 327.02*** 629.42***
Notes: RE – Random Effect; RE Rob – Random Effect Robust; The Wald test has 𝜒2 distribution, where the null
hypothesis is the non-significance of all coefficients’ explanatory variables. Note: ***, **, *, denote statistical significance at 1%, 5% and 10% levels, respectively.
When comparing the table 4 with the table 5 we observe the inefficiency in coefficients estimation on table 5, concluding that the RE estimator is not well suited to deal with the phenomena of the contemporaneous correlation and serial correlation. However, the variance of the PCSE estimator is smaller than the RE estimator, and we prove that this estimator is inefficient.
In Table 6 it is shown that all the variables are statistically significant, proving that this model is robust. In this model, some similarities with model [I] were observed, which reinforce the findings that the socioeconomic factors stimulate positively the purchase of BEVs.
The table 7 reveals that the variable LCRUDE is not statistically significant with PCSE, Psar1, Ar1 or Ind estimators. We decided to remove the variables (LIPI, LEMPLOYMENT, LGHG,
LRENEWABLE and POLICIES), because these variables do not affect the adoption of EVs, being
17 In sum, the model [I] was computed to understand, which one of the factors promote EVs, while the model [II] and the model [III] were carried out to comprehend the differences between the BEVs and PHEVs, i.e. if the factors that influence the purchase of BEVs, also promote the purchase of PHEVs. In all three models only the variables (LELECTRICITY and
LRAILWAY) have a negative effect in penetration of EVs into the automotive market.
Table 6- Results for Model [II] BEVs
Independent variables OLS PCSE
Pcse Psar1 AR1 Ind
LIPI 7.1558*** 7.1558*** 6.6658*** 7.1450*** 7.1558*** LCHARGINGPC 0.2766*** 0.2766*** 0.2393*** 0.2554*** 0.2766*** LRAILPC -1.0014*** -1.0014*** -1.2133*** -1.0217*** -1.0014*** LRENEWABLE 0.4811*** 0.4811*** 0.4093*** 0.5069*** 0.4811*** LEMPLOYMENT 4.1873*** 4.1873*** 4.9708*** 4.6456*** 4.1873*** LGHGPC 1.2197*** 1.2197*** 1.1597*** 1.2175*** 1.2197*** LELECTRICITY -0.8833** -0.8833*** -0.7883*** -0.8980** -0.8833*** LCRUDE 5.0482*** 5.0482*** 5.1744*** 5.2878*** 5.0482*** LPEAK 0.6540*** 0.6540*** 0.6530*** 0.6535*** 0.6540*** POLICIES 0.0654*** 0.0654*** 0.0724*** 0.0592*** 0.0654*** CONS -89.9536*** -89.9536*** -92.5464*** -93.8597*** -89.9536** N 100 100 100 100 100 R2 0.8569 0.8569 0.9216 0.7880 0.8569 Adjusted R2 0.8409 F (N (0,1)) 53.31*** Wald Test 4813.02*** 2620.96*** 2634.82*** 4813.02***
Notes: OLS – Ordinary Least Squares; PCSE – Panel Corrected Standard Errors; F-test is normally distributed N (0,1), where the null hypothesis is the non-significance of all the estimate parameters. The Wald test has 𝜒2 distribution, where the null hypothesis is the non-significance of all coefficients’ explanatory variables. The Stata command
xtpcse was used to calculate PCSE that estimate for linear series cross-section models. The parameters were
estimated by OLS regression. The command xtpcse was used specifically for models that are contemporaneously correlated across-the panel, with or without autocorrelation. ***, **, *, denote statistical significance at 1%, 5% and 10% levels, respectively.
Table 7- Results for Model [III] PHEVs
Independent variables OLS PCSE
Pcse Psar1 AR1 Ind
LCHARGINGPC 0.5125*** 0.5125*** 0.5279*** 0.5198*** 0.5125*** LRAILPC -0.5712 -0.5712*** -0.6917*** -0.5605*** -0.5712*** LELECTRICITY -1.5808** -1.5808*** -1.7510** -1.3705* -1.5808*** LCRUDE 3.8193** 3.8193 2.2798 2.5533 3.8193 LPEAK 0.8631*** 0.8631*** 0.8385*** 0.8595*** 0.8631*** CONS -28.3814*** -28.3814* -20.8631* -22.8377 -28.3814* N 100 100 100 100 100 R2 0.5818 0.5818 0.6246 0.4679 0.5818 Adjusted R2 0.5596 - - - - F (N (0,1)) 21.96*** - - - - Wald Test (𝜒2) - 37.75*** 62.88*** 32.34*** 37.75***
Notes: OLS – Ordinary Least Squares; PCSE – Panel Corrected Standard Errors; F-test is normally distributed N (0,1), where the null hypothesis is of non-significance of all the estimate parameters. The Wald test has 𝜒2 distribution, where the null hypothesis is non-significance of all coefficients explanatory variables. The Stata command xtpcse was used to calculate PCSE that estimate for linear series cross-section models. The parameters were estimated by OLS regression. The command xtpcse was used specifically for models that are both contemporaneously correlated across the panel, with or without autocorrelation. ***, **, *, denote statistical significance at 1%, 5% and 10% levels, respectively.
18 Socioeconomic variables (LIPI and LEMPLOYMENT) only have a positive effect in model [I] and model [II]. In model [III] this factor does not have influence in the purchase of PHEVs. The variable POLICIES in model [III] do not encourage the adoption of EVs.
5.2. Discussion
In this section, the effects observed for all factors described in the previous section will be discussed. The findings provide that incentive policies are an important factor in promoting vehicle electrification, allowing the cost difference between purchasing an electric or conventional vehicle to be reduced. Thereby, there is evidence to support the hypothesis
H1 only for the BEVs. The variable POLICIES is not statistically significant for PHEVs, and for
this reason, specific policies must be created to increase the purchase of this type of vehicle, since their range allows long journeys without recharging, as it has an alternative gasoline or diesel engine. The policymakers should continue to focus on incentive policies aimed at increasing the percentage of EVs in the automotive market.
The results prove that the socioeconomic variables have large and positive effects to influence the purchase of the BEVs, given this there is evidence to support the H2 only for BEVs. Economic theory, supports that an increase in economic growth rates leads to an improvement in several indicators, such as an increase of the employment rate, followed by an increase of income. These will be reflected in an increase of consumption.
To achieve the environmental goals established by the EU, the introduction of electric mobility will be a crucial factor to refrain global warming, climate changes and to improve air quality. The results suggest that GHG encourage the purchase of BEVs, but do not have effects in the purchase of PHEVs. The hypothesis H3 is verified only for BEVs. It is worthwhile to note that this research is focused on historical data, until the year 2014. Moreover, in most of European countries PHEVs were introduced in the automotive market in 2012. This is the main reason why, the number of PHEVs is reduced.
The electric mobility has a major impact on the power grid, given that a large number of EVs will significantly increase the global demand for electricity. Since it is necessary to satisfy the peak demand for electricity, and electricity production cannot be adjusted to coincide with peak and off-peak periods, an increased demand for electricity will significantly increase production costs, which will be reflected in higher electricity prices. Charging EVs during the night allows the surplus of electricity generated by renewable sources to be drained, consequently allowing to reduce the costs of production. The technology V2G allows to reduce the costs of electricity, being the batteries of the vehicles a way to store electricity, being able to be used in the peak hour, when the demand is high, thus allowing the Transmission System Operator to guarantee the balance in the electric system.
The enlargement of the electric mobility share allows to increase the electricity production from endogenous renewable energy, such as, solar energy, that allows to charge
19 the vehicle not using the electricity generated from the power grid. The results prove that the countries with a large installed renewable capacity indicate that their citizens are concerned about environmental issues, and this is an important factor when it comes to encouraging citizens to opt for an EV. As examples Norway, France, and the United Kingdom, which are the countries with the largest number of EVs registered, have a high percentage of installed renewable sources.
The results support that, the technical factors such as, the number of charging infrastructure, the peak load and the electricity production from the renewable energy stimuli the purchase of BEVs, only the number of charging infrastructures and the peak load influence positively the PHEVs purchase and the electricity price demotivate the BEVs and PHEVs purchase. Due to this, there is evidence to support the H4 for the BEVs and PHEVs. To satisfy higher demand levels, it may be necessary to use non-renewable sources or nuclear power plant. However, when calling upon this type of energy sources, it involves high production costs that the consumers will be paying through electric bills. To control the electricity demand, it is necessary to create policies and measures that influence the consumers to charge their vehicle in off-peak, when the electricity production is generated from renewable resources.
Results corroborates that factors such as public transport restrict the adoption of BEVs and PHEVs. Therefore, the hypothesis H5 is verified for both the BEVs and PHEVs. Under a good public transport system, which is safer and cheaper, the substitution effect can occur, in which consumers might prefer to use public transport, and consequently will not choose to buy an EV.
The persistency of consumers to use a vehicle powered by thermal engines is a hurdle, but in all models, it is possible to observe a positive effect between the crude oil price and EVs. This effect can be explained by the fact that the number of EVs in circulation is very low compared to conventional vehicles. Given this, the H6 is not supported for BEVs and PHEVs. However, this study analyses only a five-year panel (2010 to 2014), and it is not possible to observe the volatility of oil prices over such a short period, thus skewing the study’s results. The results suggest that Supported by the increase in the demand for green vehicles, oil prices will increase and the demand for fossil fuels will reduce significantly, that is reflected in a decline in the polluting gas emissions (Richardson 2013).
In summary, the results suggest that the socioeconomic variables are the most important factor to influence the purchase of BEVs. In all three models, the results demonstrate that the electricity price and an alternative transport restrict the purchase of BEVs and PHEVs.
20
6. Conclusion and policy implications
This paper analyses factors for the adoption of EVs for a set of twenty European countries, for the time span of 2010 to 2014. The PCSE estimator was proved to be appropriate, given the presence of contemporaneous correlation across the countries.
The results prove that the charging infrastructure is a decisive factor for the adoption of EVs over the analysed period. It is necessary to introduce charging facilities in places where people park their vehicles for long periods of time, such as workplaces, universities, train stations, given the fact that charging the vehicles takes about eight hours, on average, depending on the vehicle’s specifications. Long-distance travel requires fast-charging infrastructures that must be located at service stations as it takes about 30 minutes to recharge the battery. In order to expand the coverage area with charging infrastructure, the policymakers should establish public-private partnerships in order to guarantee their maintenance. In large cities, access to privilege roads, free parking and access to motorways will positively influence the behaviour of companies and individuals to adopt EVs, as it allows these consumers to escape the congestion of large cities and have no restrictions on the place you want to park the vehicle.
The most expensive components of EVs are their batteries. However, it is probable that, in the near future, new technology will evolve, and their price might decrease significantly (Plötz et al. 2014). The cost of a battery depends on its size, which is a factor that limits the efficiency of EVs. Reducing the cost of batteries is a key to the development of this technology, as is the recycling of lithium, platinum and other materials needed for their construction (Offer et al. 2010). Therefore, if the cost of producing and re-charging batteries can be brought below that of using fossil fuels, it will encourage the change to EVs, providing the long-term cost of this change is less than the continued use of conventional vehicles (Habib et al. 2015).
With large-scale use of EVs, the timing of charging these vehicles should be managed by cycles (Langbroek et al. 2017), i.e., to reduce the possible failures of the electrical system, we should organise the charging of EVs according to the electricity consumption, thereby is required to accommodate Time-of-Use (TOU) pricing, that has become a common practice in some households, which consists of price structures that are taxed for different levels, depending on the electricity consumption (Ramos Muñoz et al. 2016). In order to enhance battery performance and cycle life the EVs should use the regenerative braking system, that allows to reduce the intervention when the vehicles is activated (Itani et al. 2017). The electric motor uses the regenerative braking as a generator, i.e., during the braking energy is produced, which is used to recharge the batteries.
The price of electricity and the provision of public transport restrict the purchase of BEVs and PHEVs in the analysed period. A safe public transport network accessible to all citizens is more likely to be used by them, which reduces the need to own a vehicle. EVs have a major impact on the power grid, which will cause an increase in the cost of producing electricity.
21 Increased electricity prices will make consumers reconsider the benefits of purchasing EVs. To reduce production costs, vehicle charging should occur during the off-peak-off period, which will maximize the use of renewable sources. Due to this the policymakers should establish tariffs that allow control the demand of electricity, i.e., transfer the electricity demand from the peak periods to the peak-off.
The consumers, when choosing the purchase of an EV, have direct returns, since the price per kilometre of these vehicles is considerably lower than vehicles fed by diesel or gasoline. The cost of maintenance is less than those of conventional vehicles.
The major problem of electric mobility is the paradigm of autonomy, since consumers are accustomed to an autonomy of 600km with conventional vehicles. On average, daily consumers drive between 50 km to 80 km, distance between their household and workplace, in which an EV allows to carry out this distance without the charging of the vehicle. To the evolution of this technology, the autonomy of these vehicles can reach 300 km. In the future, the electrification of vehicles will create a wide variety of vehicles and it will increase the sales: private vehicles, in public transportation, in the rental car and in the car sharing system, in which it will result in a resolution of the automobile industry.
22
References
Alexander, D., & Gartner, J. (2012). Electric Vehicles in Europe. Amsterdam Roundtables
Foundation and McKinsey & Company. doi:10.2800/100230
Brenna, M., Foiadelli, F., Roscia, M., Zaninelli, D., & Member, S. (2012). Synergy between Renewable Sources and Electric Vehicles for Energy Integration in Distribution Systems, 865–869.
Cahill, E., Davies-Shawhyde, J., & Turrentine, T. S. (2014). New Car Dealers and Retail Innovation in California’s Plug-In Electric Vehicle Market, (October), 22. http://pubs.its.ucdavis.edu/download_pdf.php?id=2353
European Commission. (2014). Clean fuels for transport: Member States now obliged to ensure minimum coverage of refuelling points for EU-wide mobility, (September 2014). http://europa.eu/rapid/press-release_IP-14-1053_en.htm
Europen Commission. (2014). DIRECTIVE OF THE EUROPEAN PARLIAMENT AND OF THE COUNCIL on the deployment of alternative fuels infrastructure. Official Journal of the European
Union, 12(April), 1–38.
Habib, S., Kamran, M., & Rashid, U. (2015). Impact analysis of vehicle-to-grid technology and charging strategies of electric vehicles on distribution networks - A review. Journal of
Power Sources, 277, 205–214. doi:10.1016/j.jpowsour.2014.12.020
Helveston, J. P., Liu, Y., Feit, E. M., Fuchs, E., Klampfl, E., & Michalek, J. J. (2015). Will subsidies drive electric vehicle adoption? Measuring consumer preferences in the U.S. and China. Transportation Research Part A: Policy and Practice, 73, 96–112. doi:10.1016/j.tra.2015.01.002
Itani, K., De Bernardinis, A., Khatir, Z., & Jammal, A. (2017). Comparative analysis of two hybrid energy storage systems used in a two front wheel driven electric vehicle during extreme start-up and regenerative braking operations. Energy Conversion and
Management, 144, 69–87. doi:10.1016/j.enconman.2017.04.036
Jaegers, T., & Amil, D. (2011). Industrial output in the EU and euro area An analysis of the industrial production index. Official Journal of the European Union.
Javid, R. J., & Nejat, A. (2017). A comprehensive model of regional electric vehicle adoption and penetration. Transport Policy, 54(November 2016), 30–42. doi:10.1016/j.tranpol.2016.11.003
23 Langbroek, J. H. M., Franklin, J. P., & Susilo, Y. O. (2016). The effect of policy incentives on
electric vehicle adoption. Energy Policy, 94, 94–103. doi:10.1016/j.enpol.2016.03.050
Langbroek, J. H. M., Franklin, J. P., & Susilo, Y. O. (2017). When do you charge your electric vehicle? A stated adaptation approach. Energy Policy, 108(May), 565–573. doi:10.1016/j.enpol.2017.06.023
López, M. A., Torre, S. De, Martín, S., & Aguado, J. A. (2015). Electrical Power and Energy Systems Demand-side management in smart grid operation considering electric vehicles load shifting and vehicle-to-grid support. International Journal of Electrical Power and
Energy Systems, 64, 689–698. doi:10.1016/j.ijepes.2014.07.065
Lutsey, N. (2015). Transition to a global zero-emission vehicle fleet: A collaborative agenda for governments, (September). www.theicct.org
Manjunath, A., & Gross, G. (2017). Towards a meaningful metric for the quanti fi cation of GHG emissions of electric vehicles ( EVs ). Energy Policy, 102(December 2016), 423–429. doi:10.1016/j.enpol.2016.12.003
Marques, A. C., & Fuinhas, J. A. (2012). Is renewable energy effective in promoting growth?
Energy Policy, 46, 434–442. doi:10.1016/j.enpol.2012.04.006
Marques, A. C., Fuinhas, J. A., & Menegaki, A. N. (2016). Renewable vs non-renewable electricity and the industrial production nexus: Evidence from an ARDL bounds test approach for Greece. Renewable Energy, 96, 645–655. doi:10.1016/j.renene.2016.05.033
Matthews, L., Lynes, J., Riemer, M., Del Matto, T., & Cloet, N. (2017). Do we have a car for you? Encouraging the uptake of electric vehicles at point of sale. Energy Policy,
100(September 2016), 79–88. doi:10.1016/j.enpol.2016.10.001
Mock, P. and Y. Z. (2014). Driving Electrification. ICCT - The International Council on Clean
Transportation, (May).
Nanaki, E. A., & Koroneos, C. J. (2016). Climate change mitigation and deployment of electric vehicles in urban areas. Renewable Energy, 99, 1153–1160. doi:10.1016/j.renene.2016.08.006
Nienhueser, I. A., & Qiu, Y. (2016). Economic and environmental impacts of providing renewable energy for electric vehicle charging – A choice experiment study. Applied
24 Offer, G. J., Howey, D., Contestabile, M., Clague, R., & Brandon, N. P. (2010). Comparative analysis of battery electric, hydrogen fuel cell and hybrid vehicles in a future sustainable road transport system. Energy Policy, 38(1), 24–29. doi:10.1016/j.enpol.2009.08.040
Park, J., & Ratti, R. A. (2008). Oil price shocks and stock markets in the U.S. and 13 European countries. Energy Economics, 30(5), 2587–2608. doi:10.1016/j.eneco.2008.04.003
Plötz, P., Schneider, U., Globisch, J., & Dütschke, E. (2014). Who will buy electric vehicles? Identifying early adopters in Germany. Transportation Research Part A: Policy and
Practice, 67, 96–109. doi:10.1016/j.tra.2014.06.006
Ramos Muñoz, E., Razeghi, G., Zhang, L., & Jabbari, F. (2016). Electric vehicle charging algorithms for coordination of the grid and distribution transformer levels. Energy, 113, 930–942. doi:10.1016/j.energy.2016.07.122
Richardson, D. B. (2013). Electric vehicles and the electric grid: A review of modeling approaches, Impacts, and renewable energy integration. Renewable and Sustainable
Energy Reviews, 19, 247–254. doi:10.1016/j.rser.2012.11.042
Riesz, J., Sotiriadis, C., Ambach, D., & Donovan, S. (2016). Quantifying the costs of a rapid transition to electric vehicles. Applied Energy, 180, 287–300. doi:10.1016/j.apenergy.2016.07.131
25
Appendix
Variable Definition Source Mean SD Min Max
LBEVS Logarithm of number of Battery
Electric Vehicles EAFO 4.9 2.27 0 9.8
LPHEVS Logarithm of number of Plug -in
Hybrid Electric Vehicles EAFO 2.9 2.8 0 9.9
LEVS Logarithm of number of Electric Vehicles (Battery Electric vehicles +
Plug -in Hybrid Electric Vehicles) EAFO
5.2 2.4 0 10.0
LIPI Logarithm of Index of Production in
Industry (2010 base year) EUROSAT 4.6 0.8 4.5 4.9
LCHARGINGPC Logarithm of number of
charging infrastructures per capita EAFO -12.4 3.4 -18.0 -6.9
LRAILPC Logarithm of length of railway per
capita WDI -7.6 0.5 -8.6 -6.8
LRENEWABLE Logarithm of electricity generated
from renewable energy (GWh) IRENA 23.6 1.4 20.8 25.7
LEMPLOYMENT
Logarithm of Employment rate (%) OCDE 4.2 0.1 4.0 4.3 LGHGPC Logarithm of Greenhouse Gas
per capita (kt CO2 equivalent) UNFCCC -6.2 0.5 -7.0 -4.3
LELECTRICITY Logarithm of electricity price (KWh,
in euro cents) Statista 2.8 0.3 2.1 3.4
LCRUDE Logarithm of crude oil price –
Brent (dollars per barrel) FRED 4.6 0.1 4.4 4.8
POLICIES Accumulated number of Electric
Vehicles Policies and Measures IEA 4.6 5.8 0 28
LPEAK
Logarithm of peak load (GWh) IEA 23.2 1.2 20.8 25.3 Notes: EAFO, European Alternative Fuels Observatory WDI, World Bank- World Development Indicators; OCDE, OCDE Statistics; UNFCCC, United Nations Framework Convention on climate change; IRENA, International Renewable Energy Agency; FRED, Federal Reserve Economic Data; IEA, International Energy Agency. The number of observations is 100 for all variables.


![Table 4 - Results for Model [I], Electric Vehicle, jointly BEVs and PHEVs](https://thumb-eu.123doks.com/thumbv2/123dok_br/18195174.875677/24.892.153.788.534.884/table-results-model-electric-vehicle-jointly-bevs-phevs.webp)
![Table 5 – Model [I] – Electric Vehicles with Random Effects Independent variables RE RE rob LIPI 1.8739 1.8739 LCHARGINGPC 0.2587*** 0.2587*** LRAILPC -1.2918*** -1.2918*** LRENEWABLE 0.7595*** 0.7595*** LEMPLOYMENT 7.3557*** 7.3557*** L](https://thumb-eu.123doks.com/thumbv2/123dok_br/18195174.875677/25.892.149.786.300.565/electric-vehicles-effects-independent-variables-lchargingpc-lrenewable-lemployment.webp)
![Table 6- Results for Model [II] BEVs](https://thumb-eu.123doks.com/thumbv2/123dok_br/18195174.875677/26.892.148.789.91.440/table-results-for-model-ii-bevs.webp)
