BJRS
RADIATION SCIENCES
05-01 (2017) 01-13Shielding evaluation of neutron generator hall by Monte
Carlo simulations
U. Pujala
1, L. Thilagam
2*, T. S. Selvakumaran
1, R. Baskaran
1, D. K. Mohapatra
2, B.
Venkatraman
11Radiological Safety Division, Indira Gandhi Center for Atomic Research, Kalpakkam 603 102, India 2Safety Research Institute, Atomic Energy Regulatory Board, Kalpakkam 603 102, India
ABSTRACT
A shielded hall was constructed for accommodating a D-D, D-T or D-Be based pulsed neutron generator (NG) with 4π yield of 109 n/s. The neutron shield design of the facility was optimized using NCRP-51 methodology such that the total
dose rates outside the hall areas are well below the regulatory limit for full occupancy criterion (1 µSv/h). However, the total dose rates at roof top, cooling room trench exit and labyrinth exit were found to be above this limit for the opti-mized design. Hence, additional neutron shielding arrangements were proposed for cooling room trench and labyrinth exits. The roof top was made inaccessible. The present study is an attempt to evaluate the neutron and associated cap -ture gamma transport through the bulk shields for the complete geometry and materials of the NG-Hall using Monte Carlo (MC) codes MCNP and FLUKA. The neutron source terms of D-D, D-T and D-Be reactions are considered in the simulations. The effect of additional shielding proposed has been demonstrated through the simulations carried out with the consideration of the additional shielding for D-Be neutron source term. The results MC simulations using two dif-ferent codes are found to be consistent with each other for neutron dose rate estimates. However, deviation up to 28% is noted between these two codes at few locations for capture gamma dose rate estimates. Overall, the dose rates estimated by MC simulations including additional shields shows that all the locations surrounding the hall satisfy the full occu -pancy criteria for all three types of sources. Additionally, the dose rates due to direct transmission of primary neutrons estimated by FLUKA are compared with the values calculated using the formula given in NCRP-51 which shows devia-tions up to 50% with each other. The details of MC simuladevia-tions and NCRP-51 methodology for the estimation of pri-mary neutron dose rate along with the results are presented in this paper.
1. INTRODUCTION
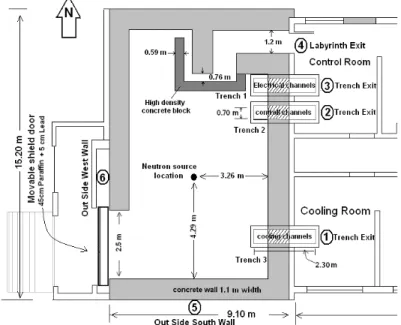
Pulsed neutron generator is the main component of the active neutron assay system of nuclear waste bearing fissile materials. In this respect, for standardizing active neutron interrogation technique, a Plasma Focus (PF) based NG using 2H(d, n)3He reaction is under development in collaboration with Bhabha Atomic Research Centre (BARC). In parallel, design and development of RFQ linear accel-erator (LINAC) based NG using 9Be(d, n)10B reaction; and DC accelerator based NG using 3H(d, n)4He reaction are also in progress. In order to house the NG based on any of the above three reac-tions with the design yield of ~109 n/s/4π, a LINAC facility [1] consisting of a shielded NG-hall was built based on NCRP-51 [2] recommendations. The vertical and horizontal cross-sectional views of the NG-Hall layout with dimensions are shown in Figure 1 and 2 respectively.
The NG hall has overall dimensions of 9.1 m width, 15.2 m breath and 8.3 m height. The shield walls around the hall are made up of ordinary concrete of 1.1 m thick up to a height of 5.5 m. The remaining height up to the roof is constructed as two parallel regular brick walls on the top of the shield wall. The roof covering the hall is made of ordinary concrete of thickness 0.27 m. A labyrinth made of high density concrete blocks is constructed inside the hall to reduce the radiation dose streaming to the control room through the hall entrance. For control and electric cables pas-sage, two trenches are provided between the hall and the control room; and one trench between the hall and cooling room for passage of cooling channels as shown in Figure 2. Further, a movable shield door (2.5 m length) is eructed on the west side of hall to cover the entrance for materials transport. It is made as a mild steel box arrangement filled with 0.45 m paraffin followed by 0.05 m lead and placed on a movable trolley. It provides the equivalent shielding thickness of 1.1 m con-crete. The dimensions of the concrete shielded walls, labyrinth arrangements, movable shield door and trenches were optimized and designed as per the NCRP-51recommendations. The multi-colli-sion dose-equivalent index transmismulti-colli-sion curve of concrete for neutrons produced by D-T reaction with D+ ion energy 1.6 MeV as provided in NCRP-51 [2] was used for optimizing the concrete wall thickness.
The thickness of ordinary concrete wall was optimized to 1.1m for reducing the total dose rate due to primary neutrons, reflected neutrons and the associated capture gamma outside the NG-Hall well below the limit of 1 µSv/h recommended by Atomic Energy Regulatory Board (AERB), India for
full occupancy area. However, for the optimized design, the estimated total dose rates by NCRP-51 was found to be > 1 μSv/h at the exit of cooling room trench and labyrinth; and the roof top total dose was estimated to be around 200 μSv/h. Hence, additional neutron shielding for covering the trench exit with paraffin block (made of 0.2 m paraffin covered with 0.002 m thick iron) and clos-ing the labyrinth entrance with shield door (made of 0.05 m HDPE covered with 0.002 m iron) as proposed. Also, fencing was provided on the roof top to make it inaccessible for personnel.
Figure 1: Layout of Neutron Generator facility (horizontal cross-sectional view)
Although the radiation shielding of particle accelerator facilities can be designed or evaluated based on the NCRP-51 guidelines, Monte Carlo (MC) simulations are the most accurate methods for eval-uating the structures that involve bulk composite shielding, and complicated geometries. In this re-gard, the present study is an effort to evaluate the shielding adequacy of NG hall using two different MC simulations, FLUKA [3, 4] and MCNP [5]. Realistic modeling and simulation of the NG hall is performed using both the codes to estimate the individual neutron and capture gamma dose rates and hence the total dose rates at various locations outside the NG hall as indicated in Figure 1 and above the roof top. In the following sections, the methodologies used in MC simulations, calcula-tion of primary neutron dose rate using the formula given in NCRP-51 and the results of the present studies are discussed.
2. MATERIALS AND METHODS
The present study employs MC codes FLUKA and MCNP to simulate the coupled neutron-photon interaction and transport in a geometry involving bulk shield materials. FLUKA is a fully integrated particle physics MC simulation package whereas MCNP is a general-purpose MC radiation trans-port code. Both the codes are capable of simulating hadronic and electromagnetic cascades in detail. They are widely used in high energy physics, medical physics, health physics and dosimetry etc. An important difference between them is their treatments for low-energy neutrons. Transport of low-en-ergy neutrons is performed in FLUKA by a using multi-group framework whereas they are explic-itly simulated based on continuous-energy cross-sections in MCNP. The complete LINAC hall has been modeled with the exact dimensions using both the codes by adopting the respective coding procedures.
The simulations are carried out independently for the following neutron spectra corresponding to the three NGs of yield 109 n/s/4π each.
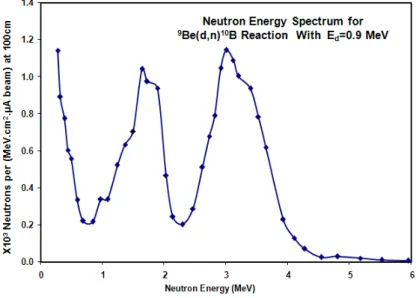
i. The forward (00) spectra of neutrons produced from 9Be(d, n)10B reaction corresponding to D+ ion energy of 0.9 MeV [6] is considered for D-Be reaction and is shown in Figure 3. The angular flux density distribution and average energy of neutrons produced from this reaction varies with projectile energy. The average energy of the selected spectrum is 2.2 MeV. ii. Mono-energetic neutrons of energy 2.45 MeV are considered for D-D reaction.
iii. Mono-energetic neutrons of energy 14.1 MeV are considered for D-T reaction.
Figure 3: Neutron spectrum of 9Be (d, n) 10B reaction in the forward direction
2.1 FLUKA SIMULATIONS
FLUKA version 2011.2c has been used in the present study. In the present FLUKA simulations, the mono-energetic neutrons of D-D and D-T reactions are sampled directly. The spectra of D-Be neu-trons are sampled by user defined source routine. The source is assumed to be a point isotropic in all cases. In order to score neutron and photon fluence at the desired detector locations, ‘USR-TRACK’ card is used as it does the track-length estimate of the particle fluence of interest in the re-gion integrated over the whole energy range. To score neutron fluence distribution inside and around the facility, ‘USRBIN’ card is used. For folding the neutron/photon fluence with "AMB74" conversion coefficients to estimate ambient dose equivalent in the desired detector locations of in-terest, ‘USRBIN’ and ‘USRTRACK’ cards along with AUXSCORE card are used. AMB74 conver-sion factors are as per ICRP 74 publication [7]. Each simulation is employed with 109 neutron histo-ries with five cycles spawn to reduce statistical uncertainty less than 10%. The ‘importance biasing’ is used as variance reduction technique to handle the deep penetration through 1.1 m thick concrete wall. The mean free path or biasing thickness of 0.1 m is arrived for the average neutron energy 2.2 MeV of D-Be reaction. Consideration of the same value is reasonably good even for 2.45 MeV and
14.1 MeV neutrons [8] of D-D and D-T reactions respectively and hence the same has been used in the simulations.
2.2 MCNP SIMULATIONS
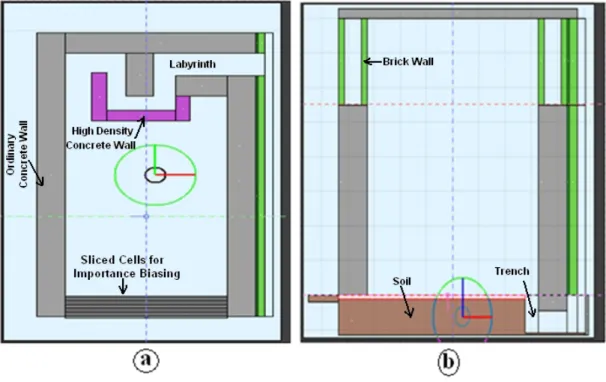
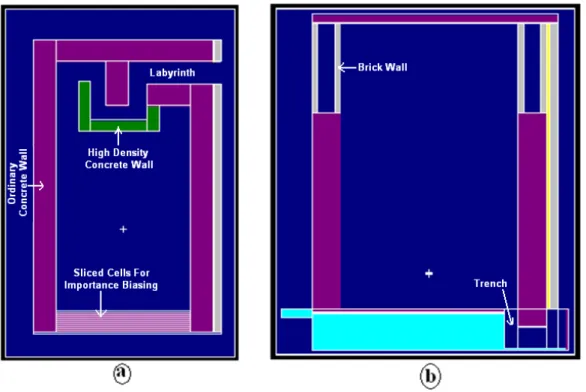
In order to perform coupled neutron-photon transport, ‘MODE N P’ option is used in MCNP simulations with the built-in ENDF/B-VI data. Neutron and photon fluence are evaluated in the desired detector locations of interest using track length estimators (F4 tallies). Each MCNP simulation is performed for 108 neutron histories to reduce the statistical uncertainties < 10% for all F4 tallies. The ‘importance biasing’ is used as variance reduction technique. Same importance factors used in FLUKA are used in the MCNP simulations also. To convert neutron fluence to dose rates, ICRP-74 flux to dose conversion factors are employed whereas for photons ANSI/ANS-6.1.1-1977 flux to dose conversion factors are used. Horizontal and vertical cross-sectional views of NG hall simulated in FLUKA and MCNP are shown in Figure 4 and 5 respectively.
Figure 4: FLUKA modeling of NG hall (a) Horizontal (Z=1.0 m plane) and (b) Vertical
Figure 5: MCNP modeling of NG hall (a) horizontal (Z=1.0 m plane) and b) vertical (Y=-1.82 m
plane) cross-sectional views
While estimating the dose rate at the location 5, the ‘Importance biasing’ method has been implemented in FLUKA and MCNP only for the south wall which lies between the source and the detector location 5. The remaining walls are simulated as single cells without biasing to take care of the reflected neutrons from the other walls effectively without tracking the total thickness of the walls. Similarly, for evaluating the dose rates at the locations 1, 2, 3 and 4, the ‘importance biasing’ is applied only for the east wall. The same methodology has been employed for the west wall while evaluating the dose rates at the location 6.
3. RESULTS AND DISCUSSION
The neutron and capture gamma dose rates are evaluated in all detector locations of interest using FLUKA and MCNP by simulating the full NG hall initially without considering the additional shields over the cooling room trench and labyrinth. The results of simulations are presented in Tables 1, 2 and 3 for the D-Be, D-D and D-T neutron sources respectively. The deviations observed in dose rates evaluated by two codes are compared in terms of the ratio of DFLUKA/ DMCNP.
Table 1: Evaluated dose rates in various locations surrounding the hall using FLUKA and MCNP
for D-Be neutrons
Detector Location
MCNP Dose rates (µSv/h) FLUKA Dose rates (µSv/h) DFLUKA/DMCNP
Neutron Capture Gamma
Total Neutron Capture
Gamma
Total Neutron Total
1 1.622 0.068 1.690 1.56 0.05 1.61 0.96 0.95 2 0.608 0.033 0.641 0.63 0.02 0.66 1.05 1.03 3 0.436 0.024 0.460 0.47 0.02 0.49 1.08 1.06 4 1.710 0.127 1.838 1.82 0.09 1.91 1.06 1.04 5 0.134 0.047 0.177 0.15 0.01 0.16 1.12 0.90 6 0.184 0.07 0.254 0.19 0.02 0.21 1.02 0.82 Roof top 49.6 2.47 52.07 56.34 1.61 57.95 1.11 1.09
Table 2: Evaluated dose rates in various locations surrounding the hall using FLUKA and MCNP
for D-D neutrons
Detector Location
MCNP Dose rates (µSv/h) FLUKA Dose rates (µSv/h) DFLUKA/DMCNP
Neutron Capture
Gamma Total Neutron Capture Gamma Total Neutron Total
1 1.79 0.076 1.866 1.78 0.05 1.83 0.99 0.98 2 0.704 0.038 0.742 0.76 0.02 0.78 1.08 1.05 3 0.445 0.028 0.473 0.44 0.02 0.46 0.99 0.96 4 1.675 0.11 1.785 1.68 0.08 1.76 1.00 0.99 5 0.19 0.06 0.251 0.20 0.02 0.22 1.06 0.89 6 0.27 0.094 0.364 0.23 0.03 0.26 0.9 0.72 Roof top 72.3 2.45 79.75 75.26 1.52 76.78 1.04 1.03
Table 3: Evaluated dose rates in various locations surrounding the hall using FLUKA and MCNP
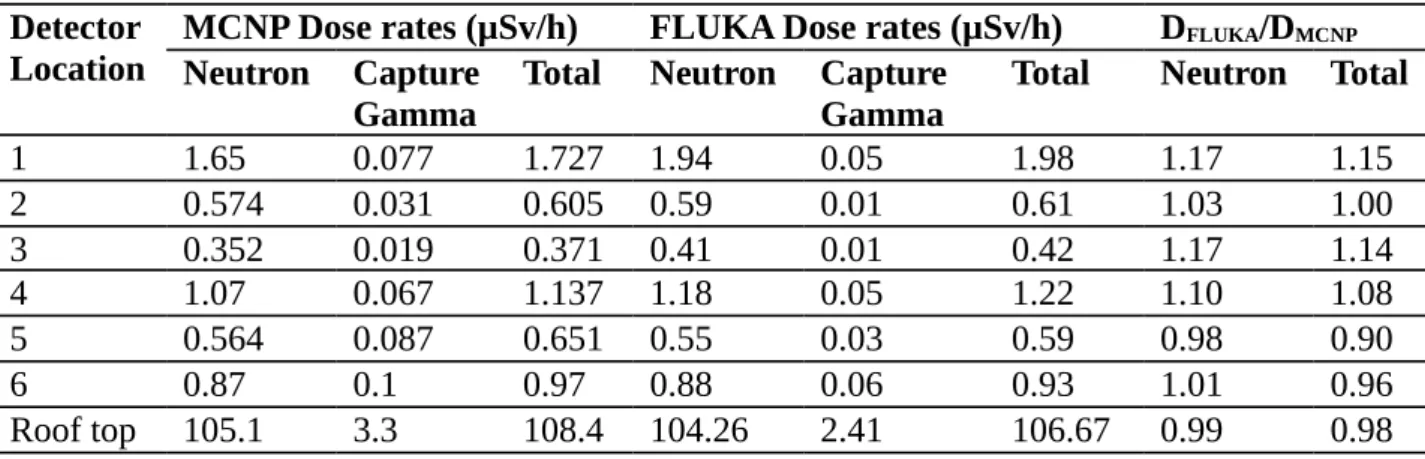
for D-T neutrons
Detector Location
MCNP Dose rates (µSv/h) FLUKA Dose rates (µSv/h) DFLUKA/DMCNP
Neutron Capture Gamma
Total Neutron Capture Gamma
Total Neutron Total
1 1.65 0.077 1.727 1.94 0.05 1.98 1.17 1.15 2 0.574 0.031 0.605 0.59 0.01 0.61 1.03 1.00 3 0.352 0.019 0.371 0.41 0.01 0.42 1.17 1.14 4 1.07 0.067 1.137 1.18 0.05 1.22 1.10 1.08 5 0.564 0.087 0.651 0.55 0.03 0.59 0.98 0.90 6 0.87 0.1 0.97 0.88 0.06 0.93 1.01 0.96 Roof top 105.1 3.3 108.4 104.26 2.41 106.67 0.99 0.98
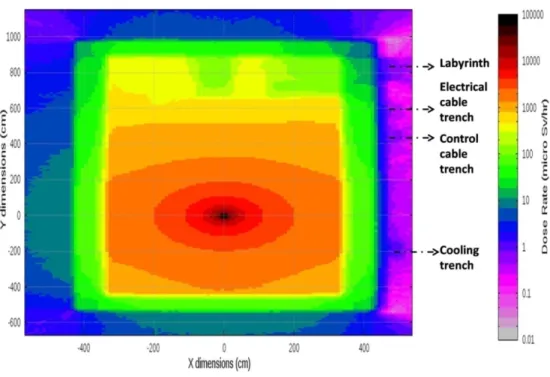
In case of D-Be and D-D neutrons, the deviations in the neutron dose rates estimated by MCNP and FLUKA are found to be within 12 % for all the locations whereas the deviation up to 17% is ob-served for D-T neutrons. However, for the total dose rates, the deviations are up to 18 % for D-Be and D-T reactions and 28% for D-D reaction. This may be partly attributed to the smaller magni-tudes of the capture gamma dose rates and partly to the difference in computational methodologies. The dose rates in the locations 5 and 6 after 1.1 m thick concrete wall are estimated to be < 1 μSv/h irrespective of the type of source spectrum. This result shows that the wall thickness is adequate for all the three types of sources with the yield of 109n/s. The dose rates at the exit of control cable and electric cable trenches (locations 2 & 3) are also estimated to be < 1 μSv/h. Whereas the dose rate at the exit of cooling room trench (locations 1) is estimated to be > 1 µSv/h due to the fact that the trench entrance is closer to the source. Similarly, the dose rate at the exit of labyrinth (location 4) is estimated to be > 1 µSv/h due to radiation streaming. The dose rate distributions simulated by FLUKA in XY plane of LINAC hall shown in Figure 6 which clearly demonstrates the streaming of radiation through the cooling room trench and labyrinth.The total dose rate above the roof top dose is estimated to be high for all cases due to thin roof wall and the same is demonstrated in Figure 7.
Figure 6: FLUKA results on dose rate distributions in XY view (z= -0.2 m plane)
The total neutron dose rates evaluated at the locations 1 & 4 using MCNP simulations for D-Be reaction after incorporating the additional shields over the cooling room trench and labyrinth are found to be reduced to 0.025 μSv/h and 0.0533 μSv/h respectively. Consequently, the locations 1 and 4 are qualified for full occupancy condition. The same thing is applicable to D-D and D-T source cases.
Further, the total dose rates due to the transmission of primary neutrons alone are estimated at the locations 5, 6 and roof top, which lies directly after the continuous shield, using FLUKA simula-tions and the formula given in NCRP-51 [2] for D-D neutrons. In FLUKA calculasimula-tions, slab geome-try modeling is simulated with ‘Importance biasing’ as variance reduction technique. The simula-tions are carried out up to 108 histories with 5 cycles spawn to reduce the statistical uncertainty < 10%.
The analytical formula, which is provided in NCRP-51 for estimating the total dose rate due to the transmission of primary neutrons and the associated capture gamma is given below in eq. (1).
(1) ) 10 8 . 2 ( = H o 7 2 m d X T Bn
= Neutron flux at 1 metre (m2cm-2sec-1)
= Shielding transmission ratio for the neutron (rem-cm2) = Occupancy factor
The values of shielding transmission ratio ( ) are obtained from the multi-collision dose-equiva-lent index transmission curve of concrete for D-D neutrons available in NCRP-51. The values of Bn corresponding to the thickness 1.1 m and 0.275 m of concrete are 4.5 X 10⁻¹² rem-cm2 and 9x10⁻⁹ rem-cm2 respectively. For full occupancy, T=1 is considered in the locations of interest. For the point neutron source of yield 109 n/s, is estimated to be 7.96 X 10³ m2cm-2 sec-1.
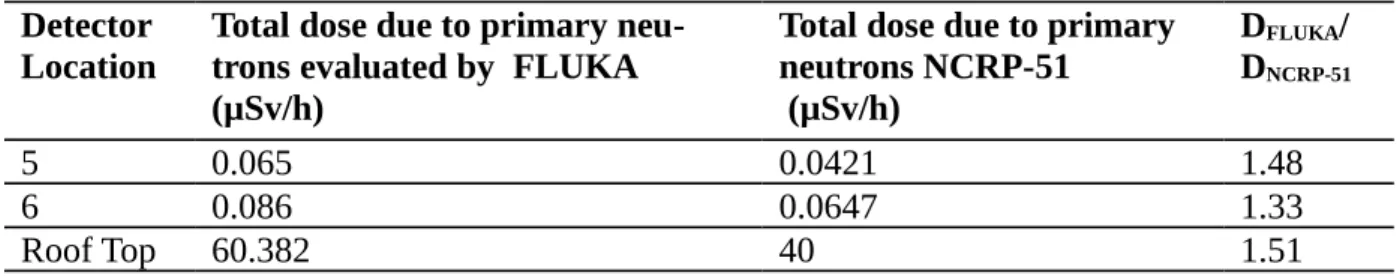
The total dose rates estimated using the formula provided in NCRP-51 are compared with the re-sults of FLUKA simulations in Table 4. Comparison shows that the NCRP-51 values are found to be lower than FLUKA values up to 50%.
Table 4. Evaluated total dose rates due to primary neutrons transmission using FLUKA for D-D
neutrons and the same estimated using NCRP-51 methodology
Detector
Location Total dose due to primary neu-trons evaluated by FLUKA (µSv/h)
Total dose due to primary neutrons NCRP-51 (µSv/h) DFLUKA/ DNCRP-51 5 0.065 0.0421 1.48 6 0.086 0.0647 1.33 Roof Top 60.382 40 1.51
4. CONCLUSION
The shielding adequacy of NG hall, which was designed based on NCRP-51 methodology, has been evaluated using two different MC codes MCNP and FLUKA for neutron sources based on Be, D-D and D-D-T reactions. The study clearly demonstrates that the concrete wall thickness of 1.1 m opti-mized by NCRP-51 satisfies the requirement of dose rates surrounding the hall for full occupancy criteria. The streaming doses at the exits of labyrinth and cooling room trench as suggested by NCRP-51 are verified and consequently the study necessitates the additional shielding in the
corre-sponding locations. The percentage deviations observed among the neutron dose rates evaluated by MCNP and FLUKA are less compared to the total including capture gamma dose rates. This may be partly attributed to the smaller magnitudes of capture gamma dose rates and to some extent due to difference in computational methodologies. The study also shows that the dose rates due to the transmission of primary neutrons through the concrete shield evaluated by FLUKA is observed to be more up to 50% compared to the values estimated using NCRP-51. Hence, this study recom-mends that the shield design optimization using NCRP-51 methodology alone needs an additional shield thickness for the conservative design.
5. ACKNOWLEDGMENT
The authors are grateful to Mr. V.Balasubramaniyan, Director, Safety Research Institute, Atomic Energy Regulatory Board for constant encouragement of this work.
REFERENCES
[1] IGC Report, Safety Analysis report for Installation and testing of LINAC based neutron source, IGC/RSEG/RSD/RTAS/92615/SR/3003/REV-D, 2010.
[2] NCRP - National Council on Radiation protection & Measurements, Radiation protection design guidelines for 0.1-100 MeV particle accelerator facilities, NCRP Report No. 51, 1997.
[3] Fasso A., Ferrari A. et al., FLUKA - A multi-particle transport code. CERN-2005-10, INFN/TC_05/11, SLAC-R-773, 2005.
[4] Bohlen T.T., Cerutti F., et al., The FLUKA Code: Developments and Challenges for High En-ergy and Medical Applications, Nuclear Data Sheets 120, 2014, 211-214.
[5] Briesmeister JF., MCNP-A general Monte Carlo N-particle code, version 4B, Los Alamos Na-tional Laboratories,LA-12625-M, 1997.
[6] Inada T., et al., Neutrons from thick target beryllium (d,n) reactions at 1.0 MeV to 3.0 MeV, Journal of Nuclear Science and Technology 5 (1968), pp. 22-29.
[7] ICRP -International Committee on Radiological Protection, Conversion Coefficients for use in Radiological Protection against External Radiation, ICRP Report 74, Annals of the ICRP, 26 (1997), 3.
[8] Aminian A., et al., ‘Determination of shielding parameters for different types of concretes by Monte Carlo methods’, 13th International conference on emerging nuclear energy systems, 2007.