ENERGY EVALUATION OF REFRIGERATION SYSTEMS IN
PORTUGUESE FRUIT AND VEGETABLE INDUSTRY
J. NUNES
(a), P.D. SILVA
(b), L. DOMINGUES
(c), L.P. ANDRADE
(d), P.D. GASPAR
(e)(a) (d)
Polytechnical Institute of Castelo Branco, Quinta da Sr.ª Mercoles, 6000-909 Castelo Branco, Portugal
(a)
[email protected], (d) [email protected] (b) (c) (e)
University of Beira Interior, Rua Marquês d’Avila e Bolama, 6201-101, Covilhã, Portugal
(b) [email protected], (e)[email protected]
ABSTRACT
The food industry is the major manufacturing sector in Portugal. In particular, the fruit and vegetable sector with a wide range of products such as vegetable crops, vegetables, fruits, potatoes, and crops for industry. Most of these products are produced seasonally and have a very limited lifespan of marketing time as they are perishable. The aim of this study is to characterize the fruit and vegetable industries and indicate solutions that promote their energy efficiency. To this end, we analyzed a sample consisting of 23 units located in central region of Portugal. Data collection was conducted via survey and on-site measurements to obtain information about the facilities, the production process, quantities of raw materials, characteristics of cooling systems, and energy consumption. The potential energy saving was estimated at 18.9% for the sales units to traders and 17.2% for the fruit centrals.
1. INTRODUCTION
The food industry is the main sector of manufacturing industries in Portugal. Particularly, the fruit and vegetable industry is situated in the top positions with a wide range of products such as vegetables, legumes, fruits, potatoes and cultures for industry. In 2012 we obtained a production of 730 469 tons of fruit, 445649 tons of potatoes and 840 744 tons of vegetables. This year this industry had a turnover of EUR 2,222,280,000 (INE, 2013).
Most fruits and vegetables are produced seasonally and are highly perishable, so have a very limited life time for commercialization. Fruits and vegetables, being living organisms, even after harvesting, must remain alive and in good condition until processing or consumption (Fraser, 1998). Álvaro (2001) and Filho (2008) reported that respiration is the biological process that translates how living organisms convert their reserves into energy with the subsequent release of heat, CO2 and water vapor, and it has a major influence on the
conservation process of these products. According Guerra (1996), the respiration rate of these products decreases by half for each 10 °C of temperature reduction.
The perspiration is another biological phenomenon of great relevance in the process of conservation of fruits and vegetables (Alvaro, 2001; Chau, 1992). Inadequate handling of products in practice can promote mechanical damage and stimulate weight loss and increased exposure to microorganisms attacks. Exposure of the product to a marked differences in vapor pressure through rapid reduction of the product temperature to which it supports, as well as the use of low relative humidities and exposure of the product to unnecessary movements of air are harmful to the quality of products (López and Rodríguez, 2000).
To minimize the effects of the above factors and prolong the conservation time of fruit and vegetable, refrigeration is used as one of the major techniques in conjunction with the use of controlled atmospheres (Parikh, 1990). According Lopez and Rodriguez (2000), Marvillet (2001) and Rosset et al. (2002) rapid temperature decrease of the crop, avoids many of the aforementioned problems associated with the post-harvest period. The immediate application of cold allows to reduce the loss of vitamins and sugars, organic acids, water as well as the speed of biochemical and enzymatic reactions (IIF, 2008). For most species of fruit the longer conservation period is obtained at a temperature range of 0-4 °C. According to López and
Rodríguez (2000) and Alvaro (2001) the ideal temperature for the conservation of many species of leafy vegetables and some fruit species is 3-6 º C.
Given the importance of rapid cooling to remove the heat of harvest, we witnessed in last years the development of modern technologies for these applications. According Marvillet (2001) and IIF (2008) within these technologies we can find cooling chambers with evaporators equipped with two-speed fans, cooling tunnels with water and vacuum, often used for products with a high surface/volume ratio, and even immersion or spraying techniques with ice water.
The conservation of fruits and vegetables is carried out mostly in central fruit production, packaging and shipping. According to IIF (2008) cooling systems with high refrigerating powers per unit of volume of cooling chambers (50-100 W/m3) are prefered for the conservation of summer products with short life time. For conservation of long products duration, such as apples, pears, kiwi, in most cases cooling is combined with controlled atmosphere (-1 to 4 ° C). In this case the refrigerated power per unit volume for the cooling systems is between 25 and 40 W / m3 (IIF, 2008). To ensure that the organoleptic characteristics of these products, from harvest to final consumer, a high use of refrigeration systems is required to ensure the desired temperature and relative humidity inside cool rooms. Therefore, it is expected a high consumption of electrical energy. The high energy costs and the need to ensure sustainability of the cold chain require an implementation of energy efficiency measures, particularly in refrigeration systems. The objectives of this study are: first, analyze the profile of electrical energy consumption of the Portuguese fruit and vegetable industry, secondly determine indicators of specific energy consumption on this sector, and thirdly, to study potential energy savings and arrange a set of appropriate measures to improve its energy efficiency.
2. METHODOLOGY
2.1- Sample
The present study was conducted on a sample of 23 fruit and vegetable industrial plants, located in the interior region of central Portugal. The construction of our sample took account of the reunion of the companies that have as main activity, the collection, conservation and sale of fruit and vegetables products. Depending on the type of business, samples were divided into two categories: industrial plants that act as resale establishments, selling chilled fruit and vegetable to traders of small shops for direct sale of products to customers (plants F1 to F7); and the fruit centrals that collect, cool, calibrate and perform shipment of the products for large commercial surfaces (plants F8 to F23).
2.2- Data collection
Initially we developed a wide inquiry to perform a collection of information on the industrial plant. This inquiry consists of several sections, each to record specific industrial information: general description, quantities of raw materials, production quantities, electrical energy consumption, energy costs, characteristics of refrigerating and freezing chambers, environmental conditions, characteristics of cooling systems and finally characteristics of the activity and production process. The process of data collection was conducted in person and was performed simultaneously with a visit to each industrial plant, during which the facilities, equipment, technical operations and production processes were observed.
2.3- Database
A database in an Access application was created, for registration of all information collected in the field work. This database was also set to perform the analysis and processing of the data. It also allows us to obtain several indicators of industry performance and simultaneously perform a comparative analysis between various industrial plants of this sector.
2.4- Equipment and measurement techniques
A set of equipment was transported to each one of the companies, in order to quantify several parameters. For measuring environmental conditions inside and outside of refrigeration equipment, particularly temperature and relative humidity, we used digital measuring equipment Testo 435-2 with a multifunction temperature and humidity probe with an accuracy of ±0.3 °C and ±2%, respectively. To measure the temperature of the surfaces we use the same equipment and a contact probe with type K thermocouple, with an accuracy of ±0.5 º C. We use a clamp meter Escort ECT-620, with an accuracy of ±1.5%, to measuring the intensity of the electric current and voltage input to the compressor motors, in order to determine their electrical power. The values of the electrical power obtained experimentally, were then compared with the
estimated values by using software and catalogs of official representatives of the brands, for the operating conditions, and we checked a good approximation between the two, always below 10%. Although energy consumption were quantified by analyzing the monthly bills of electrical energy supplier, we also carry out the analysis of electrical energy consumption profile through the use of an energy analyzer, Elcontrol-Energy Explorer. This equipment has an accuracy of ±0.5%, for voltage, ±1%, for current, and ±2% for electric power and electrical energy measurements. The dimensional measurements of cool rooms (refrigeration and freezing chambers) was performed using an infrared rangefinder, Bosch DLE-40, with an accuracy of ±1.5 mm.
3. DESCRIPTION OF ACTIVITY AND TECHNOLOGICAL PROCESS
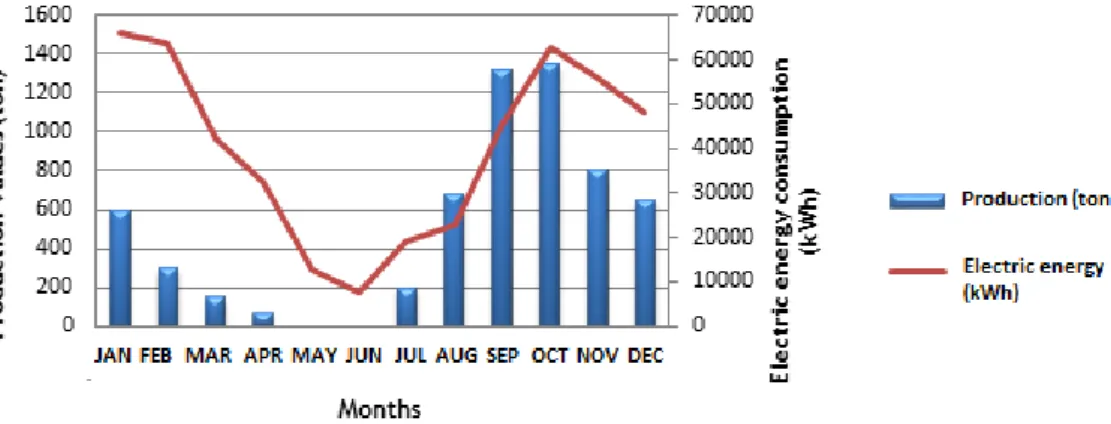
According to the survey results, the fruit and vegetable industry have two types of activity: annual and seasonal. The companies that perform an annual activity are those that sell their products to traders in these small shops to sell them later to the final consumer. These companies sell a variety of chilled fruits and vegetables. Figure 1 shows the activity profile and annual energy consumption of an industrial plant like this.
Figure 1 - Profile of annual activity of F1 industrial plant (resale establishment)
On the other hand, the seasonal activity carried out during certain months of the year and is typical of owners of fruit plants or producers of fruit that have one or more fruit species (apple, peach, plum, cherry, pear). Generally producers catch the fruit from the orchards, as this shows the state of maturation desired. In Figure 2 we can see that the activity of this industry is during the months of May to October, with the peach as dominant species.
However, the seasonal activity can be conducted for longer periods of time. In this case the conservation of fruit is carried out in controlled atmosphere, where is performed the simultaneous control of temperature, relative humidity and concentration of CO2 and O2. To this end these cool rooms are built with special care
and use doors that allow them to present an overall tightness.
The graph of Figure 3 shows the activity profile of an industry of fruit preservation under controlled atmosphere. We can see in the graph that the activity is carried out between January to April and from July to December from the same year.
Figure 3 - Seasonal activity profile of F20 industrial plant (fruit centrals with controlled
atmosphere).
During the field work we found that in establishments selling products to traders, in the morning the products are removed from the chambers and placed in the center of the facilities, often without air conditioning to stay exposed. At the end of the day, unsold products are again placed inside the chambers. This procedure, together with the large number of times that the doors of cooling chambers are opened, contributes to raise the thermal loads to the inside providing an increased work of refrigeration systems. The production process of the fruit centrals consists of the following operations: collection, transportation, reception on the establishment, pre-cooling/cold conservation, calibration and labeling, and finally the expedition.
The application of cold is a fundamental operation in three important points of the process: rapid cooling of the fruit, the fruit in cold storage and finally maintaining the fruit in the cold shipping chambers. Regarding the industrial plants in our sample, there are very few that have chambers or rapid cooling tunnels, appropriate for pre-cooling fruit. In our case, we only found two, which are equipped with a cooling chamber specific to this operation.
These cooled chambers have refrigeration facilities with adequate capacity to work with forced air evaporators equipped with two-speed fans. The fruit is placed in the chambers that are at a temperature between 0 to 2 °C and relative humidity between 85 and 90%, sometimes even higher with the use of air humidifiers, and is rapidly cooled by cold air that comes from the evaporator at great speed. Generally the fruit is maintained under these conditions for 2 to 3 hours. After that, it continues in the same chamber but with lower air velocity or it is transferred to other refrigeration chamber for conservation. The temperature and humidity of conservation chambers depends on the species but are almost always comprised between 0 to 2 °C and 85 to 90%, respectively, and a lower velocity of the air in chamber.
All other establishments use standard refrigeration chambers, with an evaporator provided with single speed fans, in this case to perform cooling and conservation of fruit. Environmental conservation conditions are identical to those indicated above. The maintenance time of the fruit in the chambers is variable and can range from 1 to 8 days. As the companies have a small storage capacity, usually between 20 to 30 tons, the cycle of fruit picking is almost adjusted to market needs.
The fruit comes out of conservation rooms as there are orders. In this case, the fruit is removed and calibrated in the calibration machine and then is packed and labeled. Then it is placed into a conservation chamber intended to maintain the temperature about 2 °C and not less than 85% relative humidity and then is put inside the refrigerated vehicles for shipment.
4. DISCUSSION OF THE RESULTS
To perform the analysis of the energy performance of the different industrial plants we consider two indicators: the specific energy consumption, SEC, and specific energy consumption per volume unit of cooling chambers, SECV.
The specific energy consumption (SEC) is used in many scientific studies to analyze the evolution of energy efficiency in industry (ICAEN, 2010; Murray, 2010; Ramirez et al, 2006; Singh, 1986). This indicator provides information about the energy use per unit of production and can be used to characterize the energy performance of industry through benchmarking analysis.
The specific energy consumption can be calculated using Eq. (1).
P
E
SEC
=
(1)Where, E is the electrical energy consumption on annual basis (kWh), P the amount of product on annual basis (ton) and SEC the specific energy consumption of electrical energy (kWh/ton).
The specific energy consumption per volume unit of the chambers can be calculated using Eq. (2)
V
E
SECV
=
(2)
Where V is the total volume of cooling chambers (m3) and SECV the specific energy consumption of electrical energy per volume unit of the chambers (kWh/m3) (Billiard, 2003; López et al, 2005.).
Table 1 and Table 2 show the results of energy consumption and energy indicators of annual industrial activity. We found that the majority of vegetable and fruit industrial plants have an annual power consumption less than 500 toe, which is the reference above which the Portuguese companies are classified as intensive energy consumers. In terms of primary energy, the 23 industrial plants consumed a total of 403.8 toe which gives an average of 17.5 toe per company. This energy consumption gave an emission of 883 tons of carbon dioxide (CO2) into the atmosphere.
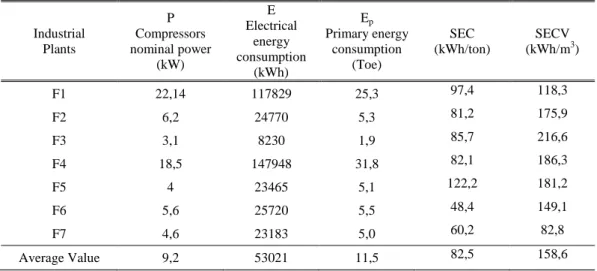
Table 1 – Results of energy consumption and energy indicators of annual industrial activity (resale establishments) Industrial Plants P Compressors nominal power (kW) E Electrical energy consumption (kWh) Ep Primary energy consumption (Toe) SEC (kWh/ton) SECV (kWh/m3) F1 22,14 117829 25,3 97,4 118,3 F2 6,2 24770 5,3 81,2 175,9 F3 3,1 8230 1,9 85,7 216,6 F4 18,5 147948 31,8 82,1 186,3 F5 4 23465 5,1 122,2 181,2 F6 5,6 25720 5,5 48,4 149,1 F7 4,6 23183 5,0 60,2 82,8 Average Value 9,2 53021 11,5 82,5 158,6
Making an assessment by categories, the average value of the primary energy consumption for industrial plants with annual activity (resale establishments, see Table 1) is 11.5 toe and for fruit centrals (see Table 2) is 20.3 toe.
The resale establishments have an average annual electrical energy consumption of 53.1 MWh , an annual average production of 24.9 tons of CO2 and an electric specific energy consumption SEC 82.5 kWh / ton. On
the other hand, the fruit centrals have an annual average electrical energy consumption of 68,6 MWh, an annual average production of carbon dioxide 44,3 CO2 and a electrical specific energy consumption of 60.8
conclude that, on average, the cooling systems are responsible for about 84 % of electrical energy consumption, lighting by 0.7% and other equipment (e.g., compressed air, calibrators, among others) by 15.4% .
We note as well that the power consumption of the fruit centrals category is 76.5 % higher than the power consumption of the resale establishment category. This result shows that the power consumption of the fruit centrals is more intensive, although work on a seasonal basis, unlike the power consumption of the other category, working on an annual basis. This result is mainly a consequence of the higher power rating of the refrigeration compressor which is used by the fruit centrals.
As noted from Table 1 and Table 2, the average power rating of refrigeration compressors of fruit centrals category is 40.5 kW, while the average power rating of the resale establishments is 9.2 kW. In this case we note an increase of 340% of compressors refrigeration power on fruit centrals. The higher power rating of compressors in this category is justified by the need for cooling large quantities of products (fruit). Within each category there are some industrial plants that have different characteristics. For example, within the category of industries with annual activity, shown in Table 1, the F1 and F4 industrial plants perform a greater activity and therefore also have much higher energy consumption.
On the other hand, the F8 to F23 plants match the category of fruit plants and, as can be shown in Table 2, there are three of them (F8, F20 and F21) where electrical energy consumption is much higher than the others. The cause for these differences in energy consumption is also related to the increased level of activity, and therefore, an increased use of refrigeration systems of these three industrial plants. They have the highest nominal power of the refrigeration compressors. The F20 plant also features a specific technological process related with the fruit conservation through controlled atmosphere.
The specific average energy consumption, SECaverage, obtained for resale establishments was 82.5 kWh/ton
and for the category of fruit centrals was 60.8 kWh/ton, i.e., 35.7% lower. The value obtained for the SECaverage of fruit centrals is lower than the value of 77.4 kWh/ton, presented by ICAEN, 2010. The
difference is due to the fact that it isn’t a common practice the immediate realization of the fast cooling of the fruit, as mentioned in point 3, as opposed to the procedure described in (ICAEN , 2010).
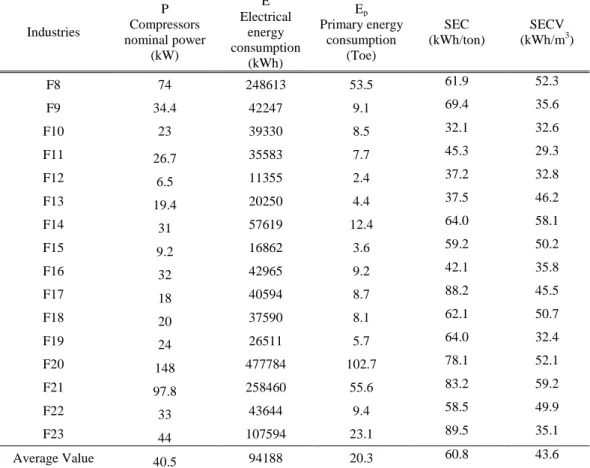
Table 2 – Results of energy consumption and energy indicators of seasonal activity (fruit centrals)
Industries P Compressors nominal power (kW) E Electrical energy consumption (kWh) Ep Primary energy consumption (Toe) SEC (kWh/ton) SECV (kWh/m3) F8 74 248613 53.5 61.9 52.3 F9 34.4 42247 9.1 69.4 35.6 F10 23 39330 8.5 32.1 32.6 F11 26.7 35583 7.7 45.3 29.3 F12 6.5 11355 2.4 37.2 32.8 F13 19.4 20250 4.4 37.5 46.2 F14 31 57619 12.4 64.0 58.1 F15 9.2 16862 3.6 59.2 50.2 F16 32 42965 9.2 42.1 35.8 F17 18 40594 8.7 88.2 45.5 F18 20 37590 8.1 62.1 50.7 F19 24 26511 5.7 64.0 32.4 F20 148 477784 102.7 78.1 52.1 F21 97.8 258460 55.6 83.2 59.2 F22 33 43644 9.4 58.5 49.9 F23 44 107594 23.1 89.5 35.1 Average Value 40.5 94188 20.3 60.8 43.6
Regarding to the specific electrical energy consumption per volume unit (SECV), we noted that resale establishments present higher values than fruit centrals. From the analysis of Table 1 and Table 2,
SECVaverage of the resale establishments is equal to 158.6 kWh/m 3
while SECVaverage of the fruit centrals is
43.6 kWh/m3, i.e., 263.8% higher. The highest SECV values on resale establishments are due to the annual activity of these companies, a smaller volume of refrigeration chambers and cooling chambers used with partial charge. Additionally many of them don’t use techniques and procedures that promote the reduction of cooling system operation, such as, the reduction of the number of times that the doors of the chambers are opened, the use of plastic tapes or air curtains on the doors and good sealing of the doors. Regarding the indicator value SECVaverage of the fruit centrals (43.6 kWh/m
3
), we noted that it fits in the range of 30-50 kWh/m3 presented by Billiard, 2003.
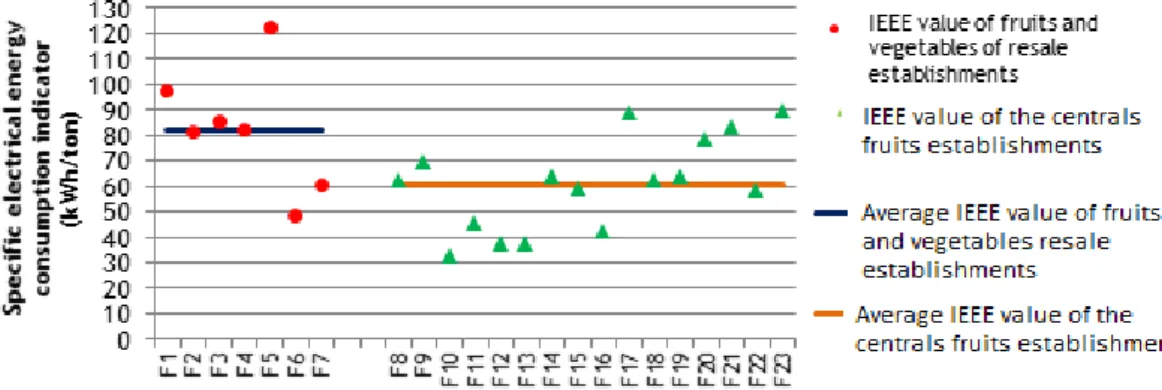
In Figure 4 we present the values of SEC that correspond to industrial plants with annual activity (resale establishments) and the fruit centrals with seasonal activity. The SEC average values for the two kinds of industrial plants are 82.5 kWh/ton and 60.8 kWh/ton, respectively. Analyzing the Figure 4 we see that there is a great variability of the SEC values of the industrial plants in both categories with respect to their average values.
Since in each category the companies develop very similar activities, the difference of the SEC values suggests that are different ways in the energy use. Thus this indicator can be used to assess the potential for energy savings in each industrial plant. At the same time, this indicator allows us to identify the premises where the best practices of energy efficiency are carried out.
Assuming that all industries with a higher value than the average SEC (see Figure 4) implement practice measures to improve the energy efficiency in order to achieve this average value, it should be expected an overall potential of electrical energy saving of 18.9% on resale establishments (annual activity) and 17.2% on fruits central establishments (seasonal activity). In this case, the procedure presupposes sharing the best practices of energy use in this sector.
Figure 4 – Specific electrical energy consumption for the analyzed companies.
CONCLUSIONS
The present study aims at characterizing energy use of vegetable and fruit industry, and quantifying the potential energy savings that could be achieved. We conclude that this industry is organized in two types of industrial units, one dedicated to the sale of products to the vegetables and fruit dealers (resale establishments) and other is dedicated to the preparation, calibration and maintenance of the products for sale to supermarkets (fruit centrals establishments). In energetic terms we conclude that the resale establishments are the most energetic intensive compared to the fruit centrals establishments. We also concluded that resale establishments are the ones with higher electrical energy consumption per unit of production, with the average value of 82.5 kWh/ton while the fruit centrals establishments have a value of 60.8 kWh/ton. In other hand, we also found that the average value of the specific electrical energy consumption per cool rooms volume unit obtained for resale establishments is 158.6 kWh/m3 and fruit centrals establishments is 43.6 kWh/m3. Despite the cooling systems are indispensable in the fruit and vegetable industry, the fruit centrals are the ones that present highest nominal electrical power of refrigeration compressors for the execution of the technological process. From the above, we can conclude that although these industries are not considered intensive energy consumers it is pertinent to examine the conditions of energy use in order to rationalize
consumption, whether through the adoption of measures for the rational use of energy or through implementation of more energy efficient technologies.
REFERENCES
1. Álvaro, A.H., 2001. Post cosecha. ARDA- Serveis al sector agroalimentaria, LIeida, Espanhã.
2. Billiard, F., 2003. Nouveaux développment de la chaîne du froid: spécificités des pays chauds. Bulletin of the the International Institute of Refrigeration- n.º 2003-3, 4-14.
3. Chau, K.V., 1992. Cooling and storage of fruits and vegetables. Anais II Congresso Brasileiro Refrigeração Ventilação e ar Condicionado, Abrava.São Paulo, 21-25.
4. Filho, L.C.N., 2008. Refrigeração e Alimentos. Faculdade de Engenharia dos Alimentos, Universidade Estadual de Campinas, Campina, Brasil.
5. Fraser, H.W., 1998. Tunnel de refroidissement par air pulsé pour le conditionnement des fruits et des légumes frais. Division de l’Agriculture et des Affaires rurales du MAAARO, Vineland. Ontário. 6. Guerra, F., 1996. Tecnología post-cosecha de frutos cítricos. Curso Integral de citricultura. Instituto de
Investigaciones de Fruticultura Tropical. Espanhã.
7. ICAEN, 2010. Estudi i analisi dels resultats de les diagnosis energètiques en càmeres frigorífiques de fruita. Institut Català d'Energia, Department d'Agricultura Alimentació i Acció Rural, Comunitat
Europea.(Available in:
http://www20.gencat.cat/docs/icaen/09_Agricultura,%20Ramaderia%20i%20Pesca/documents/arxius/6 51123_informe_final_cambres_frigorifiques.pdf).
8. IIF, 2008. 100 ans d' innovation dans le froid. Revue Générale du Froid et du Conditionnement d' air et l' Association Française du Froid, Paris.
9. INE, 2013. Indicadores económicos: Produtos produzidos na indústria por Tipo de produto (Por CAE Rev. 3); Anual INE, Instituto Nacional de Estatística, I.P. (Available in: http://www.ine.pt/xportal/xmain?xpid=INE&xpgid=ine_indicadores&indOcorrCod=0002724&contexto =bd&selTab=tab2).
10. López, A., Esnoz, A., Carles, B., Coronas, A., 2005. Estudi tecnològic del fred a la indústria agroalimentària i les seves millors tecnologies disponibles en consum d'energia. Institut Català d'Energia. Sociedad Espanola de Ciências y Técnicas del Frio.
11. López, R.A., Rodríguez, J., P. Z., 2000. Productos Vegetales: Regulación de los Pocesos Fisiológicos Post-Recolección, in: Lamúa, M. (Ed.), Aplicación del Frío a los Alimentos. AMV Ediciones e Mundi Prensa, Instituto del Frío-Madrid, pp. 69-103.
12. Marvillet, C., 2001. Application industrielle du froid. Editions T.I.- Techniques de l'ingénieur,France.3-02-2013]. (Available in: http://www.techniques-ingenieur.fr/base-documentaire/energies- th4/production-de-froid-machines-frigorifiques-et-refrigerants-42211210/applications-industrielles-du-froid-be9756/).
13. Murray, A.N., 2010. Theoretical Calculations of Energy usage and Carbon Emissions From Food Processing Plants. Andrew Murray Consulting. Hermanus. (Available in: http://www.foodengineering.co.za/images/Murray%20paper%20for%20Iufost.pdf).
14. Parikh, H.R., Nair, G. M., Modi, V.V. , 1990. Some Structural Changes during Ripening of Mangoes by Abscisic Acid Treatment. Annals of Botany 65, 121-127.
15. Ramírez, C.A., Blok, K., Neelis, M., Patel, M., 2006. Adding apples and oranges: The monitoring of energy efficiency in the Dutch food industry. Energy Policy 34, 1720-1735.
16. Rosset, P., Beaufort, A., Cornu, M., Poumetrol, G., 2002. La chaine du froid en agroalimentaire. Cahier de Nutrition et de Diététique 34, 2, 124-130.
17. Singh, R.P., 1986. Energy Sccounting of Food Processing Operations. In Energy in Food Processing (Ed R. Paul Singh) Elsevier.