VALUATION OF PHOENICS
Stefan Köppl
Project submitted as partial requirement for the conferral of Master in Business Administration
Supervisor:
Helena Pinto de Sousa, ISCTE Business School, Departamento de Finanças
Abstract
This work presents theoretical background for diverse valuation methods, with special attention paid to the real options method and its advantages over traditional methods for valuation of young entities. Additionally, it presents a case study of a start-up company, the value of which is found using diverse methods. The main result shows that the value of the company obtained with the real options approach is much higher than the one found with traditional discounted cash flow (DCF) method. Moreover, it shows that the difference in the obtained valuations leads to different strategic decisions: according to DCF certain projects should not be undertaken, whereas according to the real options approach the company should expand its operations.
Keywords: real options valuation, discounted cash flow valuation, start-up companies
JEL Classification: M13, M21, M41
Abstract – Portuguese
Esta dissertação apresenta uma base teórica para diversos métodos de avaliação, com especial atenção para o método de opções reais e as suas vantagens em relação aos métodos tradicionais de avaliação de entidades jovens. Além disso, apresenta um case study de uma empresa start-up, cujo o seu valor é encontrado usando diversos métodos. O resultado principal mostra que o valor da empresa obtido com a utilização de opções reais é muito maior do que o encontrado com o método tradicional de fluxos de caixa descontados (DCF). Também mostra que a diferença entre as valorizações obtidas, leva a diferentes decisões estratégicas: de acordo com DCF determinados projectos não devem ser realizados, no entanto segundo as opções reais, a empresa deve expandir suas operações.
Acknowledgements
It is a pleasure to thank the many people who made this dissertation possible. I would like to thank my supervisor Helena Pinto de Sousa for her support and valuable comments. Her deep knowledge and precision vitally improved this work. Moreover, I would like to thank the Lechner brothers: Thomas, David and Gregor, who have provided me with access to all necessary data about their company, without which it would not be possible to write this dissertation. Moreover, I vastly appreciate help of Stefan Kienberger, the advisor of Phoenics OG, who was a great help in understanding the nuances of the advertisement market. Finally, I would like to thank my wife Monika Turyna for proofreading the text and my newborn son David for sleeping just enough so that I could finish the work.
Table of contents
Table of contents ...IV List of Figures and Tables ... VII Executive Summary ...IX
1 Introduction ... 11
1.1 Overview of the Problem ... 11
1.2 Problem Statement ... 12
1.3 Synopsis of the goals ... 12
1.4 Fixing the boundaries ... 12
1.5 Target Audience ... 13
1.6 Data Collection ... 13
2 Valuation Theory ... 15
2.1 Introduction ... 15
2.2 Brief description of basic traditional methods ... 16
2.2.1 Discounted Cash Flow Methods ... 16
2.2.2 Scenario analysis ... 24
2.2.3 Monte-Carlo Simulation... 25
2.3 Comparison Analysis ... 26
2.3.1 Comparable Companies Analysis ... 26
2.3.2 Comparable Transactions Analysis ... 26
2.4 Single Valuation Approaches ... 27
2.4.2 Replacement Cost Approach ... 27
2.5 Applicability of valuation methods to high tech start-ups ... 28
2.5.1 High Growth Features of Valuation ... 28
2.5.2 Discounted Cash Flow ... 29
2.5.3 Venture Capital Method ... 30
2.5.4 Patent Valuation Methods ... 31
3 Real Options Approach ... 34
3.1 Introduction ... 34
3.2 Literature about Real Options ... 35
3.3 Types of Options ... 38
3.3.1 Option to defer ... 39
3.3.2 Option to abandon ... 39
3.3.3 Option to expand or contract ... 40
3.3.4 Compound options ... 40
3.4 Real Option Valuation Methods ... 41
3.4.1 The Black Scholes Method ... 41
3.4.2 The Binomial method ... 42
3.4.3 Monte Carlo Simulation ... 43
3.5 Limitations of the analogy to financial options ... 44
3.6 Real Options in Patent Valuation ... 45
4 Case Study: Introduction ... 47
4.1 Description of the company ... 47
4.2 Key Financial Data ... 47
4.2.1 Balance Sheet ... 48
4.3 Market size and market potential ... 51
4.4 SWOT Analysis ... 53
5 Case Study: Valuation ... 56
5.1 Core Assumptions ... 56
5.1.1 Projections and Budgets ... 56
5.1.2 Income statement forecast ... 58
5.1.3 Balance Sheet Forecast ... 59
5.2 DCF – Valuation ... 60
5.2.1 Calculation of the Weighted Average Cost of Capital ... 60
5.3 Real Options valuation ... 67
5.3.1 NPV ... 69
5.3.2 Volatility ... 79
5.3.3 The Value of the Real Options ... 83
5.4 Valuation of Phoenics with the Real Options method ... 90
5.5 Comparison of Real Option Approach and the FCFF method ... 91
6 Conclusions and Prospects ... 93
List of Figures and Tables
Figure 1: Overview of valuation methods ... 16
Figure 2: Categories of real options according to Copeland and Keenan (1998) ... 38
Table 1: Balance Sheet Phoenics OG: Assets: 2010 - October 2012 ... 49
Table 2: Balance Sheets Phoenics OG: Liabilities & Owners Equity: 2010 - October 2012... 49
Table 3: Income Statement Phoenics OG: 2010 - October 2012 ... 50
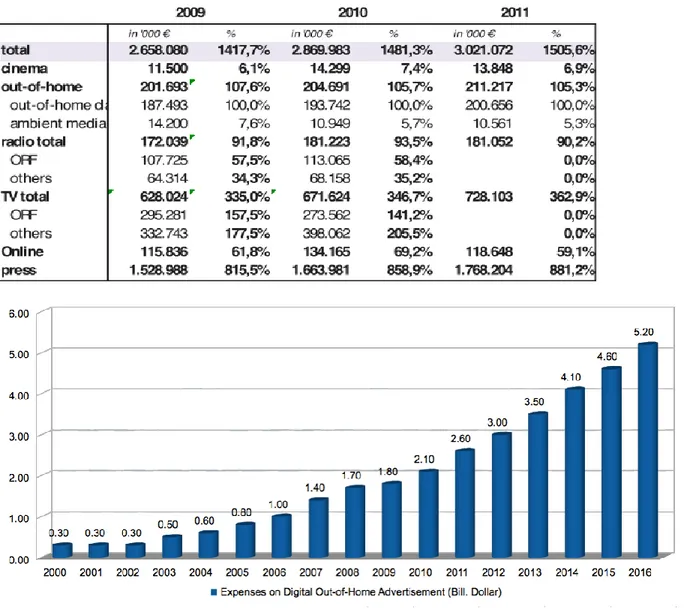
Figure 3: Advertisement expenses in Austria 2000-2010 ... 51
Table 4: Gewista - Advertising revenues in Austria ... 52
Figure 4: Worldwide expenses on digital out-of-home advertisement - forecast ... 52
Figure 5: Sales in the advertising market in Austria ... 53
Table 5: Income Statement Phoenics OG: Forecast 2012-2016 ... 58
Table 6: Balance Sheets Phoenics OG: Assets: Forecast 2012 – 2016 ... 60
Table 7: Balance Sheets Phoenics OG: Liabilities and Equity: Forecast 2012 - 2016 ... 60
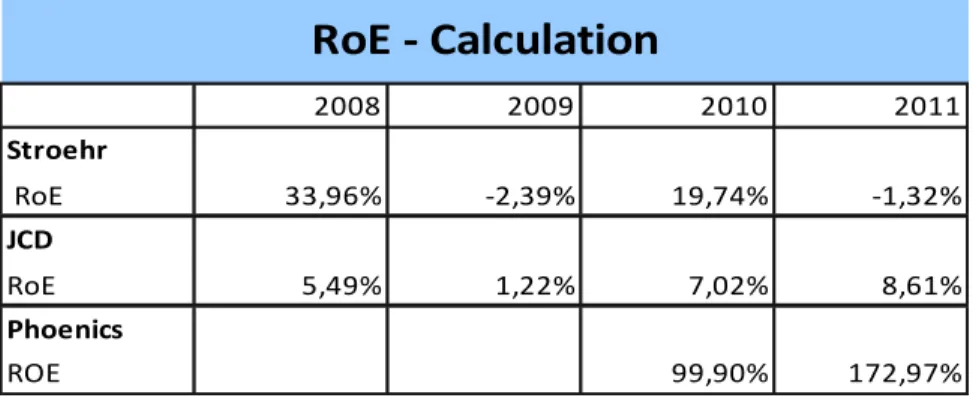
Table 8: RoE Calculation, Stroehr, JCD and Phoenics ... 62
Table 9: DCF Valuation, Cash Flow Statement - forecast ... 66
Table 10:DCF Valuation: Final result ... 66
Table 11: Prediction of market shares - expansion. ... 69
Table 12: Income Statement forecast - expansion. ... 69
Table 13: Balance Sheets forecast: Assets - expansion. ... 70
Table 14: Assumptions of the expansion scenario. ... 70
Table 15: Balance Sheets forecast: Liabilities and Equity - expansion. ... 71
Table 16: Cash Flow Statement forecast - expansion... 71
Table 17: DCF Valuation - expansion. ... 72
Table 18: Income Statement forecast - sale. ... 73
Table 19: Prediction of market shares - sale... 73
Table 20: Balance Sheets forecast: Assets - sale. ... 73
Table 21: Balance Sheets forecast: Liabilities and Equity - sale. ... 74
Table 22: Cash Flow Statement forecast - sale... 74
Table 23: DCF Valuation - sale. ... 75
Table 24: Prediction of market shares - expansion + sale. ... 76
Table 26: Balance Sheets forecast: Assets - expansion + sale ... 76
Table 27: Balance Sheets forecast: Liabilities and Equity - expansion + sale. ... 77
Table 28: Cash Flow Statement forecast - expansion + sale ... 77
Table 29: DCF Valuation - expansion + sale. ... 78
Figure 6: Simulated distribution of the intermediate variable - expansion. ... 81
Figure 7: Simulated distribution of the intermediate variable - sale. ... 82
Figure 8: Simulated distribution of the intermediate variable - expansion + sale. ... 82
Figure 9: ROV: Assumptions of the expansion scenario. ... 84
Figure 10: ROV: Lattice evaluation - expansion. ... 85
Figure 11: ROV: Sensitivity analysis - expansion. ... 86
Figure 12: ROV: Black-Scholes value - expansion. ... 87
Figure 13: ROV: Assumptions of the expansion + sale scenario. ... 88
Figure 14: ROV: Lattice evaluation - expansion + sale - phase 1. ... 89
Figure 15: ROV: Lattice evaluation - expansion + sale - phase 2. ... 89
Figure 16: ROV: The value of sale scenario. ... 90
Table 30: Summary of the NPV valuations. ... 91
Executive Summary
This work aims to show the reader the theoretical environment of the valuation of young companies as well as apply the diverse methods to a case of a start-up. Furthermore, the thesis compares the differences and strategic impacts of DCF methods and the real options approach.
Since the importance of start-up companies is growing worldwide there is also a need for financing them. The need for financing creates a need for evaluating the entities. Unfortunately, traditional valuation methods, mainly DCF methods do not provide satisfactory results. This is mainly because start-ups or young companies’ assets mainly consist of intangible components, which provide the company with opportunities to create value in the future but usually are not accurately reflected in the DCF valuation. The lack of flexibility and the immense impact of high discount rates are the main reasons for the failure of DCF in these cases.
The real options approach provides a framework which can help solve that problem. It forces one to calculate possible opportunities which arise of the possibilities given by intellectual property within the young company. It further sees risk as an opportunity and therefore high volatility of profits has a positive impact on the value of the entity. Due to this, the real options approach usually results in higher valuations than DCF methods do.
Both valuation methods have been applied to the case of the Austrian company Phoenics OG. Phoenics OG invented a 360° video wall and holds patent rights over it. Currently, this product is rented in Austria. One idea for expansion of the business model is selling the product, which however requires an investment of EUR 100.000. The company is also considering expanding to the German market.
DCF valuation leads to a result of EUR 1.429.387. This result does not take into account any strategic opportunities arising from the patent. It is obvious that there is a need for improvement of this valuation. Phoenics has three main options: either the company expands to Germany, invest in the product to sell it, or to do both. These three scenarios serve as an input to the real options analysis, which provides answers as to whether the company should follow one of these opportunities or not. The result shows that Phoenics should expand to Germany but should not produce the product serially. The third scenario, doing both, could also be followed.
Real options valuation of the scenarios leads to a value of EUR 4.611.621 for the expansion scenario and EUR 4.202.726 for the sale scenario, taking into account the compounding effect. Consequently, the value of doing both can be calculated as EUR 8.814.347. Adding the base case to the sum of the real options the value of the firm is seven times higher than the value found with DCF.
The difference in values reflects what has been expected. An additional result of the valuation is the strategic impact of different valuation methods: whereas DCF would have led to the decision of not producing it serially, and therefore missing the opportunity to do both, valuation with real options suggests the opposite.
In sum, the result reflects the theoretical predictions. However, one should not solely account for this additional information on the side of the real options valuation. The real options approach is much more than a valuation method: it is a way of thinking and identifying strategic options. Of course, due to the fact that volatility positively influences the result, real options valuations will be in most cases higher than the DCF result. Still, the main advantage of this method is a careful and detailed analysis of all scenarios and opportunities.
1 Introduction
1.1 Overview of the Problem
In a globalized world, small but innovative ventures are able to serve various markets even at a very early stage of their existence. What makes it hard to value their equity is their huge potential to quickly explore new markets, however, accompanied by substantial uncertainty.
Due to high risk, it is hardly possible to refer to debt as a major source of financing. Therefore, in the absence of public subsidies young firms have to rely on business angels or venture capitalists, depending on the development stage of their firm. In this case, a valuation of the entity or the patent as a major part of it is necessary to determine the fair value of the equity.
The aim of this work is to present and analyze different methods of corporate valuation applied to young companies. As previously noted, the companies in question are operating in a high uncertainty environment and often the major part of their equity consists of intangible assets such as patents or brands. Therefore, this thesis concentrates on presenting what methods can be used to valuate such innovative ventures, and analyzes why some of them are more suitable than others. Moreover, it show how different methods result in different estimates, and provide the explanation of these differences.
For sure, the Discounted Cash Flow method (referred to throughout as DCF) is still the widest used method to value companies. But since especially start-up ventures have high flexibility in management choices and high uncertainty in decision-making, it seems to be more suitable to use a Real Options approach in order to value these entities.
This work is structured as follows. Firstly, the company in question and its current stage of evolution will be described. Secondly, an overview of the different quantitative valuation methods together with their advantages and disadvantages are discussed. Thirdly, the work provides a quantitative analysis of the company using the various valuation techniques (discounted cash flow analysis with diverse assumptions, the real options method). Finally, the results of the analysis are discussed.
1.2 Problem Statement
The main goal of this thesis is to present the Real Option Valuation (henceforth ROV) method and apply it to the case of a start-up as well as to show that this method offers a reasonable alternative to traditional valuation methods for the case of high tech companies. In order to achieve this goal, the theory behind the traditional valuation methods, including the limitations of these in case of high tech companies is discussed. This first step already sheds light on the problems that traditional valuation methods encounter when applied to start-ups. Subsequently, the thesis presents the alternative offered by Real Option Valuation methods, and both techniques are applied to a case of a high tech start-up. In the latter step, it is presented how the traditional valuation methods such as DCF exhibit weaknesses when the company in question has a non-conservative financing structure. As is shown, the problems arising from the DCF become even more severe whenever the company does not provide full accounting information about its financing sources. The lack of reliability of data as well as a nonstandard capital structure of the company is shown to result in a non-trustworthy DCF valuation. This work also shows how ROV can become handy in such a situation.
1.3 Synopsis of the goals
This thesis has six key goals:
Describe in an exhaustive way, the valuation methods which are used in practice,
Show the limitations of the traditional valuation methods for valuing high technology start-ups,
Describe the Real Option Valuation methodology, with a particular emphasis on its applicability for high tech companies,
Use both valuation methods in a practical case study of a start-up,
Compare and analyze the results of different valuation methods as well as formulate conclusions about the practical applicability of diverse methods for valuation of start-ups, Show the possible different implications for strategic decisions of DCF and ROV.
1.4 Fixing the boundaries
The interpretation of the results of this study is not limited to the companies operating in high tech industries only. The results will be applicable to the cases of companies for which the main
asset is intellectual property and which are in early stages of development such as in IT industries, innovative internet platforms and others.
This work will not focus on all special applications of the Real Options method. In particular, it will provide a method which allows us to value this specific case study. Furthermore, this thesis will not focus on in depth discussion of Black-Scholes or binomial trees, but on practical application of these.
1.5 Target Audience
This work is aimed to shed new light on corporate valuation of companies with intellectual property assets. It is targeted at scholars who work in the field of corporate valuation, in particular in young industries. Moreover, it could be an interesting point of reference for practitioners (e.g. young entrepreneurs) who seek information about valuation of their companies as well as venture capitalists and public authorities who provide subsidies and need information about the performance of the ventures.
1.6 Data Collection
The necessary data has been gathered mostly from the balance sheets and income statements of the Phoenics Creative Studio1. Moreover, the owners of the analyzed company provide forecasts of the company's performance prepared for internal use. Data provided by these forecasts will also be used – after revision. Some methods of evaluation such as the real option method require knowledge of the financial and macroeconomic indices of the economy such as risk free interest rates. These have been gathered from various public data sources including the OECD database, the ECB database, the database of the IMF as well as the National Statistical Office of the Republic of Austria.
Regarding market forecasts the main sources of data are Gewista, for the Austrian market, Fachverband Außenwerbung e.v (FAW) for the German and Magnaglobal for worldwide industry outlooks.
Gewista is the biggest Austrian out-of-home advertising company held by the French multinational advertizing company JCDecaux (JCD). Due to its former public ownership it is still the most reliable source regarding advertizing in Austria. FAW is a German association members
of which are nearly all German companies in the out-of-home advertizing industry. Its main aim is to connect, consult and promote all members of the industry all over Germany. Magnaglobal is a New York based Investment company. Their main focus is on investments in the media industry and they provide a yearly overview of the industry. For the comparison with the biggest competitors, JCD and Stroehr, their websites and annual reports have been consulted.
As this work is a case study, it is based on data provided by a single entity. Data will comprise their balance sheets and income statements since 2008 as well as forecasts of these for the next five years.
As it is suspected that these forecasts have been prepared under different circumstances than current, they will be revised jointly with the CEO of the company.
2 Valuation Theory
2.1 Introduction
The purpose of this chapter is to provide a theoretical framework on which further analysis will be based. Diverse approaches to calculating the value of the company are presented. Furthermore, this chapter describes the advantages and disadvantages of these core valuation techniques. Additionally, for every valuation technique, it is discussed, if or how it can used for the specific problem given.
One can group the valuation methods into three categories: Entire approaches, which take into consideration the overall situation of the firm, single approaches which concentrate only on one aspect of the firm e.g. its liquidation value and other methods which include mixed methods, real options and other. The first group of approaches comprises several aspects of the overall company picture: the assets, growth potential, future earnings, the position in the market and so on. On the other hand, the second group concentrates only on the current condition of the firm, by analyzing solely the balance sheets. The overview of the basic methods is presented in Figure 1. Of course, the list is not complete, but rather serves as an overview of the methods available and their basic features for the purpose of explaining the shortcomings of traditional valuation methods when applied to high tech companies.
Source: own work based on Koller et al. (2010)
2.2 Brief description of basic traditional methods
The following description is just an overview of some specifically selected valuation methods. The purpose of this chapter is not to show all possible valuation techniques but only to summariye the most relevant ones. The description of the DCF method, its limitations and
extensions is based on Brealey et al. (2011) and Mun (2006), unless otherwise stated. 2.2.1 Discounted Cash Flow Methods
The basic idea behind the discounted cash flow methods is to value a project or a company using the time value of money and recognizing the asset’s risk. Most generally the future cash flows are estimated and discounted back to obtain their present values. The value of the company is therefore the sum of discounted future cash flows. As this method is by far the one mostly used in business practice it will be described in full detail. Moreover, the purpose of the detailed presentation is to show the limitations of the DCF method for valuing start-up high tech firms, as
well as in order to present the benchmark valuation technique which is then to be compared with the real options valuation.
Discounted Cash Flow methods always require four steps:
1) Forecast of future revenues, which in turn determine other key financial statements.
2) Forecast of Cash Flows: either Free Cash Flows in the entity methods or Equity Cash Flows in the Flow-To-Equity method described in detail below.
3) Determine the discount rate.
4) Calculate the intrinsic value of the company.
Each of the steps is explained in more detail in the following sections.
2.2.1.1 Forecast of future revenues
First step of the analysis involves estimation of future revenues. The choice of methods to do so is very broad and includes both ‘soft’ methods as well as econometric techniques; in fact it usually requires the simultaneous use of both. One needs to start with estimation of the forecasting period. These may vary according to growth features of the industry as well as characteristics of the company in question. In the next step one has to consider what factors will affect future earnings such as historical growth, market share, macroeconomic situation, behavior of the competitors and so on. Combining the manager’s intuition and internal knowledge with relevant econometric techniques, should allow estimation of the future revenue. Among econometric techniques one should consider models which incorporate historical data with market growth such as autoregressive models including market features as explanatory variables.
2.2.1.2 Calculation of Free Cash Flows to the firm (FCF)
The basic formula for calculation of FCF is
FCFF = EBIT * (1-r)+DEPR-CAPEX-∆NWC, (1)
where EBIT stands for Earnings before interest and taxes, r for the corporate tax rate, DEPR for depreciation and amortization, CAPEX for capital expenditures and ∆NWC for the increase in the net working capital. Instead of EBIT one can use the formula including the net profit, which is
FCFF=Net Profit + INT-CAPEX-∆NWC-TaxINT, (2) where INT stands for interest expense and TaxINT is the tax shield on the interest expense.
2.2.1.3 Calculation of Free Cash Flow to Equity
Similarly to the Free Cash Flows to the firm one can calculate the Free Cash Flow to Equity (FCFE) as a basis for the discounted cash flow analysis. FCFE is calculated as follows:
FCFE=Net Income-CAPEX-∆NWC+(NewDEBT-DEBTRepay), (3) where NewDEBT is the new debt issued and DEBTRepay are debt repayments.
2.2.1.4 Terminal Value
An additional aspect that has to be taken into consideration is that it is not possible to estimate the cash flows forever, therefore it is necessary to impose a closure in the DCF calculation, by stopping the estimation of the cash flows at some point in the future and finding a terminal value that reflects the value of the firm at that point. There are three basic methods of finding the terminal value, and shall be described them in turn (Allman, 2010).
If it is reasonable to assume that the firm will cease operations at some point in the future, or that there are no expected cash flows beyond a certain point terminal value can be found as a liquidation value of the firm's assets. The liquidation value methodology will be discussed in more detail in Section 2.4.1. The second possibility to calculate the terminal value is to use the multiples approach which is described in Section 2.3
The third commonly used method is the stable growth approach (the Gordon Growth Model). In this approach one assumes that the cash flows continue into perpetuity in the future and grow at a constant rate (it is possible to assume a non-constant growth here only the basic version of the model is described). The formula for calculation of the terminal value is
,
(4)where the Cash Flow in period T is the last estimate of the cash flow for the forecasting period; note that depending on the method used it will be either FCF or FCFE. k denotes the assumed discount rate (e.g. the weighted average cost of capital for the WACC approach) and g is the assumed stable growth rate of cash flows. This formula heavily relies on the assumption that the cash flow in the last projected year will stabilize and continue growing at the same rate forever, therefore for certain market situations and individual firm conditions it might not be reasonable to use this approach.
2.2.1.5 Discount rate
Discount rate or the cost of capital refers to the opportunity cost of making a specific investment. It is the rate of return that could have been earned by putting the same money into a different investment with equal risk. Thus, the cost of capital is the rate of return required to persuade the investor to make a given investment. In other words it is the required rate of return of the debt and equity holders. The fact that it is the rate that could have been earned from a different investment is the reason for which it is used as discount rate in the DCF methods. It reflects the standard discounting concept explaining the time value of money known from other financial applications: it is the rate of return that providers of capital demand to compensate them for both the time value of their money, and risk (Kruschwitz and Loeffler, 2005).
When it comes to choosing the discount rate there are many possibilities. Still, this step is crucial, as small changes in the discount rate generate big changes in the estimated discounted cash flows. The choice of the discount rate also determines the method that one actually uses. For the FCFF method one discounts with the weighted average cost of capital, whereas in the adjusted present value (APV) method the discount factor is the unlevered cost of equity.
2.2.1.5.1 Weighted Average Cost of Capital (WACC) Approach
The most appropriate rate for discounting future cash flows to the firm is the weighted average cost of capital, which captures the rate at which a company is expected to finance all its assets. Usually it comprises the cost of equity and the after-tax cost of debt with relevant weights stemming from the capital structure of the firm. Since in practice companies finance their assets from many different sources, it may include not only common equity and straight debt, but also diverse kinds of debt such as convertible and exchangeable bonds, warrants, options, subsidies and so on. In the simplest form, the WACC formula comprises the cost of equity and the cost of debt.
2.2.1.5.2 Calculation of the Cost of Equity
Cost of equity captures the return that a firm is supposed to pay to its equity investors. Unlike the cost of debt, which is usually a set interest rate, the cost of equity is not fixed, but simply has to reflect the additional risk that the investors have to bear in order to invest in the firm. That is the
cost of equity has to be estimated using the relation of the firm to the market as well as other components such as e.g. prediction of future dividends.
The most common way to find the cost of equity is to use capital asset pricing model (CAPM) in which
(5)
where Rf is the risk-free rate, usually taken to be interest on long term stable bonds (e.g. 10 year government bonds), β is the measure of how a company's share price moves against the market as a whole, and the term inside the brackets is the Equity Market Risk Premium which represent the returns that the investors expect over the risk-free rate or in other words the difference between the risk-free rate and the market rate. The beta coefficient is found using the following formula:
(6)
where ra is the rate of return on the asset and rb is the rate of return of the benchmark asset (for
listed firms typically a stock market index). For listed firms, the choice of the rates of return used for calculation of the beta coefficient is usually straightforward, whereas in the case of a start-up as the one in question in this work, the problem of choosing the relevant rates of return is a more sophisticated one Section 5.2.1.1.1 returns to describing the estimation strategy in this particular case.
2.2.1.5.3 Calculation of the Cost of Debt
The cost of debt is fairly straightforward to find. The rate to apply should be the current market rate the company is paying on its debt. Most commonly this should be the rate on a risk free bond whose duration matches the term structure of the corporate debt plus the default premium. Additionally to obtain the rate which is easily comparable with the cost of equity, the cost of debt should be calculated as an after tax cost. The formula is therefore
(7) where r stands as before for the corporate tax rate. In practice one can approximate the cost of debt with yield to maturity of a bond with correctly chosen duration.
In the absence of recent debt issues and publicly traded debt, another method of estimating the cost of debt is simply through its accounting system. This is done by dividing capital expenditures of the income statement through net debt from the balance sheets.
2.2.1.5.4 Calculation of WACC
Finally, WACC is the weighted average of the cost of equity and the cost of debt based on the proportion of each component in the capital structure of the firm. The formula is, therefore
(8)
where E is the market value of the equity and D is the market value of the debt of the firm.
Finally, the present value of the firm using the WACC approach is found according to the following formula:
,
(9)whereas the Terminal Value is normally given by
.
(10)2.2.1.6 Adjusted Present Value (APV)
In the APV approach one begins with the value of the firm without debt. As one adds debt to the firm, the net effect on value by including both the benefits and costs of borrowing is considered. Therefore, one considers primarily the tax benefit of borrowing and the increased risk of bankruptcy as a main cost. In this method one determines the levered value of a company by first calculating its unlevered value and then adding the value of the interest tax shield. The formula is therefore
(11) where VU stands for the unlevered value of the company. The first step is to find the unlevered value of the firm. It is done by calculating the value of the free cash flows using the project’s cost of capital as if it were financed without leverage. In order to correctly discount the cash flows, it is necessary to find the unlevered cost of capital. For firms that adjust their debt to maintain a target leverage ratio, it can be simply found as a pretax WACC. Therefore, the formula for the
unlevered cost of capital will be the same as the WACC formula above, with the sole difference that the cost of debt is not multiplied by the (1-r) component:
(12)
where
(13)
and RP stands for the risk premium.
Alternatively, one can find the unlevered cost of capital using the unlevered beta coefficient of the firm. The unlevered beta coefficient is found according to the following formula:
, (14)
and use the formula
. (15)
The second step is to find the tax shield, which is simply the interest paid on debt times the marginal corporate tax rate, thus
. (16)
2.2.1.7 Equity Approach
In the equity approach (“Flow-To-Equity Method”), the cash flows to equity are discounted at the cost of equity. As introduced above, it is a valuation method that calculates the free cash flow available to equity holders taking into account all payments to and from debt holders. In other words, the free cash flow that remains after adjusting for interest payments, debt issuance and debt repayments. The exact formula of calculation of cash flow to equity has already been presented in (3). The value of the equity (also called shareholder value, SV) is then calculated by discounting these cash flows with the required rate of return on equity instead of the WACC.
2.2.1.8 Comparison of the Methods
The three apporaches to DCF valuation have certain aspects in common and some which differentiate them. However, eventually they result in the same valuation.
The obvious similarities lie in the proess of valuation itself. The process of valuation starts with predicting future cash flows for a given timeframe, determining a terminal value and, eventually, calculating the cost of financing.
The specific company under scrutiny eventually determines which approach is the best in the given situation. Comparing the FCFF as an entity approach with FCFE approach shows how the two differ. The first major difference is that instead of the FCFF in the FCFF approach one uses the Cash Flow to Equity for the FCFE valuation. The second difference is that one uses the required rate of return of shareholders in the FCFE method instead of the WACC. Nevertheless, one can consider both methods very similar.
In many cases, however, especially for the case of young companies, the capital structure or the tax rates change over time. In nearly all european countries a special tax or cash incentives are given to young companies. These influence the WACC in an obvious way. In most of these situations it is easier to use the APV method instead of the FCFF approach to value the company.
2.2.1.9 Limitations of the DCF methods
Discounted Cash Flow methods while being relatively simple to implement and widely accepted, have several shortcomings, which make them less useful for modern project and company valuation. The practical problems with DCF include undervaluing assets which currently produce little or no cash flow, the estimation of an asset’s economic life, forecast errors in creating the future cash flows and the non-constant nature of the weighted average cost of capital discount rate through time. Moreover, even if one is able to overcome the issues discussed above, several of the assumptions of DCF do not correspond to the reality of strategic decisions under uncertainty. Let us discuss some of the disadvantages of DCF as compared to the Real Options Approach. First of all, DCF assumes that strategic decisions are made now, and they decisively determine the future cash flows. In reality, future outcomes are uncertain and variable. Moreover, not all decisions are made today; some may be deferred to the future, once the uncertainty becomes resolved. Secondly, DCF assumes no active management throughout the course of the
project, whereas projects are usually actively managed through life cycles of products, budget constraints and so on. Thirdly, DCF assumes that future free cash flows are highly deterministic and predictable. This assumption, while sometimes being a useful simplification in mature industries, cannot be reliably applied in most market situations in which uncertainty plays a role. In reality, it might be difficult to credibly estimate future cash flows, as they are in nature stochastic and risky.
A huge disadvantage of DCF is the fact that this valuation method assumes that all risks and factors affecting the outcome of the project and value of it to the investors are completely accounted for. DCF assumes that the NPV perfectly reflects all the important aspects of the project and that the discount rate captures all the potential risks. In reality, one cannot asses the future risk, only by looking at the current discount rate, as risks may change during the course of the project. Moreover, for project of high complexity, or those which involve externalities or network effects it might be difficult or impossible to quantify all factors in terms of cash flows. Unplanned outcomes might be of high strategic importance. Last but not least, classical DCF completely neglects intangible assets and immeasurable factors, which are in turn valued at zero. In reality, and of great importance for emerging industries, intangible assets might play a huge role in project valuation.
As the major drawbacks of the DCF method have been recognized, this chapter continues with description of a few methods that help ease these faults. Scenario analysis and Monte-Carlo simulation are not valuation methods per se, but serve as an extension to the valuation obtained by DCF.
2.2.2 Scenario analysis
Normally, in a scenario analysis there are three different underlying scenarios which in sum aggregate to the final value of the investment. These three scenarios are: best case, worst case and the most probable case. Each of them is related to different assumptions in the DCF model. Additionally each of these scenarios is assigned a probability of occurring. In sum the NPV of the project is the average of the scenarios weighted by the probabilities.
This model is widely used in practice together with the DCF method. It is, however, also not free of problems. Scenario analysis boils down to expressing cash flows in terms of key project variables and then calculating the consequences of misestimating the variables. It forces
the manager to identify the underlying variables, indicates where additional information would be most useful, and helps to expose inappropriate forecasts. One drawback to scenario analysis is that it may give somewhat ambiguous results. For example, what exactly does optimistic or
pessimistic mean (Brealey et al. 2011)? Moreover, a manager must be able to identify exactly the
key variables or consistent combinations of these, which produce each scenario. If the market situation is complicated and involves many factors, it might be very difficult to determine which exact variables influence the final outcome of the valuation.
2.2.3 Monte-Carlo Simulation
Sensitivity analysis, which is a standard tool in finance, allows the manager to consider the effect of changing one variable at a time. By looking at the project under alternative scenarios, you can consider the effect of a limited number of plausible combinations of variables. Monte Carlo simulation is a tool for considering all possible combinations. It therefore enables inspection of the entire distribution of project outcomes (Brealey, 2011). In this, it should be seen as a further extension of the classical scenario analysis, which allows for a higher level of computational complexity. Moreover, Monte-Carlo simulation allows for incorporating not only uncertainty of individual variables, but also any kind of correlations between the key variables that influence the NPV of the company or project.
As in the traditional sensitivity analysis, the key step is to identify the variables which are heavily affected by uncertainty and their impact on the final valuation. Next, one needs to estimate the distributions of these variables, using the knowledge about market conditions or statistical methods. For example, normal distribution might be a reasonable assumption for the beta coefficients, whereas sales might rather follow a triangular distribution. The choice of the distributions of parameters as well as correlations between them is a task that requires deep knowledge of the market as well as of the mathematical background on the side of the manager. Having identified the necessary assumptions, the simulation task itself is simple, and can be implemented with appropriate software (such as the well-known Risk software). A big advantage of the Monte-Carlo method is, that given current computational power, even the most complicated scenarios can be evaluated within seconds. After the distribution of NPV has been found for the combination of input variables, it allows also estimating probabilities of certain
events e.g. the probability and borderline values of variables for which the company becomes unprofitable.
2.3 Comparison Analysis
2.3.1 Comparable Companies Analysis
Comparable companies analysis (CCA) is a method of estimating the value of a company (or a single asset) by comparing it to the values assessed by the market for similar companies (assets). In the first step one has to choose a sample of comparable companies (‘’the peer group’’), with regard to several factors: the industry in which they operate, their business model, geographic location, accounting policies, capital structure, size and others. This step of the analysis can be performed either using ‘soft’ methods or econometric techniques such as correlation analysis, simple regression analysis or propensity score matching. In the second step one needs to estimate the relation of the company in question to the selected comparable entities, to be able to obtain reasonable comparison basis. In this, multiples are found. That is, one needs to find the market values of compared firms and relate them to some key financial items. The most common multiples are relating the market value of the compared firm with EBIT (earnings before interest and taxes), Free Cash Flows, Operating FCF and Net Operating Profit. In the last step of the analysis one applies the multiples obtained for the peer group firms to key financial statements of the firm in question and calculates the market value of the firm (Meitner, 2006).
2.3.2 Comparable Transactions Analysis
Comparable transactions method (CTA) is often used for valuing companies for mergers or acquisitions. One looks at transactions that have taken place in the industry that are in some ways similar to the transaction under consideration. Similarly to the method above one needs to distinguish a key parameter for valuation and obtain multiples of the key considered factors, and afterwards use the multiples to find the value of the company in question. However, CTA cannot be considered a valuation method itself, as it is rather relying on past valuations of other entities. Nevertheless, it is worth mentioning in the context of this work as it is often used as a benchmark for valuation of young companies.
As the name suggests, in the CTA, one looks at transactions that have taken place in the industry that are in some ways similar to the transaction under consideration. Similarly to the
CCA method one needs to distinguish a key parameter for valuation and obtain multiples of the key considered factors, and afterwards use the multiples to find the value of the company in question. The key challenge is, therefore to find the correct multiples for the valuation. If a start-up or young company provides a completely unique service or product this might be a difficult task. On the other hand, multiples can be safely applied in cases in which similar companies have been sold for instance in different countries. This method can be a useful tool to analyze young companies with the mentioned restrictions. Furthermore and this is the reason why it will not be applied here, it is usually either very difficult or very expensive to obtain data about past transactions.
2.4 Single Valuation Approaches 2.4.1 Liquidation Value Approach
Liquidation value is obtained as a value that would be received if the company actually sold all of its assets and paid all its liabilities. This method provides a useful benchmark of the lowest value of the company, since in practice the liquidation value will be lower than fair market value, as owners on the brink of bankruptcy may be forced to sell the assets below their fair price (Hitchner, 2011). Moreover, the method does not take into consideration intangible assets, which at least for some industries (as for example in the company analyzed in this work) have much higher value than the sum of tangibles. Although it is very simple to implement, the method does not capture the earning potential of the company’s business e.g. for the case of start-ups. On the other hand, unprofitable companies may be worth more as a sum of the tangibles than when being operational.
2.4.2 Replacement Cost Approach
The idea of this method is to find the value of the company by estimating the cost of reproducing all the company’s assets. Originally used in property valuation and insurance, it can be applied to corporate valuation as well. In the first step of the analysis one splits the company into parts that can be separately valued. For each object the question to answer is what the cost of replicating each object belonging to the company’s value is (Fernandez, 2007). As it is often considered in current market prices, without allowing for depreciation, the overall valuation might exceed the book value. Therefore, a contrario to liquidation value the method tends to overstate the value of
tangible assets. Additional critiques are the same as in the previous case: the method is, therefore not appropriate for valuation of start-up companies, particularly in high tech markets.
The third group, thus other methods of valuation including the real options approach will be described in more detail in Chapter 3.
2.5 Applicability of valuation methods to high tech start-ups 2.5.1 High Growth Features of Valuation
In order to determine specific issues relevant for the valuation of high growth ventures it has to be determined in advance what makes it so special. When talking about high growth ventures one normally assumes the following circumstances (Achleitner and Nathusius, 2004):
High degree of innovation Short corporate history Scarce resources
High value of intangible assets High need for flexibility High risk but also high chance
Due to these specifications some requirements for valuation methods for ventures can be determined.
Firstly, they have to be oriented towards the future. As there is a short corporate history, it does not seem reasonable to value the corporation on the basis of its historic data.
Secondly, an adequate picture of the company has to be shown, one which takes into account the high value of intangible assets, the opportunity of flexible decision making, but also high chances and risks. This requirement shows a major difference to all other valuation methods, as it concentrates on the major differences between ventures and mature companies.
Thirdly, practicability has to be mentioned. As there is normally little or no historic data available it is hard to reflect the whole company’s picture within a valuation model. To avoid major valuation mistakes, all data used should be valid and as such within certain quality criteria. In addition, the valuation should not exceed a certain level of complexity in order to assure certain usability.
2.5.2 Discounted Cash Flow
DCF methods may serve to value high-tech start-ups under certain conditions. The overview of what has to be taken into account when carrying out the valuation of a young company with DCF is presented below (based on Achleitner and Nathusius, 2004).
DCF methods are by definition future-oriented. In this, they can only be applied to a start-up if one can forecast the future cash flows with a reasonable degree of precision. This task can be particularly difficult for the case of high-tech start-ups, which by definition operate in new markets.
It is particularly difficult to adequately estimate the intangible assets of a young company, which are in most cases the most important component of a start-up's assets. The problem becomes even more severe if the company owns assets which do not generate cash flows, but are nevertheless valuable.
Moreover, according to Achleitner and Nathusius (2004), calculation of beta and in the next step the required rate of return of the investors can be problematic. For the calculation of the beta parameter, the obvious problem is that most start-ups or young companies are not publicly listed. Furthermore, industry averages are normally not plausible, since a young company can hardly be compared to a mature one. Achleitner and Nathisius (2004) suggest using an accounting beta in such situations. This solution is unfortunately also not free of faults. Whereas, one can usually use historical data for mature companies, one needs to rely on mainly subjective judgments for young ones.
An additional important critique of DCF methods for the case of high-tech start-ups has been provided by Steffens and Douglas (2007), who claim that the main problem associated with the DCF discounted with the WACC is that most of the risk in young companies is firm-specific, rather than systematic. The WACC method deals only with the market component of risk. For this technique, the accepted way to adjust discount rates for risk is to find an analogous traded entity (or portfolio of traded entities) – immediately implying a market-related risk. Moreover, if the CAPM, is used to determine the appropriate discount rate, no penalty is applied for specific risks, because in this approach the risk can be fully diversified. Authors argue that the high levels of risk associated with technology ventures are largely due to firm-specific risk, and that these should attract a risk penalty. However, if the firm specific risk can be considered low, the CAPM and the WACC can be used in practice. This is usually the case for companies which already exist for a given time, but for instance develop a new entrepreneurial project.
Although, the Cash Flow based methods are widely criticized, not only for the case of young companies, their main advantage is that they are still fully accepted and used in practice. Within the different concepts of cash flow based valuation methods the widest used is the FCFF.
Summarizing, if all challenges can be mastered, the DCF methods can be an appropriate way of valuating start-up companies. Despite some drawbacks, the fact that the methodology is easily explainable to everyone and widely accepted is in favor of this approach.
2.5.3 Venture Capital Method
The venture capital method (also known as the First Chicago method) is, as the name suggests, used for valuation of start-ups. It can be seen as a combination of scenario analysis applied to DCF and valuation by multiples.
This method is often used by investors to value growth companies, since these often cannot be credibly valued solely on the base of multiples, as they lack historic data. On the other hand, it eases the above mentioned problems with DCF applied to high-tech start-ups.
This valuation method pays special attention to the practical fact crucial for the venture capital industry: the exit. Typically, venture capital funds aim to be able to exit the position within 5 years. The method assumes that after this pre-specified timeframe the company behaves like a mature one and can also be valued with traditional valuation methods.
In particular, the method specifies several alternative exit scenarios for the venture. Typically, three scenarios are used: the ‘best guess’ (most likely, median case); the ‘best case’ (optimistic) and the ‘worst case’ (pessimistic). For each of the three exit scenarios, management must estimate the (subjective) probability that the scenario will occur, and the cash flows for each scenario are estimated exactly as in the FCFF method. The final valuation is then the weighted probability of each scenario (Steffens and Douglas, 2007) and discounted with a pre-determined required rate of return. Comparing the discounted value with the investment needed leads to the stake sold for the amount needed.
The advantage of this approach is that some of the risks associated with the venture are explicitly identified and different types of risk are separated and explicitly assessed. An important consequence of dealing with many sources of risk explicitly is a reduction in the sensitivity of the valuation to the discount rate which makes the approach more realistic for young companies. On the other hand, as noticed by Steffens and Douglas (2007) it does not allow for future managerial flexibility. The Venture Capital method is most appropriate when an investment decision of a start-up is dominated by an initial investment, with no or little subsequent investment discretion, since this approach, similarly to standard DCF does not allow for any flexibility. This is not the type of investment regime usually facing technology investments, which typically commence with relatively small outlays, followed by increasingly large successive investment decisions. Thus, the approach is suitable for some incremental innovations, involving a single initial technology investment (such as a web site development for a new market opportunity) that subsequently faces primarily market risks.
2.5.4 Patent Valuation Methods
Since most young companies are not based on significant amounts of tangible assets, evaluating their intangible assets is a crucial point within the overall valuation process.
In valuing a patent, the fundamental issue is by how much the returns from all possible modes of exploitation of the patented invention are greater than those that would be obtained in the absence of the patent. Moreover, in the early life of the patent, many uncertainties are involved. There are uncertainties regarding the technological or commercial success in markets as well as legal aspects that may arise during the life of the patent.
When valuing patents it can clearly be seen that the system of valuation is the same as for companies. As patents are associated with a clear goal, which is to protect intellectual property, the requirements for valuation methods need to answer this goal, and the chosen valuation method must fulfill it in the best possible way.
With regard to order of sophistication, patent valuation methods may be ordered and briefly described as follows (Pitkehly, 1997):
1.) Cost based methods: Knowledge of at least the future costs of creating intellectual property rights (IPR) is needed as part of almost all valuation methods. The most serious shortcoming of cost based methods is that they make no allowance for the future benefits which might accrue from the patent. They are of no help other than in historical cost based accounting systems.
2.) Market based methods: The aim of market based methods is to value assets by studying the prices of comparable assets which have been traded in an active market. The main problem associated with these methods is that unless the cost considered reflects a very similar IPR in a recent transaction, the prices are not comparable. A patent, by definition specifies a product which is by its nature unique; comparison of prices even within the same market is difficult.
3.) DCF based methods: Discounted Cash Flow methods, as already introduced, are widely used in diverse applications. The advantages and limitations of DCF methods in general have already been described. In particular, for the case of patents, one advantage is that since patents have limited lifetimes one is not faced with the problem of estimating scrap values for the cash flows beyond the forecasting horizon. The limitations of DCF include the problem with estimating correct discount rates. Firstly the discount rate used should always be the one which reflects the risk of the cash flow concerned. For example if the project is not an average project for the company this will not be the same as the company's cost of capital. Secondly, with a multi-stage cash flow such as with a patent or patent application the risk associated with the cash flow will vary considerably over the lifetime of the investment in a patent.
4.) DTA (Decision Tree Analysis) based methods: These methods to some extent account for the possibility for flexibility of the management in decision-making at different stages of the life of the patent. In practice, one prepares a decision tree and applies DCF to every
branch of it. Therefore, the big advantage of the DTA method over simple DCF analysis is that it builds on the value of flexibility encountered in a project or patent. This allows at least some account to be taken of the ability to abandon the patent though it does not solve the discount rate problem. The rates used ought to be appropriate to the risk involved at each stage and following each type of decision, whilst in practice a constant rate is usually used (Pitkehly, 1997).
5.) Real options based methods: Since real options method constitutes the core of this work, the aspects of real options valuation of patents are discussed in the following chapter.
3 Real Options Approach
In the previous chapters various methods of corporate valuation have been presented. As the aim of this work is to highlight a specific one, this part is dedicated solely to the Real Options approach. This part of the thesis starts by introducing the idea of a real option and give an overview of the current literature. Subsequently, different kinds of real options are shown and it is described how to value them.
3.1 Introduction
Based on Black and Scholes (1973) and Merton (1973), Myers (1987) came up with the idea of a “real option”, as the right but not the obligation to purchase a real asset. The underlying idea is that the model allows substantial upside potential while the potential loss is limited. Obviously, this idea was a breakthrough in bridging the gap between finance and strategy.
An option is a contract which gives the owner the right, but not the obligation to buy or sell a specific asset or financial instrument at a specific price in the future. That is, the long holder pays the premium to the seller (the short holder) to exercise this right. An option which conveys the right to buy is called a call, whereas if it allows the long holder to sell the asset it is a called a put. Additionally one needs to distinguish between different styles of options, as far as the time at which the right can be exercised is concerned. The two most common styles of options are European and American options. The former may be exercised only at the pre-specified expiration date of the contract, whereas the latter can be exercised at any time before the expiration date. However, there exist many other styles of options. The two described are not only the most commonly used, but also the most often encountered in real options analysis.
Markets nowadays require important strategic investment decisions to be made in uncertain environments, in which market growth, competitor moves or costs of development may be unknown or difficult to assess. As already mentioned, the classical methods of valuation require tools relying on forecasts of future cash flows, which often do not reflect the immanent uncertainty. The second already mentioned problem is that the decisions about undertaking a particular project are taken once and for all - DCF does not allow for recapitulation at a later stage.
The real options approach allows us to explicitly include uncertainty in the decision-making process. Unlike the traditional view, in which increasing uncertainty reduces the value of the project, the real options approach considers uncertainty as increasing managerial flexibility, and thus creating value.
Moreover, as already mentioned the traditional discounted cash flow approach assumes a single decision pathway with fixed outcomes, and that all decisions are made in the beginning, thus not allowing for any managerial flexibility. The real options approach considers multiple decision pathways as a consequence of uncertainty in choosing optimal strategies or options along the way when new information becomes available (Mun, 2006). This flexibility can be summarized by considering several examples of real options:
Option to abandon, Option to wait and see, Option to expand,
Option to switch resources,
Option for sequential investments.
Each of these examples reflects a decision that a manager may take during the course of the project, and which can alter its value. The value of each of these options can subsequently be calculated in a way that is similar to that which is used to value financial options.
3.2 Literature about Real Options
In recent years, R&D and intellectual property have been a major focus in the real options literature (Childs and Triantis (1999), Huchzermeier and Loch (2011) and others). Even more recently, several authors have adopted the real options approach in an attempt to analyze and evaluate intellectual capital of firms (see Kossovsky (2002), Bose and Oh (2003)). Kossovsky (2002) valued nearly 8000 intellectual property assets using the real-options model. He showed how R&D real options could be studied with respect to financial reporting and how they could be incorporated in intellectual capital analysis. In his analysis, however, all options were European options, all model parameters were constant over the life of the option and the analysis did not incorporate the effect of market competition into the real-options valuation of the intellectual property assets.
Myers (1987) was the first to point out that adopting DCF is no help at all for pure research and development. The value of R&D is almost entirely option value. Numerous academics and practicing managers now recognize that traditional financial analysis tools for capital budgeting are inadequate, such as the NPV rule and the DCF approaches (see Ming-Cheng and Tseng (2006) for a more detailed discussion).
The real-options approach gains attention for evaluation of R&D projects and intangible assets both for business academics and practitioners. For example, Merck’s Finance Group used the Black Scholes option pricing model to determine the R&D value of an investment project which required an up-front investment of $2 million for researching a bio-technological drug. The Chief Financial Officer (CFO) of Merck, Judy Lewent, once said, ‘Option analysis, like the kind used to value stock options, provides a more flexible approach to valuing our research investments than traditional financial analysis’ (Nichols, 1994).
A prominent case study showing the strength of ROV is provided by Leslie and Michaels (1997) who analyze investment decisions of British Petroleum. The authors analyze the discovery of Andrew oilfield in 1974, which was not developed until the mid 1990s when BP developed innovative drilling methods and sharing of costs and benefits with other companies in the industry. In effect, BP bought an out-of-the-money option to develop the Andrew field, deferred exercising the option until the company had proactively driven down the exercise price, and then exercised an option that it had turned into an in-the-money one (Leslie and Michaels, 1997).
Another practical example of the option approach in R&D project valuation is given by Herath and Park (1999). The authors develop a valuation model based on a binomial option pricing model and apply it to Gillete's MACH3 project to illustrate how one can use the options approach rather than the traditional DCF model to value an R&D investment. They show the advantages of the option approach over the traditional NPV valuations for evaluating projects involving high degrees of uncertainty. Moreover, they demonstrate how valuations can be linked to a company's stock price.
More recently, advantages of the ROV have been analyzed in the context of IT investments case studies. Benaroch and Kaufmann (1999) analyze investment decision of Yankee 24 – a company operating automatic teller machines. Taudes et al. (2000) describe a real—life
case study where option pricing models were used to decide whether to continue employing SAP R/2 or to switch to SAP R/3.
In the particular context of patents, recent studies demonstrate that patent value can be evaluated through a real option approach. Bloom and Van Reenen (2002) analyze 200 British firms since 1968 and show that patents have a significant impact on firm-level productivity and market value. Most importantly, they find that patenting affects the market value immediately whereas it appears to have a lagged effect on productivity, which leads to a conclusion that a patent creates a valuable real option, while providing exclusive rights to develop innovations, enabling firms to delay investments.
Laxman and Aggarwal (2003) value a real 3G-telecom patent of Sasken Communication Technologies. Sasken has come out with a 3G protocol, that allows 3G transmission/reception. However, this technology will be used in practice, only if it gets included in the comprehensive 3G standard by the world body 3GPP, which is a low chance because of the many contestants in the market. If it does get included in the standard, Sasken will get royalties for each 3G handset sold anywhere in the world for the next few years, until someone comes up with an improvement and the standard is upgraded to better technology. Applying the real option framework to value this patent application, the authors recommend the filing of the provisional patent since the expected value of Sasken`s provisional patent far outweighs the cost (Laxman and Aggarwal, 2003).
Ming-Cheng and Tseng (2006) develop a model of patent valuation with ROV and present a sensitivity analysis showing the relationships that exist between the patent value and the underlying asset, time to maturity, volatility and risk-free rate. Furthermore, panel data involving 101 Taiwanese listed firms in electronic industry for 1993–2002 was presented to examine the above relationships. The empirical results indicated that the patent value increases in the underlying asset, time to maturity and the risk-free rate (Ming-Chen and Tseng (2006), pp. 317).
3.3 Types of Options
Copeland and Keenan (1998) present a comprehensive overview of the types of real options and suggest classifying them into three categories from the managerial point of view. The classification is presented in Figure 2.
Source: Own work
According to this classification 'a growth option' allows a company to secure profits if the market conditions happen to be better than expected. This can be accomplished by reinvesting the capital, expanding the scale of production or entering new market sectors. Additional sources of the growth options comprise R&D and innovation, intellectual property and change in the market position.