KRAIN SANTOS DE MELO
Efeito agudo da reintrodução de carboidratos sobre a composição corporal avaliada por absortometria de raios-x de dupla energia (DXA)
KRAIN SANTOS DE MELO
Efeito agudo da reintrodução de carboidratos sobre a composição corporal avaliada por absortometria de raios-x de dupla energia (DXA)
Dissertação apresentada ao Programa de Pós-Graduação em Ciências e Tecnologias em Saúde da Universidade de Brasília para a obtenção do título de Mestre.
Orientador: Dr. Alexis Fonseca Welker.
Efeito agudo da reintrodução de carboidratos sobre a composição corporal avaliada por absortometria de raios-x de dupla energia (DXA)
KRAIN SANTOS DE MELO
Dissertação defendida no Programa de Pós-graduação “Stricto Sensu” em Ciências e Tecnologias em Saúde da Universidade de Brasília, como parte das exigências para a obtenção do título de Mestre para a banca examinadora constituída pelos seguintes membros:
________________________________________________ Prof. Dr. Alexis Fonseca Welker
Universidade de Brasília
Programa de Pós-Graduação em Ciências e Tecnologias em Saúde
________________________________________________ Profa. Dra. Tatiana Ramos Lavich
Universidade de Brasília
Programa de Pós-Graduação em Ciências e Tecnologias em Saúde
________________________________________________ Profa. Dra. Maria Hosana Conceição
Universidade de Brasília
________________________________________________ Prof. Dr. Elton Clementino da Silva
v
“Scientia est potentia”. Latin aphorism
Dedico esse trabalho os meus pais. Sem o apoio integral e incansável de vocês nada disso seria possível.
vii
AGRADECIMENTOS
À minha família: mãe, pai e irmão. Meu amor e gratidão por vocês é eterno. À minha noiva.
Ao Prof. Dr. Alexis Welker, meu orientador.
Aos professores e servidores do programa de Pós-Graduação em Ciências e Tecnologias em Saúde (PGCTS) da Universidade de Brasília.
Aos meus amigos.
ÍNDICE
LISTA DE ANEXOS ... ix
LISTA DE FIGURAS ... ix
LISTA DE TABELAS ... xi
LISTA DE SIGLAS ... xii
RESUMO ... xiii
ABSTRACT ... xv
INTRODUÇÃO GERAL ... 1
DISCUSSÃO GERAL E CONCLUSÕES ... 22
REFERÊNCIAS BIBLIOGRÁFICAS CITADAS EM PARTES NÃO PERTENCENTES AOS MANUSCRITOS ... 25
ix
LISTA DE ANEXOS
ANEXO A – DADOS EXTRAS ... 27 ANEXO B – APROVAÇÃO DO COMITÊ DE ÉTICA EM PESQUISA...30 ANEXO C – TERMO DE CONSENTIMENTO LIVRE E ESCLARECIDO...32 ANEXO D – DECLARAÇÃO DA FACULDADE ANHANGUERA DE BRASÍLIA SOBRE INFRAESTRUTURA ...33
ANEXO E – DECLARAÇÃO DA UNB SOBRE
INFRAESTRUTURA...34 ANEXO F – TERMO DE RESPONSABILIDADE E COMPROMISSO DO(S) PESQUISADOR(S) RESPONSÁVEL (IS)...35
LISTA DE FIGURAS
Figura Título
Página
1 Média do peso (kg) antes de três dias de restrição de carboidratos e durante o período de 4 horas da reingestão de carboidratos
10
2 Percentual de mudança no peso (kg) durante o período de 4 horas da reingestão de carboidratos
10
3 Percentual de mudança na massa gorda (%bf) durante o período de 4 horas da reingestão de carboidratos e percentual de mudança na massa magra (lbm) e durante o período de 4 horas da reingestão de carboidratos
11
4 Correlação entre o coeficiente de variação da massa gorda (%bf) e a massa magra inicial dos voluntários durante o período de 4 horas da reingestão de carboidratos
12
5 Glicemia capilar após três dias de restrição de carboidrato e jejum; e durante o período de 4 horas da reingestão de carboidratos
xi
LISTA DE TABELAS
Tabela Título
Página
LISTA DE SIGLAS
PGCTS Programa de Pós-Graduação em Ciências e Tecnologias em Saúde
DXA Absortometria de raios-x de dupla energia CEP Comitê de ética em Pesquisa
%BF Percentual de gordura LBM Massa magra
xiii RESUMO
de Melo, Krain Santos. 2017. Efeito da reintrodução de carboidratos sobe a composição corporal avaliada por absortometria de raios-x de dupla camada (DXA). Dissertação (Mestrado em Ciências e Tecnologias em Saúde) – Programa de Pós-Graduação em Ciências e Tecnologias em Saúde, Universidade de Brasília, UnB.
O efeito das dietas com baixo teor de carboidratos tem sido intensamente investigado em atletas, indivíduos saudáveis, pacientes obesos e diabéticos. Durante a restrição de carboidratos, há uma diminuição nas reservas de glicogênio do corpo, peso e massa de gordura. No entanto, a restrição e/ou reingestão de carboidratos podem causar grandes alterações nas reservas e peso de glicogênio a curto prazo e potencialmente também podem distorcer os indicadores de composição corporal. A avaliação da composição corporal é essencial para analisar a eficácia das intervenções terapêuticas, como as que objetivam perda de gordura. Neste estudo, os voluntários passaram por um período de três dias de dieta restrita de carboidratos e com ingestão dos outros demais macronutrientes ad libitum. O nível de glicose, o peso corporal e a composição corporal foram medidos em jejum e durante quatro horas após a reintrodução de carboidratos. Estes foram ingeridos na forma de solução de 144 g de carboidratos diluídos em 350 ml de água. Maltodextrina e sacarose foram utilizadas como fontes de carboidratos em vez de glicose e frutose para acelerar ainda mais o esvaziamento gástrico, a digestão e para promover rápida síntese de glicogênio. A composição corporal foi avaliada por absortometria de raio x de dupla energia (DXA). Após três dias de restrição de carboidratos, houve uma perda média de peso de 2,37 kg. Ao longo das 4 h da ingestão de carboidratos (carga de glicogênio), o peso médio permaneceu invariável. A mudança no percentual de gordura de cada voluntário ao longo do período de 4 h da reingestão de carboidratos variou de 0,4% a 3,4%. As mudanças individuais no percentual de gordura variaram de um aumento de 3,6% para uma queda de -8,4%. A mudança intraindividual de gordura corporal ao longo das quatro horas foi significativamente correlacionada com a porcentagem inicial de massa magra (p <0,001): quanto maior era o percentual de massa magra, mais o valor de percentual de gordura variava. O pico glicêmico foi alcançado em 30 minutos em 37% dos voluntários e em 45 minutos pela maioria deles. Após 2 h, a glicemia permanecu maior do que no jejum. Pretendíamos verificar em um
momento agudo (e menor do que o observado nas metodologias dos artigos) as alterações corporais, além de determinar se a DXA seria capaz de avaliá-los.
xv
ABSTRACT
de MELO, Krain Santos. Effect of carbohydrate reintroduction on body composition assessed by dual energy x-ray (DXA).2017. – Post Graduate Program in Health Sciences and Technologies, University of Brasilia, UnB.
The effects of low carbohydrate diets has been intensely investigated in athletes, healthy individuals, obese patients and diabetics. During carbohydrate restriction, there is a decrease in the body's glycogen stores, weight and fat mass. However short-term carbohydrate restriction and/or refeeding may causes large alterations in glycogen stores and weight and may potentially also distort the indicators of body composition. The measurement of body composition is essential to analyze the efficacy of therapeutic interventions, such as the achieved fat loss. In this study, the volunteers initiated a 3-day period of carbohydrate-restricted diet, with ingestion of the other macronutrients ad libidum.Blood glucose level, body weight and body composition were measured in fast state and during 4-hour. The body composition was assessed by dual-energy X-ray absorptiometry scan (DXA). In fast state, the volunteers ingested a solution composed by 144 g of carbohydrates diluted in 350 ml of water and after one hour ingested it again, to reach the top of glycogen synthesis. Maltodextrin and sucrose were used as sources of carbohydrates instead of glucose and fructose to further accelerate gastric emptying and digestion. After three days of carbohydrate restriction, there was a mean weight loss of -2.37 kg. Over the 4 h of carbohydrate refeeding (glycogen loading), mean weight remained invariable. The change in body fat of each volunteer throughout the 4h period of carbohydrate refeeding ranged from 0.4% to 3.4%. Individual changes in body fat ranged from an increase of 3.6% to a fall of -8.4%. The change of body fat was significantly correlated with the initial percentage of lean body mass (p < 0.001): as higher was the lean body mass percentage, the higher was the variation in body fat. Glycemic peak was achieved at 30 min in 37% of volunteers and at 45 min by most of them at 45 min. At 2 h, blood glucose levels remained larger than the euglycemic. To evaluate the changes in body composition specifically induced by fluctuations in glycogen concentration may cause, we measured body composition after short-term carbohydrate restriction and refeeding. We aim to verify at an acute time (and lower than that observed in the methodologies of the
articles) the body alterations, besides to determine if the DXA would be able to evaluate them.
1
INTRODUÇÃO GERAL
Diferentes estratégias nutricionais são utilizadas para reduzir o peso, dentre elas, a restrição de carboidratos. É sabido que a restrição calórica com redução da ingestão de carboidratos gera diminuição significativa do peso corporal em diferentes grupos: não obesos, pessoas com sobrepeso e obesos (Johnstone et al. 2015). A restrição calórica pode ser observada em estratégias nutricionais como o jejum intermitente, dietas com pouco carboidrato (“low carb”) e até mesmo as cetogênicas (praticamente sem carboidratos); utilizadas em pacientes obesos, diabéticos ou mesmo em indivíduos saudáveis e atletas (Kelly et al., 2007; Gow et al., 2016; Zuo et al., 2016). de dietas muito restritivas, sabe-se que as mesmas tendem a gerar efeitos colaterais como o transtorno da compulsão alimentar periódica (“binge eating disorder”) (Kliewer et al., 2015; Shulte et al., 2016). Outro problema seria a baixa adesão e manutenção de dietas muito restritivas por longos períodos de tempo (Johnstone, 2015; Fleming and Kris-Etherton, 2016).
Diferentes intervenções e tempos (dias, semanas ou meses) envolvendo a restrição de carboidratos causam alteração na composição corporal (Berardi et al., 2006; Nielsen et al., 2010; Poole et al., 2010). Dentre elas, ocorre diminuição na massa gorda (Wilson et al. 2017) e redução do peso em uma semana (Stanard et al., 2010). Mudanças na composição corporal também podem ocorrer por redução do nível de glicogênio (Berardi et al. 2006) e/ou desidratação (Kohrt et al. 1995). Na verdade, diminuição no nível de glicogênio tende a também causar uma queda no nível de hidratação, uma vez que 1 g de glicogênio está associado a aproximadamente 3 g de água. Da mesma forma, o aumento da síntese de glicogênio (Hansen et al., 1999; Berardi et al., 2006; Nielsen et al., 2010; Poole et al., 2010) e a rehidratação (Kohrt et al., 1995; Lichtenbelt et al., 2004) promovem ganho de peso.
Para se verificar alterações persistentes e reais na composição corporal (massa gorda e magra) e não aquelas advindas somente de variações no nível de hidratação e de estoque de glicogênio, recentemente se analisou o efeito da reingestão de carboidratos sobre a composição corporal ao final de um período de restrição de carboidratos (Wilson et al. 2017). Neste estudo, a avaliação da composição corporal foi refeita após uma semana da reintrodução de carboidratos (Wilson et al. 2017).
2
Este período ultrapassa o período de três dias, depois do qual ocorre significativa lipogênese de novo (Acheson et al. 1988). Portanto, o período de uma semana após uma reintrodução de carboidratos pode mostrar uma variação advinda de um aumento real de gordura corporal e não somente de variações no nível de glicogênio.
Como diferencial do trabalho supracitado, utilizamos um tempo de reintrodução de carboidratos de quatro horas ao invés de sete dias, visto que a síntese de glicogênio muscular, após um período de depleção seguido de ingestão de carboidratos, ocorre em duas fases: uma fase rápida que dura cerca de 30-60 minutos e uma posterior, mais lenta, que pode durar várias horas (4-25 horas) (Hansen et al., 1999; Berardi et al., 2006; Nielsen et al., 2010). Utilizamos como carboidrato para a reposição de glicogênio fontes de rápido esvaziamento gástrico, digestão e absorção, maltodextrina e sacarose, e numa combinação que cause alta resposta glicêmica e insulinêmica (que promovem a glicogênese). Este protocolo favorece rápidas alterações na composição corporal com grandes ingestões dos mesmos (1,0-1,85g/kg) (Hansen et al., 1999; Berardi et al., 2006; Nielsen et al., 2010).
Nossa hipótese é de que a reingestão de carboidrato após um período de sua restrição poderia causar mudanças nos indicadores de composição corporal, induzindo a erros de interpretação de resultados. Não se sabe se o nível de estoque de glicogênio afeta a composição corporal e se teria um potencial em causar superestimação ou subestimação de alterações na perda de gordura corporal (Silver et al., 2013).
Para a análise da composição corporal, optamos pela absortometria de raios-x de dupla energia (DEXA), metodologia escolhida pela praticidade e reprodutibilidade dos testes em um curto espaço de tempo (Prior et al., 1997; Silver et al., 2013).
O presente trabalho teve como objetivo analisar a composição corporal (massa gorda, massa magra e peso) dos indivíduos submetidos à depleção dos estoques de glicogênio – uma restrição de carboidratos por três dias – e após na sua reposição parcial nas quatro primeiras horas de reintrodução de carboidratos. A análise também verificou se indivíduos com diferentes características corporais sofrem diferentes alterações na composição corporal medidas pela variação no estoque de glicogênio.
3
OBJETIVOS
O presente estudo teve como objetivo avaliar o efeito do nível de glicogênio sobre a avaliação da composição corporal (percentual de gordura, massa magra e massa gorda) pela DXA, em indivíduos na situação de baixo estoque de glicogênio e após a reingestão de carboidratos de rápida digestão e absorção (solução de maltodextrina e sacarose). Outro objetivo foi analisar o coeficiente de variação das medições da composição corporal durante as primeiras quatro horas de reposição de glicogênio.
4
CAPÍTULO 1 – MANUSCRITO 1:
Acute effect of carbohydrate reintroduction on body composition assessed by dual energy x-ray absorptiometry (DXA)
Krain S. Melo1, Alexis F. Welker1*
1 Programa de Pós-Graduação em Ciências e Tecnologias em Saúde, Faculdade da Ceilândia, Universidade de Brasília, Brasília, 72220-140, Brasil.
Short title: DXA-measured body changes on carbohydrate reintroduction
* Author for correspondence: Alexis Fonseca Welker
1
Laboratório de Fisiologia, Programa de Pós-Graduação em Ciências e Tecnologias em Saúde, Faculdade da Ceilândia, Universidade de Brasília, Brasília, 72220-140, Brasil. Faculdade da Ceilândia,
Tel.: +55-61-98437-1778 e-mail: welker.af@gmail.com
5
Abstract
6
INTRODUCTION
The majority of the treatments of obesity and diabetes aim to promote fat loss Therefore, the analysis of the efficacy of the different therapeutic interventions requires the precise measurement of changes in body fat. However, body composition (fat mass measured by dual-energy x-ray absorptiometry – DXA) varies significantly when the weight is abruptly altered (Prior et al., 1997; Mahon et al. 2007). To favor fat loss, the diets normally include periods of carbohydrate restrictions (Horne et al. 2015; Alhamdan et al. 2016; Gow et al. 2016). Restricted-carbohydrate diets are frequently accompanied by episodes of ingestion of large amounts of carbohydrates, intentionally, such as in the ‘intermittent fasting’ approach (Kelly et al., 2007; Gow et al., 2016; Zuo et al., 2016) or unintentionally (Kliewer et al., 2015; Shulte et al., 2016). Carbohydrate restriction promotes an abrupt loss of weight, such as 4.4 kg after only three days, and the reintroduction of carbohydrate elicits a rapid weight gain, such as 4.6 kg in six days (Achesson et al. 1988). These rapid and large variations in body weight are mainly caused by the depletion and restoration of glycogen stores (Stanard et al. 2010). Therefore, a measured decrease in body fat value may be actually derived from an acute weight change and not from fat gain or loss. This tends to lead to an erroneous interpretation and an over- or underestimation of the efficiency of a given treatment (Knuiman et al., 2015). Recently, to estimate/control the effect of low glycogen stores of subjects doing a mildly ketogenic diet (van Delft et al. 2010) on body composition values, a study reintroduced carbohydrate for one week before the measurement of body composition by DXA (Wilson et al 2017). As expected, after this one-week period, weight and lean body mass became increased (6.3% and 4.8%, respectively), but fat mass showed a strong gain of 13.7% (p < 0.0001). This rise in fat body is due to the high lipogenesis rate that takes place after three days of carbohydrate re-introducion (Achesson et al. 1988). Therefore, the duration of one week is too long to evaluate alterations in the assessment of body composition due to restoration of glycogen stores. The rate of glycogen synthesis is the highest in the first 60 minutes after a large carbohydrate refeeding and , becomes gradually diminished (Hansen et al., 1999; Jentjens et al., 2003; Berardi et al., 2006; Nielsen et al.,2010). Only one day of carbohydrate reintroduction is enogh to restore high glycogen levels (Macauley et al. 2015). In the present study, we measured body composition after short-term carbohydrate refeeding to investigate potential changes induced by fluctuations in glycogen levels.
7
MATERIAL AND METHODS
SUBJECTS
Thirty-five individuals were recruited by advertisement according to the following inclusion criteria: healthy volunteers who have experienced low-carbohydrate diets, such as ketogenic, Atkins, Dukan and intermittent fasting, without reporting no discomfort. Exclusion criteria were pregnancy, any history of metabolic disease, use of medication that influences body weight regulation and alcohol or substance abuse. Every participant gave a written informed consent before participation in the study. The study was approved by the Ethics Committee of the Universidade de Brasília (CAAE 64739317.9.0000.8093/2.047.278).
PROCEDURES
In a first visit to the laboratory in the morning and before breakfast, each of the 35 recruited participants and were weighted. Thereafter, the participants initiated a 3-day period of carbohydrate-restricted diet, alcohol abstinence and adequate hydration. We used a zero-carb diet (without adding any form of zero-carbohydrate: no fructose, sucrose or glucose) with ingestion of the other macronutrients ad libidum, a model observed in other articles (Brehm et al. 2003, 2005; Samaha et al. 2003, Landers et al. 2002; Yancy et al. 2004). Although the volunteers reported to have previously done low-carbohydrate diets, 7 volunteers abandoned the study, claiming fatigue, malaise, headache or other symptoms. A total of 27 volunteers completed all procedures.
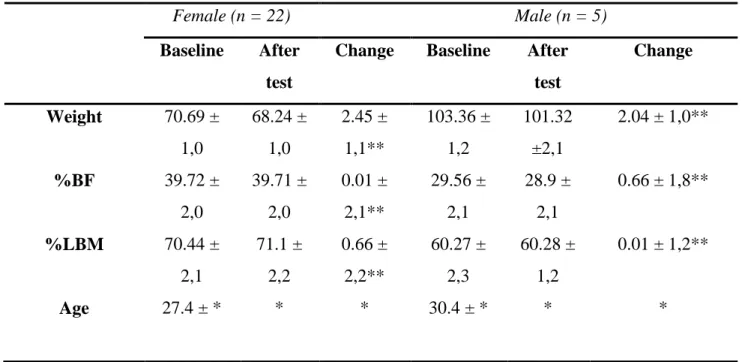
After the 3-day of carbohydrate restriction, each subject came to our laboratory after a 12-h overnight fast. Fasting blood glucose level and body weight were measured and a questionnaire about eventual side effects was answered. Then, body composition was assessed by dual-energy X-ray absorptiometry scan (DXA; GE Prodigy Lunar, USA). Descriptive characteristics of the participants are described in Table 1.
Body composition parameters were automatically generated and analyzed using enCORE software version 13.6. The scanner was calibrated daily against the calibration block supplied by the manufacturer.
8
Table 1. Baseline characteristics of the volunteers.
Female (n = 22) Male (n = 5)
Baseline After test
Change Baseline After test Change Weight 70.69 ± 1,0 68.24 ± 1,0 2.45 ± 1,1** 103.36 ± 1,2 101.32 ±2,1 2.04 ± 1,0** %BF 39.72 ± 2,0 39.71 ± 2,0 0.01 ± 2,1** 29.56 ± 2,1 28.9 ± 2,1 0.66 ± 1,8** %LBM 70.44 ± 2,1 71.1 ± 2,2 0.66 ± 2,2** 60.27 ± 2,3 60.28 ± 1,2 0.01 ± 1,2** Age 27.4 ± * * * 30.4 ± * * *
** p < 0,05. No estatistical change values * Unchangeable values
After the first analysis of the body composition of the fasted participant, the volunteer ingested a solution composed by 144 g of carbohydrates diluted in 350 ml of water. This dose provides the highest known rate of carbohydrate absorption without discomfort (Baker et al., 2015). In order to maximize the rate of glycogen resynthesis through a high glycemic and insulin response (Jentjens et al. 2003), the sources of carbohydrates were 40% of maltodextrin (58 g without flavor; Integral Médica) and 60% of sucrose (86 g; União), providing 70% of glucose and 30% of fructose. This ratio of glucose and fructose elicits the highest glycemic response in comparison to other combinations (Akhavan and Anderson 2007). Maltodextrin and sucrose were used as sources of carbohydrates instead of glucose and fructose to further accelerate gastric emptying and digestion due to their higher molecular weight (McGlory and Morton 2010).
After one hour, the volunteers ingested once again the same solution, to reach the top of glycogen synthesis (Jentjens et al. 2003). Following the first solution intake, body composition was reassessed every 60 minutes for four hours. Capillary blood glucose level was measured at 15, 30, 45, 60, 90 and 120 min after the first solution intake.
9
To analyze the effects of carbohydrate refeeding on body composition, the repeated-measures ANOVA was used. When the data were non-normally distributed or heteroscedastic, we used Kruskal-Wallis test followed by Mann-Whitney comparison tests. The eventual changes in body composition of each participant throughout the 4-h period of carbohydrate refeeding was defined as the coefficient of variation of the four DXA measurements of percent body fat. To investigate whether this variability diverges along individuals with different potentials to store glycogen, we analyzed its relationship with the initial percent lean body mass (where the majority of glycogen is stored). The Spearmen correlation test was used to determine if the above correlation was statistically significant. For all analysis, P values less than 0.05 were considered statistically significant. Data are presented as mean ± standard error of the mean (SEM).
RESULTS
The ingestion of carbohydrate solution caused a rapid rise in blood glucose levels already after 15 minutes. Glycemic peak was achieved at 30 min in 37% of volunteers and at 45 min by most of them at 45 min. At 2 h, blood glucose levels remained larger than the euglycemic range (Fig. 1).
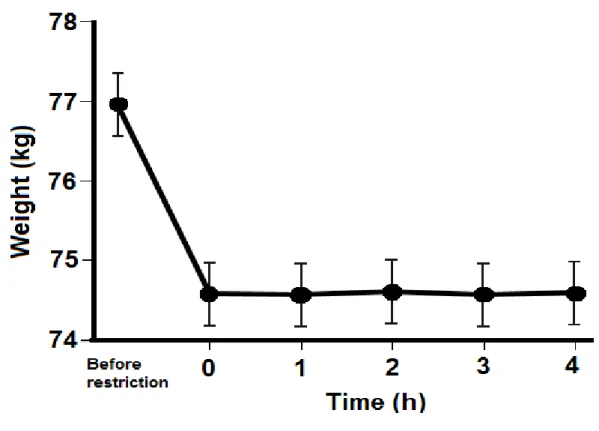
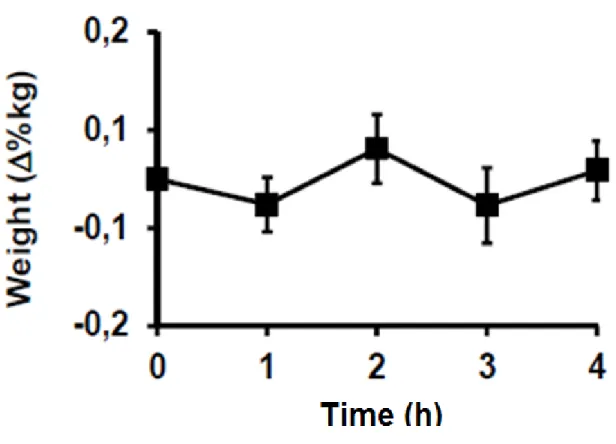
After three days of carbohydrate restriction, there was a mean weight loss, measured in the morning after an overnight fast, of -2.37 kg (Fig. 2). Over the course of the 4 h of carbohydrate refeeding (glycogen loading), mean weight remained invariable (p = 0.99). This constancy was homogeneous among the volunteers, with a very small coefficient of variation of weight (0.1%) (Fig. 3).
10
Figure 1. Capillary blood glucose after three days of carbohydrate restriction and an overnight fast, and during the 4-h period of carbohydrate refeeding (p = 0.322)
Figure 2. Mean weight (kg) before the three days of carbohydrate restriction, thereafter and during the 4 h period of carbohydrate refeeding.
11
Figure 3. Percent change in weight (kg) during the 4-h period of carbohydrate refeeding.
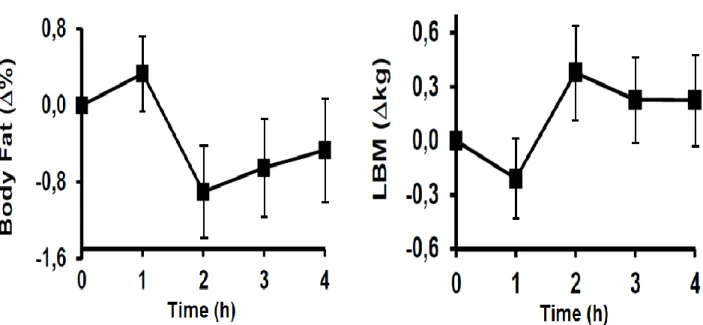
The mean change in body composition at the end of the 4 h period was also modest, a loss of -0.5% in body fat and gain of +0.2 kg in lean body mass (Fig. 4). However, in contrast to the immutability of weight, there were considerable individual changes in body composition in response to carbohydrate refeeding. The change in body fat of each volunteer throughout the 4 h period of carbohydrate refeeding showed very distinct values of coefficient of variation, ranging from 0.4% to 3.4%. Individual changes in body fat ranged from an increase of 3.6% to a fall of -8.4% (from 15.6% to 14.1%).
12
Figure 4. Percent change in body fat (%) during the 4-h period of carbohydrate refeeding and percent change in lean body mass (LBM in kg) during the 4-h period of carbohydrate refeeding.
This heterogeneity in the changes of body fat was significantly correlated with the initial percentage of lean body mass (p < 0.001): as higher was the lean body mass percentage, the higher was the variation in body fat along the four measurements throughout carbohydrate refeeding (Fig. 5).
13
Figure 5. Correlation between initial lean body mass percentage and the coefficient of variation of the body fat during during the 4-h period of carbohydrate refeeding (p = 0.001).
DISCUSSION
Three days of carbohydrate restriction caused a mean weight loss of -2.37 kg and a strong and acute (4 h) refeeding did not alter the mean weight. This absence of influence of carbohydrate refeeding on weight was very homogeneous among the volunteers. In contrast, the body composition throughout the 4 h period of carbohydrate refeeding showed variations which were very distinct among volunteers. As higher was the lean body mass percentage, the higher was the variation in body fat along the four measurements throughout carbohydrate refeeding.
Our weight variation was lower (Samaha et al. 2003; Yancy et al 2004) and higher (Muller et al. 2015) in the individuals compared to similar articles. The weight drop reached 8% in one of the volunteers, which had the lowest %BF of all (15.1%). This change in body composition varies according to the %BF of each volunteer, and the less fat the individual has, the greater the body composition variation during a short-term refeeding.
One hypothesis for low weight variation would be the low glycogen synthesis at the time used. For example, just three days of a low-carbohydrate diet for healthy young men will have an impressive loss of 4.4 kg and reach the maximum depletion of glycogen stores. At the same time, a high-carbohydrate diet for six days increases body weight by 4.6 kg (Achesson et al. 1988). It is known that diets with reduced carbohydrate levels lead to considerable weight loss. In our study, carbohydrate restriction was used in three days; lower than most articles (Minderico 2007; Jabekk 2010; Gomez-Arbelaez 2016; Hall et al 2016; Urbain 2017).
Another hypothesis for the non-change in body weight during the four hours of the test could be justified by the fact that renal function does not change in a short time, it is known that after the reintroduction of carbohydrates, there are renal sodium changes, which would lead to a great quantity of water retention in all tissues (Phiney et al. 1984). However, it is likely that this phenomenon does not occur in such a small interval. Therefore, the absence of weight change may indicate that the hydration level did not change significantly over the 4 hours. These data contradict studies that show a sudden increase (in a few hours) of body mass through a rapid increase in the level of body hydration alters body composition (Kohrt et al. 1995; Lichtenbelt et al. 2004).
In our study, in the observed time, we did not observe significance in the variation of the percentage of fat or lean mass variation over time. Studies with reintroduction of carbohydrates after restrictive diets reached 3 kg of lean mass gain (Wilson et al. 2017). Articles usually associate lean mass increase parallel to the decrease in fat percentage (Jabekk et al. 2010) and
14
lean mass loss tend to demonstrate weight loss (Krieger et al. 2006). In these articles, although low-carbohydrate diets reduce the amount of lean mass lost with weight reduction (Manninen et al. 2006), a reduction in the percentage of fat is also noted (Brehm et al. 2003; Meckling et al. 2004; Yancy et al. 2004; Noakes et al. 2006; Keogh et al. 2008; Brinkworth et al. 2009; Volek et al. 2009). Our study contradicts articles with similar methodology, since they tend to show a significant parallel variation of the three mentioned parameters (Bopp et al. 2006; Krieger et al. 2006).
When we correlated the coefficient of variation of the fat percentage with the initial fat percentage of the volunteers, we found statistical significance for a greater variation when the volunteer had a lower percentage of initial fat. These data corroborate articles that show greater variation in the percentage of fat and lean mass in non-obese individuals (Volek et al 2002; Hall et al 2016, Merra et al 2017). It is known that people with lower% BF have a greater use of glucose and lose, through a hypocaloric diet, more lean mass than people with high BF% (Achesson et al. 1988; Friedl et al. 1994).
Although there was no change in weight over the four hours of refeed with carbohydrates (mean variation less than 0.01%), the percentage of fat in some volunteers decreased by more than 3.5%. In the evaluation of the fat percentage, there was no significant difference between the average fat percentages of the subjects during the test. This shows a homogeneity among the participants.
Articles show that in restrictive diets, individuals present weight variation and reduce fat mass (Skov et al. 1999; Westman et al. 2002; Foster et al. 2003). However, these articles use methodologies with longer restraint times, which could explain the lack of differences among volunteers. Carbohydrate-restricted articles tend to use longer periods (weeks) in monitoring the fat percentage. (Reaven et al. 1993). However, one bias in these articles could be the lipogenesis. Weight gain and fat mass increase may be associated with this phenomenon (Wilson et al., 2007, Muller et al. 2015). In articles that show a reduction in the fat percentage of participants in the first week (Gomez-Arbelaez 2016; Urbain 2017), the evaluation in the first hours is not reported because it is not part of the methodology. Another hypothesis would be the low variation between individuals not being detected by DXA.
In our methodology, we aimed to evaluate these possible alterations in the first hours after the ingestion of carbohydrates of rapid absorption and it is known that DXA may be incapable of detecting minimal alterations in the patients, underestimating them. One source of error would be the hydration of the lean mass. A 5% variation in hydration in lean mass can change the percentage of body fat determined by DEXA by almost 3% (Prior et al. 1985). This can be a problem when comparing different individuals, in whom the hydration of the lean mass
15
can vary. Another hypothesis would be the evaluation over time, when looking at the means of the group, the DEXA presents errors ranging from 4% in a study (Van der Ploeg et al. 2003) to up to 8-10% in another study (Clasey et al. 1999).
In our article, we do not separate individuals into sex, the accuracy of DXA can be affected by sex, size, fat and disease status of individuals (Williams et al. 2006) or different groups. In individuals with low fat percentage, DEXA was reasonably accurate when observing the group change in body fat percentage was 4%. Thus, variations below 4% would not be detected by DEXA (van Marken et al. 2004). It is also known that it can overestimate body fat percentage decreases or underestimate increases in body fat percentage (Evans et al. 1999). An alternative would be to compare different methods in the evaluation of body composition, a methodology that found significant differences between bioimpedance, DEXA and hydrostatic weighing (Minderico et al. 2007).
In the blood glucose level analysis, there was no significant difference in blood glucose among the volunteers during the test period (p=0.322). This result was expected, since in the exclusion criteria, volunteers could not be diabetic. This data shows the homogeneity of the sample for the desired purposes. Our solution caused a very high glycemia increase, reaching a mean peak of 152 mg / dL. This value is under achieved with the combination of carbohydrates, 80% glucose and 20% fructose (172 mg/dl), known to cause the highest glycemic peak (Akhavan and Anderson 2007). This study also used the dose of ~ 1 g / kg of carbohydrate, allowing us to conclude that our blend achieved the goal of causing the highest glycemic response possible. Our blend also provided, after digestion, 80% glucose and 20% fructose, however, we used sources with higher molecular mass, which causes faster gastric emptying and digestion (McGlory and Morton 2010).
The glycemic curve found in the article corroborates the values demonstrated by articles that used maltodextrin and similar methodology (Englyst et al. 1999; Livesey et al. 2009). Due the lack of significant difference in the blood glucose level of individuals, we chose not to correlate it with the percentage of fat.
Although this study was not designed to elucidate completely the mechanisms behind the observed changes in body composition in the test interval; The study showed that the ingestion of a fast-absorbed carbohydrate solution can generate a percentage variation of body fat significantly correlated with those who present a lower percentage of body fat. A change in the lean mass is also observed during the evaluated interval. However, the weight variation and the percentage of fat among the individuals did not present significance. Blood glucose does not appear to be influenced by the ingestion of these hyperglycidic solutions among volunteers, regardless of fat percentage.
16
The precise analysis of changes in body composition is relevant to assess the contribution of carbohydrate restriction diets intervention, not only in total body weight, but also in changes in the percentage of fat and lean mass (Gomez-Arbelaez et al. 2016; Magkos et al. 2016;) . To obtain this information, different models and techniques that integrate information obtained from a single measurement (body density, total mineral mass, total body water) can be used to reduce the number of premises, such as DXA (Kyle et al. 2004; Le Caryennec et al. 20007; Heymsfield et al. 2015). DXA is considered the gold standard technique by most of the groups that work on body composition and was used as reference method in the present work. The objective of the analysis with DXA was to verify at an acute time (and lower than that observed in the methodologies of the articles) the body alterations, besides to determine if the DXA would be able to evaluate them.
This study has some potential limitations. First, a limit of the study was due to the small number of participants, although it is acceptable for studies with similar methodology (Merra et al 2017). More data is needed in a larger population. Second, follow-up was short: our results need to be confirmed in longer-term clinical studies. Third, the study did not have an evaluation of biomarkers, such as ketogenic organisms to verify the metabolic status, and to compare the analysis of body composition by DXA with other techniques. Thus, there is still insufficient evidence to provide a clear effect of acute hyperglycidic solutions on body composition. Another limitation was the abandonment of volunteers during the three days of carbohydrate restriction, a phenomenon also noted in studies with similar methodology (Coin et al. 2013, Merra et al. 2017).
In conclusion, to our knowledge, this is one of the first studies that exhaustively evaluated changes in body composition during the carbohydrate intake process of rapid absorption, after a non-carbohydrate diet. This evaluation was performed using dual energy x-ray absorptiometry. The non-carbohydrate diet for three days induced weight loss in the volunteers in the mean of 2.37 kg, however, during the test; we did not find significance in the variation of the weight or percentage of fat among the individuals. When we correlated the variation of fat percentage during the test with the percentage of initial fat of the volunteer, we noticed significance, as well as a variation of lean mass. The glycemic curve did not present statistical significance among the individuals.
Further studies are needed to clarify changes in body composition within a few hours of carbohydrate intake from rapid absorption.
17
1. Acheson KJ, Schutz Y, Bessard T, Anantharaman K, Flatt JP, Jéquier E. Glycogen storage capacity and de novo lipogenesis during massive carbohydrate overfeeding in man. Am J Clin Nutr. 1988;48(2):240-7.
2. Armstrong LE, Lee EC, Casa D, Johnson EC, Ganio MS, McDermott B, et al. Exertional Hyponatremia and Serum Sodium Change During Ultraendurance Cycling. Int J Sport NutrExercMetab. 2016:1-25.
3. Akhavan T, Anderson GH. Effects of glucose-to-fructose ratios in solutions on subjective satiety, food intake, and satiety hormones in young men. Am J Clin Nutr. 2007;86(5):1354-63.
4. Alhamdan BA, Garcia-Alvarez A, Alzahrnai AH, Karanxha J, Stretchberry DR, Contrera KJ, et al. Alternate-day versus daily energy restriction diets: which is more effective for weight loss? A systematic review and meta-analysis. Obes Sci Pract. 2016;2(3):293-302. 5. Baker LB, Rollo I, Stein KW, Jeukendrup AE. Acute Effects of Carbohydrate
Supplementation on Intermittent Sports Performance. Nutrients. 2015;7(7):5733-63.
6. Berardi JM, Price TB, Noreen EE, Lemon PW. Postexercise muscle glycogen recovery enhanced with a carbohydrate-protein supplement. Med Sci Sports Exerc. 2006;38(6):1106-13. 7. Bopp MJ, Houston DK, Lenchik L, Easter L, Kritchevsky SB, Nicklas BJ. Lean mass loss is associated with low protein intake during dietary-induced weight loss in postmenopausal women. J Am Diet Assoc. 2008;108(7):1216-20.
8. Brehm BJ, Seeley RJ, Daniels SR, D'Alessio DA. A randomized trial comparing a very low carbohydrate diet and a calorie-restricted low fat diet on body weight and cardiovascular risk factors in healthy women. J Clin Endocrinol Metab. 2003;88(4):1617-23.
9. Brehm BJ, Spang SE, Lattin BL, Seeley RJ, Daniels SR, D'Alessio DA. The role of energy expenditure in the differential weight loss in obese women on fat and low-carbohydrate diets. J Clin Endocrinol Metab. 2005;90(3):1475-82.
10. Brinkworth GD, Noakes M, Clifton PM, Buckley JD. Effects of a low carbohydrate weight loss diet on exercise capacity and tolerance in obese subjects. Obesity (Silver Spring). 2009;17(10):1916-23.
11. Clasey JL, Kanaley JA, Wideman L, Heymsfield SB, Teates CD, Gutgesell ME, et al. Validity of methods of body composition assessment in young and older men and women. J Appl Physiol (1985). 1999;86(5):1728-38.
12. Coin A, Sarti S, Ruggiero E, Giannini S, Pedrazzoni M, Minisola S, et al. Prevalence of sarcopenia based on different diagnostic criteria using DEXA and appendicular skeletal muscle mass reference values in an Italian population aged 20 to 80. J Am Med Dir Assoc.
18
13. Englyst KN, Englyst HN, Hudson GJ, Cole TJ, Cummings JH. Rapidly available glucose in foods: an in vitro measurement that reflects the glycemic response. Am J Clin Nutr.
1999;69(3):448-54.
14. Evans EM, Saunders MJ, Spano MA, Arngrimsson SA, Lewis RD, Cureton KJ. Body-composition changes with diet and exercise in obese women: a comparison of estimates from clinical methods and a 4-component model. Am J Clin Nutr. 1999;70(1):5-12.
15. Foster GD, Wyatt HR, Hill JO, McGuckin BG, Brill C, Mohammed BS, et al. A randomized trial of a low-carbohydrate diet for obesity. N Engl J Med. 2003;348(21):2082-90. 16. Friedl KE, Moore RJ, Martinez-Lopez LE, Vogel JA, Askew EW, Marchitelli LJ, et al. Lower limit of body fat in healthy active men. J Appl Physiol (1985). 1994;77(2):933-40.
17. Gomez-Arbelaez D, Bellido D, Castro AI, Ordoñez-Mayan L, Carreira J, Galban C, et al. Body Composition Changes After Very-Low-Calorie Ketogenic Diet in Obesity Evaluated by 3 Standardized Methods. J Clin Endocrinol Metab. 2017;102(2):488-98.
18. Gow ML, Baur LA, Ho M, Chisholm K, Noakes M, Cowell CT, et al. Can early weight loss, eating behaviors and socioeconomic factors predict successful weight loss at 12- and 24-months in adolescents with obesity and insulin resistance participating in a randomised controlled trial? Int J Behav Nutr Phys Act. 2016;13:43.
19. Hall KD, Chen KY, Guo J, Lam YY, Leibel RL, Mayer LE, et al. Energy expenditure and body composition changes after an isocaloric ketogenic diet in overweight and obese men. Am J Clin Nutr. 2016;104(2):324-33.
20. Hansen BF, Asp S, Kiens B, Richter EA. Glycogen concentration in human skeletal muscle: effect of prolonged insulin and glucose infusion. Scand J Med Sci Sports.
1999;9(4):209-
21. Heymsfield SB, Ebbeling CB, Zheng J, Pietrobelli A, Strauss BJ, Silva AM, et al. Multi-component molecular-level body composition reference methods: evolving concepts and future directions. Obes Rev. 2015;16(4):282-94.
22. Horne, B. D., Muhlestein, J. B., & Anderson, J. L. (2015). Health effects of intermittent
fasting: hormesis or harm? A systematicreview. The American
journalofclinicalnutrition, 102(2), 464-470.
23. Jabekk PT, Moe IA, Meen HD, Tomten SE, Høstmark AT. Resistance training in overweight women on a ketogenic diet conserved lean body mass while reducing body fat. Nutr Metab (Lond). 2010;7:17.
24. Jentjens R, Jeukendrup A. Determinants of post-exercise glycogen synthesis during short-term recovery. Sports Med. 2003;33(2):117-44.
19
of weight loss from a very-low-carbohydrate diet on endothelial function and markers of
cardiovascular disease risk in subjects with abdominal obesity. Am J Clin Nutr. 2008;87(3):567-7
26. Kohrt WM, Holloszy JO. Loss of skeletal muscle mass with aging: effect on glucose tolerance. J Gerontol A Biol Sci Med Sci. 1995;50 Spec No:68-72.
27. Knuiman P, Hopman MT, Mensink M. Glycogen availability and skeletal muscle adaptations with endurance and resistance exercise. NutrMetab (Lond). 2015;12:59.
28. Kreitzman SN, Coxon AY, Szaz KF. Glycogen storage: illusions of easy weight loss, excessive weight regain, and distortions in estimates of body composition. Am J Clin Nutr. 1992;56(1 Suppl):292S-3S.
29. Krieger JW, Sitren HS, Daniels MJ, Langkamp-Henken B. Effects of variation in protein and carbohydrate intake on body mass and composition during energy restriction: a
meta-regression 1. Am J Clin Nutr. 2006;83(2):260-74.
30. Kyle UG, Bosaeus I, De Lorenzo AD, Deurenberg P, Elia M, Manuel Gómez J, et al. Bioelectrical impedance analysis-part II: utilization in clinical practice. Clin Nutr.
2004;23(6):1430-53.
31. Landers P, Wolfe MM, Glore S, Guild R, Phillips L. Effect of weight loss plans on body composition and diet duration. J Okla State Med Assoc. 2002;95(5):329-31.
32. Le Carvennec M, Fagour C, Adenis-Lamarre E, Perlemoine C, Gin H, Rigalleau V. Body composition of obese subjects by air displacement plethysmography: The influence of hydration. Obesity (Silver Spring). 2007;15(1):78-84.
33. Livesey G, Tagami H. Interventions to lower the glycemic response to carbohydrate foods with a low-viscosity fiber (resistant maltodextrin): meta-analysis of randomized controlled trials. Am J Clin Nutr. 2009;89(1):114-25.
34. Macauley M, Smith FE, Thelwall PE, Hollingsworth KG, Taylor R. Diurnal variation in skeletal muscle and liver glycogen in humans with normal health and Type 2 diabetes. Clin Sci (Lond). 2015;128(10):707-13.
35. Magkos F, Fraterrigo G, Yoshino J, Luecking C, Kirbach K, Kelly SC, et al. Effects of Moderate and Subsequent Progressive Weight Loss on Metabolic Function and Adipose Tissue Biology in Humans with Obesity. Cell Metab. 2016;23(4):591-601.
36. Mahon AK, Flynn MG, Iglay HB, Stewart LK, Johnson CA, McFarlin BK, et al. Measurement of body composition changes with weight loss in postmenopausal women: comparison of methods. J Nutr Health Aging. 2007;11(3):203-13.
37. Manninen AH. Very-low-carbohydrate diets and preservation of muscle mass. Nutr Metab (Lond). 2006;3:9.
20
38. McGlory C, Morton JP. The effects of postexercise consumption of high-molecular-weight versus low-molecular-high-molecular-weight carbohydrate solutions on subsequent high-intensity interval-running capacity. Int J Sport Nutr Exerc Metab. 2010;20(5):361-9.
39. Meckling KA, O'Sullivan C, Saari D. Comparison of a low-fat diet to a low-carbohydrate diet on weight loss, body composition, and risk factors for diabetes and cardiovascular disease in free-living, overweight men and women. J Clin Endocrinol Metab. 2004;89(6):2717-23.
40. Merra G, Gratteri S, De Lorenzo A, Barrucco S, Perrone MA, Avolio E, et al. Effects of very-low-calorie diet on body composition, metabolic state, and genes expression: a randomized double-blind placebo-controlled trial. Eur Rev Med Pharmacol Sci. 2017;21(2):329-45.
41. Merra G, Gratteri S, De Lorenzo A, Barrucco S, Perrone MA, Avolio E, et al. Effects of very-low-calorie diet on body composition, metabolic state, and genes expression: a randomized double-blind placebo-controlled trial. Eur Rev Med Pharmacol Sci. 2017;21(2):329-45.
42. Minderico CS, Silva AM, Keller K, Branco TL, Martins SS, Palmeira AL, et al.
Usefulness of different techniques for measuring body composition changes during weight loss in overweight and obese women. Br J Nutr. 2008;99(2):432-41.
43. Müller MJ, Enderle J, Pourhassan M, Braun W, Eggeling B, Lagerpusch M, et al. Metabolic adaptation to caloric restriction and subsequent refeeding: the Minnesota Starvation Experiment revisited. Am J Clin Nutr. 2015;102(4):807-19.
44. Noakes M, Foster PR, Keogh JB, James AP, Mamo JC, Clifton PM. Comparison of isocaloric very low carbohydrate/high saturated fat and high carbohydrate/low saturated fat diets on body composition and cardiovascular risk. Nutr Metab (Lond). 2006;3:7.
45. Phinney SD, Bistrian BR, Evans WJ, Gervino E, Blackburn GL. The human metabolic response to chronic ketosis without caloric restriction: preservation of submaximal exercise capability with reduced carbohydrate oxidation. Metabolism. 1983;32(8):769-76.
46. Prior BM, Cureton KJ, Modlesky CM, Evans EM, Sloniger MA, Saunders M, et al. In vivo validation of whole body composition estimates from dual-energy X-ray absorptiometry. J Appl Physiol (1985). 1997;83(2):623-30.
47. Reaven GM. Role of insulin resistance in the pathophysiology of non-insulin dependent diabetes mellitus. Diabetes Metab Rev. 1993;9 Suppl 1:5S-12S.
48. Samaha FF, Iqbal N, Seshadri P, Chicano KL, Daily DA, McGrory J, et al. A low-carbohydrate as compared with a low-fat diet in severe obesity. N Engl J Med.
2003;348(21):2074-81.
49. Samaha FF, Iqbal N, Seshadri P, Chicano KL, Daily DA, McGrory J, et al. A low-carbohydrate as compared with a low-fat diet in severe obesity. N Engl J Med.
21
50. Skov AR, Toubro S, Rønn B, Holm L, Astrup A. Randomized trial on protein vs carbohydrate in ad libitum fat reduced diet for the treatment of obesity. Int J Obes Relat Metab Disord. 1999;23(5):528-36.
51. Urbain P, Strom L, Morawski L, Wehrle A, Deibert P, Bertz H. Impact of a 6-week non-energy-restricted ketogenic diet on physical fitness, body composition and biochemical
parameters in healthy adults. Nutr Metab (Lond). 2017;14:17.
52. van Delft R, Lambrechts D, Verschuure P, Hulsman J, Majoie M. Blood
beta-hydroxybutyrate correlates better with seizure reduction due to ketogenic diet than do ketones in the urine. Seizure. 2010;19(1):36-9.
53. Van Der Ploeg GE, Withers RT, Laforgia J. Percent body fat via DEXA: comparison with a four-compartment model. J Appl Physiol (1985). 2003;94(2):499-506.
54. van Marken Lichtenbelt WD, Hartgens F, Vollaard NB, Ebbing S, Kuipers H. Body composition changes in bodybuilders: a method comparison. Med Sci Sports Exerc.
2004;36(3):490-7.
55. Vettor R, Milan G, Franzin C, Sanna M, De Coppi P, Rizzuto R, et al. The origin of intermuscular adipose tissue and its pathophysiological implications. Am J Physiol Endocrinol Metab. 2009;297(5):E987-98.
56. Volek JS, Phinney SD, Forsythe CE, Quann EE, Wood RJ, Puglisi MJ, et al.
Carbohydrate restriction has a more favorable impact on the metabolic syndrome than a low fat diet. Lipids. 2009;44(4):297-309.
57. Volek JS, Sharman MJ, Love DM, Avery NG, Gómez AL, Scheett TP, et al. Body composition and hormonal responses to a carbohydrate-restricted diet. Metabolism. 2002;51(7):864-70.
68. Westman EC, Yancy WS, Edman JS, Tomlin KF, Perkins CE. Effect of 6-month adherence to a very low carbohydrate diet program. Am J Med. 2002;113(1):30-6.
59. Williams JE, Wells JC, Wilson CM, Haroun D, Lucas A, Fewtrell MS. Evaluation of Lunar Prodigy dual-energy X-ray absorptiometry for assessing body composition in healthy persons and patients by comparison with the criterion 4-component model. Am J Clin Nutr. 2006;83(5):1047-54.
60. Wilson JM, Lowery RP, Roberts MD, Sharp MH, Joy JM, Shields KA, et al. The Effects of Ketogenic Dieting on Body Composition, Strength, Power, and Hormonal Profiles in
Resistance Training Males. J Strength Cond Res. 2017.
61. Yancy WS, Olsen MK, Guyton JR, Bakst RP, Westman EC. A low-carbohydrate,
ketogenic diet versus a low-fat diet to treat obesity and hyperlipidemia: a randomized, controlled trial. Ann Intern Med. 2004;140(10):769-77.
22
62. Zouhal H, et al. Inverse relationship between percentage body weight change and finishing time in 643 forty-two-kilometre marathon runners. Br j of sports med 2011; 45(14):1101-1105.
DISCUSSÃO GERAL E CONCLUSÕES
Os resultados do presente estudo mostraram que houve uma correlação significativa entre o percentual de massa magra e a variação do percentual de gordura ao longo de quatro avaliações da composição corporal a partir da reintrodução de carboidratos. Quanto maior a massa magra, maior foi a variação no percentual de gordura (correlação positiva).
Fomos capazes de detectar uma grande heterogeneidade na variação da composição corporal (percentual de gordura corporal) em um curto período de tempo (horas), um resultado, até onde sabemos inédito. Isto mostra que outros artigos que envolveram restrição de carboidratos podem ter levado os autores a chegarem a interpretações e conclusões erradas. Eles podem ter interpretado simples alterações nos indicadores de composição corporal advindas somente de variações no nível de glicogênio como sendo alterações persistentes e reais na massa gorda e magra. Até onde sabemos apenas um estudo teve o cuidado de tentar diferenciar mudanças da composição corporal resultantes de reais mudanças de massa magra e gorda das mudanças do nível de glicogênio. Porém, os autores usaram um período de ‘refeed’ com carboidratos muito longo, causando não somente a reposição de glicogênio (Muller et al. 2015), mas também um aumento real de massa gorda (Wilson et al. 2017).
Como possível justificativa na ausência de mudança de peso durante a reintrodução de carboidratos, ao contrário de outros estudos (Acheson et al. 1988), possivelmente se deveu ao curto período de quatro horas para reposição de glicogênio (Samaha et al. 2003, Yancy et al. 2004).
Na análise glicêmica, não houve diferença significativa na glicemia entre os voluntários durante o período do teste. Tendo em vista os fatores de exclusão que não admitiam pacientes pré-diabéticos, resistentes à insulina ou diabéticos, tal resultado era esperado. O mesmo reforça a homogeneidade na ‘resposta metabólica’ da amostra. Em alguns voluntários,a solução elaborada causou um aumento muito elevado da glicemia; alguns voluntários tiveram um pico acima de 200 mg/dL. Este valor excede o alcançado com a combinação de carboidratos, 80% de glicose e 20% de frutose (172 mg / dl), que causa o mais alto conhecido pico glicêmico (Akhavan e Anderson, 2007). A curva glicêmica encontrada na presente dissertação está de acordo com os valores demonstrados por artigos que utilizaram a maltodextrina e com metodologia similar (Englyst 1999; Slavin et al. 2009).
23
macronutrientes ad libidum, modelo observado em vários artigos (Brehm et al. 2003, Samaha et al. 2003, Yancy et al. 2004). Utilizamos tempo de restrição de carboidratos de três dias suficiente para promover a depleção máxima de glicogênio. Tempo maior do que este foi usado na maioria dos artigos (Minderico et al. 2007; Jabekk et al. 2010; Hall et al. 2016; Gomez-Arbelaez et al. 2016; Urbain et al. 2017), mas não gera redução dos estoques de glicogênio maiores do que o atingindo com três dias (Acheson et al. 1988).
Na nossa pesquisa, não separamos os indivíduos por sexo. A precisão da DXA poderia ser afetada pelo sexo, tamanho, gordura e estado de doença dos indivíduos ou diferentes grupos (Antonio et al. 2014). Sabe-se ainda que a DXA pode superestimar as diminuições de porcentagem de gordura corporal ou subestimar aumentos em porcentagem de gordura corporal (Flint et al. 1995). Uma alternativa seria comparar diferentes métodos na avaliação da composição corporal, como bioimpedância e pesagem hidrostática (Minderico et al. 2007).
A DXA é considerado a técnica “padrão ouro” pela maioria dos grupos que trabalham na composição corporal e foi usado no presente trabalho. O objetivo, na análise com a DXA, foi verificar possíveis alterações na composição corporal advindas de mudanças agudas no nível de glicogênio.
Este estudo possui algumas limitações. Em primeiro lugar, cabe mencionar o pequeno número de participantes, embora seja aceitável para estudos com metodologia similar (Merra et a. 2017l). Ocorreu abandono de voluntários durante os três dias de restrição de carboidrato, fenômeno notado também em estudos com metodologia similar (Coin et al. 2013; Merra et al. 2017). Dados de uma amostra maior, especialmente composta por indivíduos com baixo percentual de gordura corporal, enriqueceriam nossa compreensão. Todos os voluntários investigados neste estudo tinham um percentual de gordura corporal acima de 15%. Considerando que nossos dados mostraram que indivíduos com menor percentual de gordura corporal apresentam maior variação nos indicadores de composição corporal, é possível que uma população ‘mais magra’ apresente alteração significativa da composição corporal em resposta a mudanças no nível de glicogênio. Assim, nossos dados são insuficientes para mostrar um efeito claro e agudo (quatro horas) das soluções hiperglicídicas sobre a composição corporal.
Até onde temos conhecimento, este é o primeiro estudo que avaliou as alterações da composição corporal durante a fase inicial de reposição dos estoques de glicogênio a partir da reintrodução de carboidratos à dieta.
24
RECOMENDAÇÕES PARA ESTUDOS FUTUROS E CONCLUSÃO
Futuros estudos com precisão das alterações da composição corporal são relevantes para avaliar a contribuição da intervenção de dietas com restrição de carboidratos, não apenas no peso corporal total, mas nas mudanças no percentual de gordura e massa. Sobretudo com um acompanhamento de indivíduos com menor percentual de gordura.
Na associação dos presentes resultados com a avaliação de biomarcadores, como insulinemia, lipemia, cetonemia e taxa metabólica, poderia elucidar ainda mais os mecanismos por trás das alterações observadas da composição corporal. Quanto à análise das técnicas aplicadas na avaliação da composição corporal, seria relevante comparar a DXA com outras técnicas, como a bioimpedância, pesagem hidrostática e até mesmo adipometria por dobras cutâneas.
Conclui-se com este estudo que a reposição dos estoques de glicogênio a partir da reintrodução de carboidratos à dieta gera variações nos indicadores de composição corporal que são maiores em indivíduos com menor percentual de gordura. Estes dados evidenciam a importância de se padronizar o nível de glicogênio durante a avaliação da composição corporal por DXA, especialmente em indivíduos com baixo percentual de gordura. Além disso, o presente estudo indica que os indicadores de DXA têm o potencial para verificar mudanças nos estoques de glicogênio em indivíduos com baixo percentual de gordura, algo que requer métodos invasivos (como biópsia hepática e muscular) ou de alto custo (como ressonância nuclear magnética (Casey et al. 2000; Nieman et al. 2015; Rotman et al. 2000; Zehnder et al. 2001).
25
REFERÊNCIAS BIBLIOGRÁFICAS CITADAS EM PARTES NÃO PERTENCENTES AOS MANUSCRITOS
1. Antonio J, Peacock CA, Ellerbroek A, Fromhoff B, Silver T. The effects of consuming a high protein diet (4.4 g/kg/d) on body composition in resistance-trained individuals. J Int Soc Sports Nutr. 2014 May 12;11:19.
2. Casey A, Mann R, Banister K, Fox J, Morris P G, Macdonald I A, Greenhaff P L. Effect of carbohydrate ingestion on glycogen resynthesis in human liver and skeletal muscle, measured by 13 C MRS. American Journal of Physiology-Endocrinology and Metabolism. 2000. 278(1), E65-E75.
3. Fleming J A., Kris-Etherton, P M. Macronutrient Content of the Diet: What Do We Know About Energy Balance and Weight Maintenance?. Current obesity reports. 2016 5(2), 208-213.
4. Krssak, Martin. Intramuscular glycogen and intramyocellular lipid utilization during prolonged exercise and recovery in man: a 13C and 1H nuclear magnetic resonance spectroscopy study. The Journal of Clinical Endocrinology & Metabolism 85.2 2000 748-
5. Nieman D C, Shanely R A, Zwetsloot K A, Meaney, M P, Farris G E. Ultrasonic
assessment of exercise-induced change in skeletal muscle glycogen content. BMC sports science, medicine and rehabilitation. 2015 7(1), 9.
6. Zehnder M, Muelli M, Buchli R, Kuehne G, Boutellier U. Further glycogen decrease during early recovery after eccentric exercise despite a high carbohydrate
26
ANEXOS
ANEXO A – DADOS EXTRAS
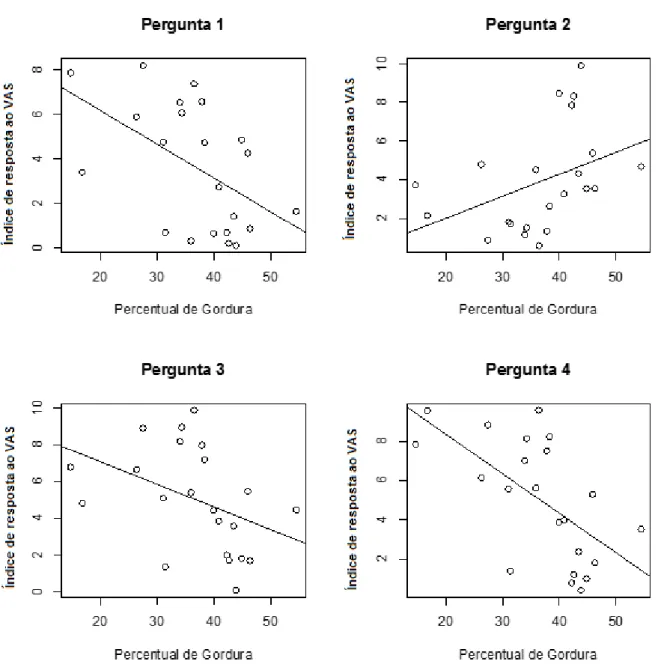
Os dados a seguir foram coletados e analisados no presente estudo, contudo, não foram utilizados para a escrita no manuscrito. Os mesmos servirão como base para um futuro artigo. Neles, utilizamos o questionário de escala visual analógica (VAS) (Flint et al. 2000) para determinar a fome, o apetite e a saciedade e a ambos. O teste não apresenta referência numérica e o voluntário marcava a resposta numa linha em um ponto que achava mais adequado. Posteriormente, utilizando uma régua, marcamos a resposta e adotamos o valor de 0 a 10 (a linha sem referência, marcada pelo voluntário, apresentava 10 cm). O questionário era composto por 4 perguntas: 1- O quanto você está com vontade de comer uma comida comum, não muito gostosa? 2- O quanto você se sente cheio? 3- O quanto você está com vontade de comer sua comida preferida neste momento? e 4- Quanto você aguentaria comer agora dessa comida preferida?
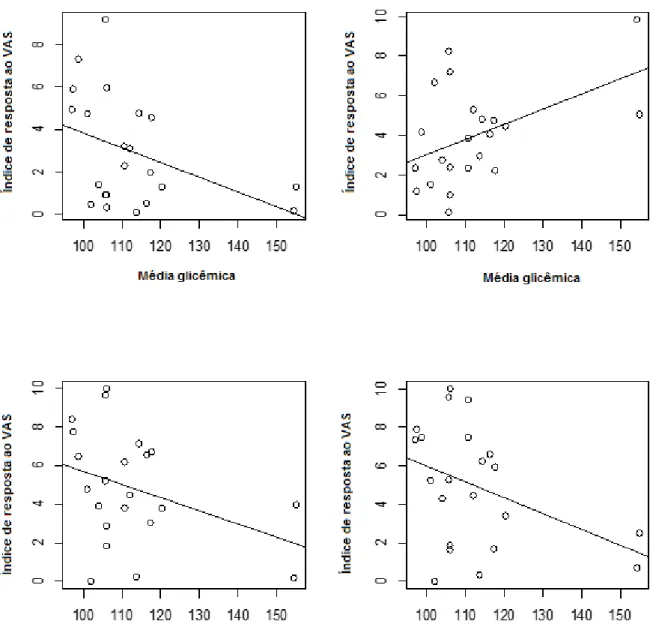
Correlacionamos os dados deste questionário com o percentual de gordura (%bf) inicial dos voluntários e a glicemia. A correlação do percentual de gordura inicial pelo valor da resposta no teste VAS apresentou significância estatística nas respostas das perguntas 1 e 4 (p = 0.013 e p = 0.002, respectivamente) (Figura1); os indivíduos com maior percentual de gordura apresentaram resposta menor para as respostas da intenção de comer e saciedade (eixo y: resposta de 0 a 10 para as perguntas, eixo x: percentual de gordura). Na correlação entre glicemia evalor da resposta no teste VAS, encontramos significância estatística para a resposta 2 (p = 0.024) (Figura 2); quanto maior o valor da glicemia, maior era a saciedade (eixo y: resposta de 0 a 10 para as perguntas, eixo x: valor médio da glicemia nos pontos avaliados). Para as demais perguntas, mesmo sem significância estatística, observamos uma tendência de redução na intenção de comer quando a glicemia apresentava-se aumentada. Estes dados levantam hipóteses a serem investigadas em estudos futuros.
Um eventual manuscrito contendo os dados de fome/apetite poderia ter como pergunta/objetivo, quantificar o efeito anorexígeno da glicemia em indivíduos com diferentes composições corporais, algo que não está completamente compreendido na literatura (Bloom et al. 2006, Farshchi et al. 2004, Rosén et al. 2009, Smeets et al. 2008, Smeets et al. 2008 e Veldhorst et al. 2009).
27
Figura 1 - Correlação do percentual de gordura pela resposta do questionário VAS. Pergunta 1 (p = 0.01388)*, pergunta 2 (p = 0.06197), pergunta 3 (p = 0.05532) e pergunta 4 (p = 0.002147)*. *significância estatística.
28
Figura 2 - Correlação da glicemia pela resposta do questionário VAS. Pergunta 1 (p = 0.05843), pergunta 2 (p = 0.02459)*, pergunta 3 (p = 0.09769) e pergunta 4 (p = 0.06332). *significância estatística.
29
31
32
ANEXO D - DECLARAÇÃO DA INSTITUIÇÃO FACULDADEANHANGUERA DE BRASÍLIASOBRE INFRAESTRUTURA
O diretor da Faculdade Anhanguera de Brasília, situada em Taguatinga Sul– DF,está de acordo com a realização de captação oral de voluntários para a pesquisa “Avaliação da alteração na composição corporal em indivíduos submetidos à restrição de carboidratos e após ingestão de carboidratos de rápida digestão” de responsabilidade do pesquisador Krain Santos de Melo, para dissertação do mestrado após aprovação pelo Comitê de Ética em Pesquisa com seres humanos da Faculdade de Ciências da Saúde da Universidade de Brasília.
O estudo envolve voluntários, de ambos os sexos,maiores de 18 anos (realização de questionários e coletas sanguíneas).Terá duração de cinco semanas, com o início previsto para março e será realizado no laboratório de Biofísica e Fisiologia da Faculdade de Ciências da Saúde da Universidade de Brasília.
Brasília,
Diretor responsável Assinatura e
carimbo
Pesquisador responsável pela pesquisa
Assinatura e carimbo
33
ANEXO E - DECLARAÇÃO DA INSTITUIÇÃO UNB SOBRE
INFRAESTRUTURA
O diretor da Universidade de Brasília– Faculdade de Ceilândia (FCE), Araken dos Santos Werneck Rodrigues e coordenadora do curso de pós-graduação Diana Lúcia Moura Pino, estão de acordo com a realização da pesquisa “Avaliação da alteração na composição corporal em indivíduos submetidos à restrição de carboidratos e após ingestão de carboidratos de rápida digestão”, de responsabilidade do pesquisador Krain Santos de Melo, que tem como objetivo avaliar o efeito do nível de glicogênio sobre a avaliação da composição corporal (percentual de gordura, massa magra e massa gorda) pela DEXA, dobras cutâneas e bioimpedância, em indivíduos na situação de baixo estoque de glicogênio e após a reingestão de carboidratos de rápida digestão e absorção (solução de maltodextrina e sacarose),após aprovação pelo Comitê de Ética em Pesquisa com Seres Humanos da Faculdade de Ciências da Saúde da Universidade de Brasília.
O estudo envolve voluntários, de ambos os sexos, maiores de 18 anos (realização de questionários e coletas sanguíneas).Terá duração de cinco semanas,com o início previsto para março e será realizado no laboratório de Biofísica e Fisiologia da Faculdade de Ciências da Saúde da Universidade de Brasília.
Brasília,
Diretor responsável da Faculdade
Araken dos Santos Werneck Rodrigues
Coordenador do Curso de Pós Graduação Diana Lúcia Moura
Pinho
Pesquisador Responsável pelo protocolo de pesquisa
34
ANEXO F - TERMO DE RESPONSABILIDADE E COMPROMISSO DO(S) PESQUISADOR(S) RESPONSÁVEL (IS)
Eu, Krain Santos de Melo, pesquisador responsável pelo projeto “Avaliação da alteração na composição corporal em indivíduos submetidos à restrição de carboidratos e após ingestão de carboidratos de rápida digestão”, declaro estar ciente e que cumprirei os termos da Resolução 466/2012 do Conselho Nacional de Saúde do Ministério da Saúde e declaro: (a) assumir o compromisso de zelar pela privacidade e sigilo das informações; (b) tornar os resultados desta pesquisa públicos sejam eles favoráveis ou não; e, (c) comunicar o CEP/FCE sobre qualquer alteração no projeto de pesquisa, nos relatórios anuais ou por meio de comunicação protocolada, que me forem solicitadas.
Brasília,10 de fevereiro de 2017