Cop
yright
© AE&M all rights r
eser
ved.
1 Division of Endocrinology,
Diabetes and Metabolism, Hospital de Santo António – Centro Hospitalar do Porto, Porto, Portugal
2 Department of Clinical Pathology,
Hospital de Santo António – Centro Hospitalar do Porto, Porto, Portugal Correspondence to:
Maria Teresa Rocha e Pinho Pereira Division of Endocrinology, Diabetes and Metabolism, Hospital Santo António, Largo Prof. Abel Salazar 4099-001 – Porto, Portugal teresa.rocha.pereira@gmail.com Received on June/8/2014 Accepted on Apr/16/2015
DOI: 10.1590/2359-3997000000043
Seasonal variation of haemoglobin
A1c in a Portuguese adult population
Maria Teresa Rocha e Pinho Pereira1, Domingos Lira1, Conceição
Bacelar1, José Carlos Oliveira2, André Couto de Carvalho1
ABSTRACT
Objective: Haemoglobin A1c (Hb A1c) is routinely used for monitoring glycemic control in patients
with diabetes. Hb A1c seasonal fluctuations can be directly related to different biological, geographi-cal and cultural influences. Our purpose was to evaluate seasonal variation of Hb A1c in a hospital-based adult population over a period of 5 years. Materials and methods: We analyzed retrospec-tively monthly Hb A1c mean values (DCCT, %) based on all the assays performed to adult patients at a tertiary care university Portuguese hospital between 2008-2012. Results: We obtained 62,384 Hb A1c valid measurements, with a peak level found in January-February (7.1%), a trough in August-October (6.8%) and an average peak-to-trough amplitude value of 0.3%. This trend was observed in both genders and age subgroups evaluated. Conclusions: There is a Hb A1c circannual seasonal pat-tern with peak levels occurring in winter months in this Portuguese population. This finding should be recognized in daily clinical practice to warrant better clinical and epidemiological interpretation of Hb A1c values. Arch Endocrinol Metab. 2015;59(3):231-5
Keywords
Seasonal variation; haemoglobin A1c; blood glucose
INTRODUCTION
T
he achievement of an adequate glycemic control is crucial in preventing chronic complications in diabetes (1). Haemoglobin A1c (Hb A1c) is a marker of the average blood glucose levels in the past 90 days and is commonly used as a predictor of diabetic com-plications (2,3).Several human physiologic parameters are known to be influenced by seasonal cycles(4). Some, as blood pressure levels, heart rate, lipid profile, insulin and cor-tisol serum levels are also factors associated to the de-velopment of many diseases and cardiovascular events (5-9). Seasonal changes on type 1 diabetes incidence have also been reported in literature, with new onset cases diagnosed more commonly during winter months (10). Many influences have been linked to these oc-currences such as increased viral infections incidence, amount of exercise taken, vitamin D serum concentra-tions, hormonal fluctuations as well as increased insulin sensitivity during summer (10,11). This variation pat-tern seems to be associated with the geographic
loca-tion, particulary when different latitudes and respective temperature variations between winter and summer are considered (11,12). It has been suggested that seasonal fluctuations also occur in glycemic control in both type 1 and type 2 diabetic patients (13-17). There are seve-ral epidemiological reports coming from different geo-graphic areas that exhibit clinical relevant Hb A1c cir-cannual fluctuations (15,16,18,19). Most of them were performed in the northern hemisphere, with higher Hb A1c levels found in winter colder months and lo-wer values during summer time. The exact mechanism through which different seasons would induce changes on Hb A1c levels is not fully understood. The availa-ble data suggest that there is a complex of potential environmental, biologic and cultural factors implicated (especially festive-food intake patterns, physical activity or even exposure to sunlight).
In Portugal, to the best of our knowledge, there are no published data concerning this issue. Our purpose was to evaluate Hb A1c variation across different mon-ths for a five year-period (2008-2012) and to confirm the presence of any seasonal effect.
Cop
yright
© AE&M all rights r
eser
ved.
MATERIALS AND METHODS
We retrieved data from the electronic medical records of Hospital Santo Antonio – Centro Hospitalar do Porto, a tertiary care university hospital center in the northern of Portugal (latitude 41º 08’ North) from 1st January 2008 to 31st December 2012. Mean local temperature ranged during this time between an aver-age minimum and maximum of 5.2ºC and 25.7ºC in January and August, respectively (20). The data col-lected were unidentified and included only age, sex, date of blood collection and Hb A1c levels. In total, we collected 63,785 Hb A1c measurements and re-tained 62,384 after excluding both extreme values (< 3% and/or > 18%) and patients younger than 18 years-old. All Hb A1c results are expressed in percentage (%) using the National Glycohemoglobin Standardization Program/Diabetes Control and Complications Trial (NGSP/DCCT) certified method and were performed on ethylenediamine tetra-acetic acid (EDTA) blood specimens using cation-exchange high performance liquid chromatography (HPLC) Adams A1c HA-8160, Diabetes Mode equipment (Arkray, Inc., Kyoto, Japan). This method did not change over the 5-year study period. The mean Hb A1c and the 95% confi-dence interval (CI) were calculated for each month as well as the prevalence of Hb A1c values above 6.5 and 9.0%. The subjects were further classified into gender and age subgroups (< 35-yr, 35 to 64-yr and ≥ 65-yr). To determine whether there were differences between
the monthly means, Kruskal-Wallis with post hoc analy-sis using Dunn’s test were used. Comparisons between distinct Hb A1c prevalence cut-points were performed by using X2 test. Statistical analysis was performed using GraphPad Prism version 6.0 (GraphPad Software, Inc., La Jolla, California, USA) and differences were consid-ered to be statistically significant at p < 0.05 level.
RESULTS
Over the period between January 2008 and December 2012 we analyzed a total of 62,384 Hb A1c records corresponding, in average to 1,039 per month. Gender distribution was almost even (49% women). Patient’s age ranged from 19 to 104 years-old with the following dispersion: < 35-yr, 7.5% (n = 4,679); 35-64-yr, 51.1% (n = 31,878); and ≥ 65-yr, 41.4% (n = 25,827). The overall mean Hb A1c was 6.9 ± 1.7% (95% CI, 6.9-7.0%).
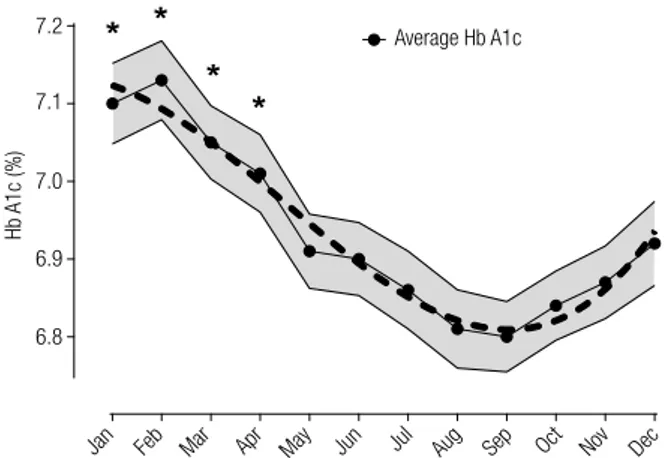
Evaluating month-dependent data we have found a consistent Hb A1c cyclical fluctuation (repeated over the five years) with higher average values observed in January and February (peak of 7.1 ± 1.9% in February) and gradually decline after spring-summer months until August to October (nadir of 6.8 ± 1.7% in September) (Table 1). A significant growing trend (p < 0.0001) was detected from October till February with a mean peak-to-trough variation between February and September of about 0.3% (Figure 1). No differences were found between consecutive months. The same seasonal trend
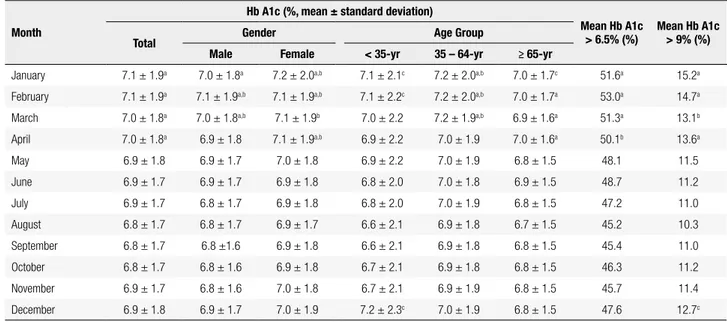
Table 1. Monthly mean Hb A1c value in a Portuguese hospital-based adult population from January 2008 to December 2012 (n = 62,384)
Month
Hb A1c (%, mean ± standard deviation)
Mean Hb A1c
> 6.5% (%) Mean Hb A1c > 9% (%)
Total Gender Age Group
Male Female < 35-yr 35 – 64-yr ≥ 65-yr
January 7.1 ± 1.9a 7.0 ± 1.8a 7.2 ± 2.0a,b 7.1 ± 2.1c 7.2 ± 2.0a,b 7.0 ± 1.7c 51.6a 15.2a February 7.1 ± 1.9a 7.1 ± 1.9a,b 7.1 ± 1.9a,b 7.1 ± 2.2c 7.2 ± 2.0a,b 7.0 ± 1.7a 53.0a 14.7a March 7.0 ± 1.8a 7.0 ± 1.8a,b 7.1 ± 1.9b 7.0 ± 2.2 7.2 ± 1.9a,b 6.9 ± 1.6a 51.3a 13.1b
April 7.0 ± 1.8a 6.9 ± 1.8 7.1 ± 1.9a,b 6.9 ± 2.2 7.0 ± 1.9 7.0 ± 1.6a 50.1b 13.6a May 6.9 ± 1.8 6.9 ± 1.7 7.0 ± 1.8 6.9 ± 2.2 7.0 ± 1.9 6.8 ± 1.5 48.1 11.5 June 6.9 ± 1.7 6.9 ± 1.7 6.9 ± 1.8 6.8 ± 2.0 7.0 ± 1.8 6.9 ± 1.5 48.7 11.2 July 6.9 ± 1.7 6.8 ± 1.7 6.9 ± 1.8 6.8 ± 2.0 7.0 ± 1.9 6.8 ± 1.5 47.2 11.0 August 6.8 ± 1.7 6.8 ± 1.7 6.9 ± 1.7 6.6 ± 2.1 6.9 ± 1.8 6.7 ± 1.5 45.2 10.3 September 6.8 ± 1.7 6.8 ±1.6 6.9 ± 1.8 6.6 ± 2.1 6.9 ± 1.8 6.8 ± 1.5 45.4 11.0 October 6.8 ± 1.7 6.8 ± 1.6 6.9 ± 1.8 6.7 ± 2.1 6.9 ± 1.8 6.8 ± 1.5 46.3 11.2 November 6.9 ± 1.7 6.8 ± 1.6 7.0 ± 1.8 6.7 ± 2.1 6.9 ± 1.9 6.8 ± 1.5 45.7 11.4 December 6.9 ± 1.8 6.9 ± 1.7 7.0 ± 1.9 7.2 ± 2.3c 7.0 ± 1.9 6.8 ± 1.5 47.6 12.7c
Cop
yright
© AE&M all rights r
eser
ved.
ter the warmer summer months, reflecting plasma glu-cose excursions throughout the previous 2-3 months, with a mean absolute amplitude between winter-sum-mer of 0.3%.
Our data are consistent with previous reports as-sessing seasonal variation of Hb A1c. Most of these works were performed in western countries from the northern hemisphere, where similar Hb A1c circan-nual fluctuation patterns, with higher levels during cooler autumn-winter months and lower levels during warmer summer-spring time, were described in both children and adult individuals with or without diabe-tes (14,16,18,21-23). In the United Stadiabe-tes, Tseng and cols. noted that Hb A1c peak and trough was found in January-February and September-October months, respectively, with a mean amplitude of 0.22% (16). Furthermore, they documented that this seasonal va-riation was accentuated at higher latitudes areas whe-re gwhe-reater temperatuwhe-re diffewhe-rences between winter and summer also occur. Likewise in adult diabetic patients from Sweden, Asplund reported its highest values in January (7.61%) and its lowest values in July (7.23%), with an amplitude of 0.38% (14). More recently, Kim and cols. analyzed Hb A1c seasonal variations in a large scale population of Korean patients with type 2 diabetes
mellitus and also found a peak in February-March (late
win ter-early spring) and a trough in September-Octo-ber (early autumn) with a negative correlation with ave-rage daily temperature and an amplitude range 0.16% to 0.25% (24). Likewise, a neighboring Spanish paper of Escribano-Serrano and cols. has documented higher mean Hb A1c values in January (7.01%) and minimal values in October (6.74%), with a significant magnitude of 0.27% (25). In contrast, another study also
under-Figure 1. Time series plot of average Hb A1c (%) obtained from data
between January-2008 and December-2012. Gray interval represent 95% confidence value for each monthly mean Hb A1c. Dashed line describe a polynomial best-fit curve for mean Hb A1c (R2 = 0.94). * p <
0.001 vs. August, September and October.
Figure 2. Time series plot of Hb A1c data (mean ± standard error of the mean) between January-2008 and December-2012 based on gender and age
sub-groups. (A) Mean Hb A1c level in all subjects (global) and grouped by gender (female/male). Solid line: best fit curve for all subjects; dashed line: for
female; and dotted line: for male population. (B) Mean Hb A1c level presented by age group (< 35-yr, 35 to 64-yr and ≥ 65-yr). Solid line: best fit curve
for subjects less than 35-yr old; dashed line: for those between 35 and 64-yr; and dotted line: for those older than 65-yr. * p < 0.05 vs. September (for both genders and all age groups); ** p < 0.05 vs. September (only for 35-64-yr and ≥ 65-yr group); *** p < 0.05 vs. September (only for ≥ 65-yr group).
Average Hb A1c 7.2 7.1 7.0 6.9 6.8
Jan Feb Mar Apr May Jun Jul Aug Sep Oct Nov Dec
Hb A1c (%) 7.4 B 7.2 < 35-yr 35-64-yr ≥ 65-yr Global Female Male 7.0 6.8 6.6
Jan Feb Mar Apr May Jun Jul Aug Sep Oct Nov Dec Jan Feb Mar Apr May Jun Jul Aug Sep Oct Nov Dec
Hb A1c (%) 7.4 A 7.2 7.0 6.8 6.6 Hb A1c (%)
was found when evaluating prevalence fluctuations of Hb A1c values greater than 6.5 or 9.0%, with higher dimension in January-February and lower proportion between August-September (p < 0.001) (Table 1). Time series analysis with age and sex subgroups shared this same seasonal trend with higher Hb A1c levels in January till April when comparing with its nadir in Sep-tember (p < 0.05) (Figure 2).
DISCUSSION
In our temperate northern Portuguese climate Hb A1c levels among an hospital-based population present a circannual cyclical pattern with peaks in mid-summer and troughs in late-summer. Monthly averages Hb A1c were significantly higher during the cooler winter months of January-February and lower immediately
af-Cop
yright
© AE&M all rights r
eser
ved.
taken in the southern Spain, the authors found a slight fluctuation of Hb A1c levels (highest value in February and the lowest in July, 7.3% and 7.1%, respectively), but with a small range of inter-monthly variation and without any significant seasonal effect (26). We specu-late that this discrepancy observed between these two regions with similar latitude and average temperatures may be due to some differences found in their metho-dological approach and population size. Additionally, the gender and age subgroup analysis that was carried out by us was also consistent with other reports. Saku-ra and cols., in Japan, have showed a clear sinusoidal seasonal pattern of Hb A1c levels fluctuation (peak in March and trough in August) with female and young subjects presenting a significantly greater amplitude of Hb A1c variation than males and elderly patients (27). Our results shared some this observed tendency, with a higher Hb A1c peak-to-trough amplitude (~0.5%) in the youngest age subgroup (< 35 yr-old).
Similar circannual patterns were also reported for other metabolic features and hormones, suggesting that these variations may result from a complex phy-siological response to some seasonal environmental elements (21,23). Cold and other climate conditions have been explored as potential enhancing factors un-derlying to these cyclical physiological variations. Seve-ral authors suggested that the plasma glucose increase observed during winter months may result from an in-nate physiological homeostatic response that includes a normal thermoregulatory body strategy against cold (23). Available evidence concerning this issue point to a direct effect of low ambient temperature exposure on metabolic axis through consequent rise in counter regulatory hormones concentrations during cold stress (7,28). This rise of blood glucose levels could be as-sociated with an increased need of heat production that could be achieved by increasing serum morning cortisol, epinephrine, thyroid hormones, glucagon and growth hormone concentrations (29). Intrinsic season--related effects and changes on carbohydrate metabo-lism, particularly on gluconeogenesis, were also descri-bed in cold-adapted rats exposed to low temperatures (30). Rises in serum cortisol levels and increase tissue sensitivity to glucocorticoids is a recognized effect du-ring cold months that could account for some of the body fat gain and consequent insulin resistance also observed over winter (5,31). Likewise, several human seasonal nutritional characteristics, such as the excessive caloric intake during winter festivities, and cultural
as-pects, such as simultaneous decreased physical activity, are known to be associated to an increase of adiposity with secondary insulin resistance establishment during this period (15). Some previous studies have showed that this seasonal variation in physical activity is coin-cident with other circannual fluctuations in physiologi-cal markers such as lipid profile, blood pressure, bone mineral density and psycho-affective disorders changes (32). Other theories have been proposed to explain this phenomenon which included greater frequency of minor viral infections, changes in host susceptibility to infection and seasonal occurrence of some psycho-logical alterations (11). In an attempt to control cli-mate influence on glycemic control Hawkins examined the Hb A1c circannual variation in a tropical country with no significant temperature variation (33). Their results failed to reveal any seasonal pattern and reinfor-ced the deleterious effect of dietary indiscretion during festivities in glycemic control. Recently, other authors pointed out for the inverse association between serum 25-(OH)-vitamin D and glycemic metabolism, sug-gesting that this sun-dependent hormone might have some direct intervention on glucose homeostasis and therefore be also implicated in the Hb A1c circannual fluctuation (34,35).
Our study has some limitations. First, it is based on a retrospective analysis from data extracted through a patient computer database. As such, we cannot con-sider for evaluation other potentially confounding fac-tors than the ones available and presented here (age and gender). Second, the studied population may have some age and metabolic characteristics that does not allow us to extrapolate these results to other different populations of healthy individuals or adults with glyce-mic disorders. On the other hand, we highlight the lar-ge number (over 60,000) of Hb A1c evaluations evalua-ted that came from a single hospital center with a stable patient population and analytical methodology practice.
In conclusion, this study has described a circannual pattern of Hb A1c levels in adult subjects of northern Portugal with a peak in January-February, nadir in Au-gust-October and a mean amplitude of 0.3%. Health providers and researchers must be aware of this Hb A1c seasonal variation and consider adjusting epidemiolo-gical and clinical decisions to the local season, climate and calendar festivities circumstances. Special concern should be present when using Hb A1c levels to diag-nose diabetes mellitus in temperate countries where the presence of a significant peak-to-trough amplitude
Cop
yright
© AE&M all rights r
eser
ved.
could easily misdiagnose patients over distinct months. This study also emphasizes the need for more efficient methods to overcome culture and dietary barriers pre-sent during winter holidays.
Disclosure: no potential conflict of interest relevant to this article was reported.
REFERENCES
1. McGill M, Felton AM; Global Partnership for Effective Diabetes Management. New global recommendations: a multidisciplinary approach to improving outcomes in diabetes. Prim Care Diabe-tes. 2007;1(1):49-55.
2. UK Prospective Diabetes Study. IV. Characteristics of newly pre-senting type 2 diabetic patients: male preponderance and obesity at different ages. Multi-center Study. Diabet Med. 1988;5(2):154-9. 3. The effect of intensive treatment of diabetes on the development
and progression of long-term complications in insulin-dependent diabetes mellitus. The Diabetes Control and Complications Trial Research Group. N Engl J Med. 1993;329(14):977-86.
4. Mavri A, Guzic-Salobir B, Salobir-Pajnic B, Stare J, Stegnar M. Seasonal variation of some metabolic and haemostatic risk fac-tors in subjects with and without coronary artery disease. Blood Coagul Fibrinolysis. 2001;12(5):359-65.
5. Walker BR, Best R, Noon JP, Watt GC, Webb DJ. Seasonal varia-tion in glucocorticoid activity in healthy men. J Clin Endocrinol Metab. 1997;82(12):4015-9.
6. Donahoo WT, Jensen DR, Shepard TY, Eckel RH. Seasonal variation in lipoprotein lipase and plasma lipids in physically active, nor-mal weight humans. J Clin Endocrinol Metab. 2000;85(9):3065-8. 7. Kristal-Boneh E, Froom P, Harari G, Malik M, Ribak J. Summer-winter differences in 24 h variability of heart rate. J Cardiovasc Risk. 2000;7(2):141-6.
8. Urbansky HF. Role of circadian neuroendocrine rhythms in the control of behavior and physiology. Neuroendocrinology. 2011;93(4):211-22.
9. Spencer FA, Goldberg RJ, Becker RC, Gore JM. Seasonal distribu-tion of acute myocardial infarcdistribu-tion in the second Nadistribu-tional Registry of Myocardial Infarction. J Am Coll Cardiol. 1998;31(6):1226-33. 10. Cantorna MT. Vitamin D and autoimmunity: is vitamin D status an
environmental factor affecting autoimmune disease prevalence? Proc Soc Exp Biol Med. 2000;223(3):230-3.
11. Moltchanova EV, Schreier N, Lammi N, Karvonen M. Seasonal variation of diagnosis of type 1 diabetes mellitus in children worldwide. Diabet Med. 2009;26(7):673-8.
12. Mortensen HB, Vestermark S, Kastrup KW. Metabolic control in children with insulin dependent diabetes mellitus assessed by haemoglobin A1c. Acta Paediatr Scand. 1982;71(2):217-22. 13. Maguire GA, Edwards OM. Seasonal variation in glycated
hae-moglobin in diabetics. Ann Clin Biochem. 2001;38(1):59-60. 14. Asplund J. Seasonal variation of HbA1c in adult diabetic patients.
Diabetes Care. 1997;20(2):234.
15. Sohmiya M, Kanazawa I, Kato Y. Seasonal changes in body com-position and blood HbA1c levels without weight change in male patients with type 2 diabetes treated with insulin. Diabetes Care. 2004;27(5):1238-9.
16. Tseng CL, Brimacombe M, Xie M, Rajan M, Wang H, Kolassa J, et al. Seasonal patterns in monthly hemoglobin A1c values. Am J Epidemiol. 2005;161(6):565-74.
17. Liang WW. Seasonal changes in preprandial glucose, A1C, and blood pressure in diabetic patients. Diabetes Care. 2007;30(10):2501-2.
18. Gikas A, Sotiropoulos A, Pastromas V, Papazafiropoulou A, Apostolou O, Pappas S. Seasonal variation in fasting glucose and HbA1c in patients with type 2 diabetes. Prim Care Diabetes. 2009;3(2):111-4.
19. Higgins T, Saw S, Sikaris K, Wiley CL, Cembrowski GC, Lyon AW, et al. Seasonal variation in hemoglobin A1c: Is it the same in both hemispheres? J Diabetes Sci Technol. 2009;3(4):668-71.
20. The Portuguese Sea and Atmosphere Institute (a government orga-nization). (2015). Available from: http://www.ipma.pt. Accessed on: June 1, 2014.
21. Garde AH, Hansen AM, Skovgaard LT, Christensen JM. Seasonal and biological variation of blood concentrations of total choles-terol, dehydroepiandrosterone sulfate, haemoglobin A(1c), IgA, prolactin, and free testosterone in healthy women. Clin Chem. 2000;46(4):551-9.
22. Jarrett RJ, Murrells TJ, Shipley MJ, Hall T. Screening blood glu-cose values: effects of season and time of day. Diabetologia. 1984;27(6):574-7.
23. MacDonald MJ, Liston L, Carlson I. Seasonality in glycosylated haemoglobin in normal subjects. Does seasonal incidence in insulin-dependent diabetes suggest specific etiology? Diabetes. 1987;36(3):265-8.
24. Kim Y, Park S, Yi W, Yu KS, Kim TH, Oh TJ, et al. Seasonal variation in hemoglobin A1c in Korean patients with type 2 diabetes mel-litus. J Korean Med Sci. 2014;29(4):550-5.
25. Escribano-Serrano J, García-Domínguez L, Díaz-Pintado-García MT, Salaya-Algarin G. Seasonal variation in glycated haemoglo-bin A1c (HbA(1c)) determinations. Aten Primaria. 2012;44(2):121-2. 26. Gomez-Huelgas R, Santamaria-Fernandez S, Guijarro-Merino R,
Navajas-Luque F, Tinahones FJ, San Roman-Teran CM, et al. Sea-sonal variability of glycated hemoglobin in a diabetic population from southern Europe. J Diabetes Complications. 2013;27:618-20. 27. Sakura H, Tanaka Y, Iwamoto Y. Seasonal fluctuations of glycated
hemoglobin levels in Japanese diabetic patients. Diabetes Res Clin Pract. 2010;88:65-70.
28. Woodhouse PR, Khaw KT, Plummer M. Seasonal variation of blood pressure and its relationship to ambient temperature in an elderly population. J Hypertens. 1993;11(11):1267-74.
29. Bittel JH. Heat debt as an index for cold adaptation in men. J Appl Physiol. 1987;62(4):1627-34.
30. Kuroshima A, Kurahashi M, Doi K, Ono T, Fukita I. Effect of cold adaptation and high-fat diet on cold resistance and meta-bolic responses to acute cold exposure in rats. Jpn J Physiol. 1974;24(3):277-92.
31. Hansen AM, Garde AH, Skovgaard LT, Christensen JM. Seasonal and biological variation of urinary epinephrine, norepinephrine, and cortisol in healthy women. Clin Chim Acta. 2001;309(1):25-35. 32. Matthews CE, Freedson PS, Hebert JR, Stanek EJ 3rd, Merriam
PA, Rosal MC, et al. Seasonal variation in household, occupation-al, and leisure time physical activity: longitudinal analyses from the seasonal variation of blood cholesterol study. Am J Epide-miol. 2001;153(2):172-83.
33. Hawkins RC. Circannual variation in glycohemoglobin in Singa-pore. Clin Chim Acta. 2010;411(1-2):18-21.
34. Forouhi NG, Luan J, Cooper A, Boucher BJ, Wareham NJ. Base-line serum 25-hydroxy vitamin D is predictive of future glycemic status and insulin resistance: the Medical Research Council Ely Prospective Study. 1990-2000. Diabetes. 2008;57(10):2619-25. 35. Zhao G, Ford ES, Li C. Associations of serum concentrations of
25-hydroxyvitamin D and parathyroid hormone with surrogate markers of insulin resistance among U.S. Adults without physi-cian-diagnosed diabetes: NHANES, 2003-2006. Diabetes Care. 2010;33(2):344-7.