Physical Stability of a Lactose-Trehalose Matrix for
Nano-Encapsulation of -Carotene by Spray-Drying
Hugo Ricardo Dias Barreto
Dissertação para obtenção do Grau de Mestre em
Engenharia Alimentar
Orientadora: Prof. Maria Luísa D.M. Beirão da Costa
Orientador Externo: Prof. Yrjö H. Roos
Is olc an chearc nach scríobann di féin.
I
ACKNOWLEDGEMENTS
To Professor Yrjö H. Roos for accepting me as his student, allowing me an opportunity to work abroad and providing me with a fulfilling learning experience, while being always willing to learn from his students.
To Professor Maria Luísa Beirão da Costa and Doctor Margarida Moldão Martins, of the Instituto Superior de Agronomia (Higher Institute of Agronomy) of Lisbon, for their guidance through the first stages of the project and invaluable assistance in writing and analysing the results.
To Dr. Mohammed Kamrul Haque, for guiding me through the laboratory work, and for putting all his theoretical and practical experience at my disposal.
To Mr. Dave Waldron, for having all the answers.
To Thérèse Uniacke, Jonathan O’Regan and Sinéad Heffernan for taking the time to assist me in operating the instruments needed for this project.
To Dr. Alan Kelly, Kaushal Kothari and Antonio Sullo for being extremely helpful in critical moments, probably without knowing it, just by being kind and easy going.
To Jim McNamara, Donal Humphreys and Maurice Conway for a remarkable skill on solving every possible problem on the department, including the ones I created myself.
To Wenbin Lu, Liam O’Connell, Nattiga Silalai, Sandrine Macé, and Feli Ronda, even though we all had our own individual projects, there was always a chance to learn from each other. Above all that, thanks for the great lab work atmosphere and the great multicultural experience.
To Brendan, Patrick, Michael and Hester… sometimes friendship at the end of an exhausting day comes from the most unexpected sources.
To Pedro Oliveira for unlimited kindness and friendship, sheltering me in every sense, during my early days in Cork.
II
To my Mother and Grandmother for supporting and enduring my ambitions, and to my Father for the inspiring pride in my decision to experiment a different country.
To my Daniela, for her unconditional support, keeping me motivated for the project, while providing me with plenty of motives to go back home.
III
ABSTRACT
The purpose of this work was to study the physical properties of a model sugar system of lactose and trehalose, related to its potential as an encapsulation matrix. The encapsulation was accomplished by spray-drying of an oil-in-water emulsion, with an oil phase with high content of β-carotene, representing the encapsulated molecule. This study aimed to relate the water content of the matrix sugars with the variation of
the glass transition temperature (Tg) and the occurrence of crystallization over time.
The influence of these changes on the structure of the rehydrated emulsion and the carotene content of the powder were also to be assessed. Characterization of physical changes was made by describing sorption behaviour, physical structure of the reconstituted emulsion from the encapsulate, determination of the thermal transition by DSC, DMA and DEA, and microscopical observation of the stored spray-dried powder.
It was shown that the matrix remains stable if kept under an aw of 0.33 or lower.
Higher figures may lower the glass transition to below room temperature, causing spontaneous crystallization and collapse of the matrix structure, thus affecting the flowability of the encapsulate and exposing carotene to the environment. Sorption data of the spray-dried powder fitted fairly to the BET and GAB isotherms, indicating a monolayer moisture of 4.64% and 3.21%, respectively. DSC analysis on lactose-trehalose model sugar systems showed a glass transition temperature of 107.9ºC for anhydrous sample, 55.2ºC for 11% RVP storage and 30,2ºC for 33% RVP. These results could not be correlated to the results from DMA and DEA analysis, due to the highly irregular results shown by these methods. It is suggested that these methods
are inadequate for hydrated samples with high Tg.
The droplet sizes obtained with ultra-high pressure homogenization, and the physical stability of the lactose-trehalose amorphous matrix are satisfactory. However, it is still necessary to study the encapsulation efficiency of this matrix on this kind of core material, with more appropriate quantitative methods. As for DMA and DEA analysis, further development of the method is needed to establish a reliable relation with the DSC results.
IV
RESUMO
Este trabalho teve como objectivo o estudo das alterações físicas de uma mistura-modelo de partes iguais de lactose e trealose, na perspectiva da sua aplicação como
matriz de encapsulamento para β-caroteno. O sistema de encapsulamento
considerado neste projecto é uma dispersão de óleo vegetal em água, em que o óleo
contém β-caroteno e a água contém a matriz dissolvida e caseinato de sódio, que
actuou como emulsionante. O encapsulado seco foi produzido por secagem da emulsão em spray-drier.
As alterações físicas estudadas estão geralmente associadas às transições térmicas, nomeadamente a temperatura de transição vítrea. Acima desta temperatura, a mobilidade molecular torna-se suficiente para que a matriz cristalize, reduzindo irreversivelmente o efeito de barreira da matriz. O objectivo do estudo foi o de relacionar o teor de humidade na matriz amorfa com a variação da temperatura de
transição vítrea (Tg) e a ocorrência de cristalização ao longo do tempo. A influência
dessas alterações na matriz foi depois relacionada com a variação do teor de caroteno à superfície do encapsulado e a variação da estrutura física da emulsão reconstituída por hidratação.
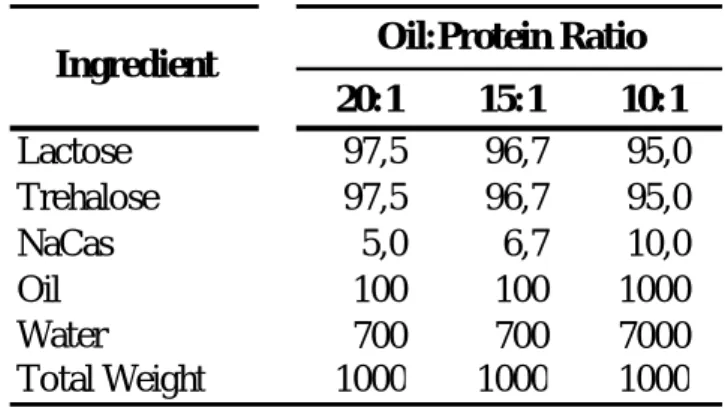
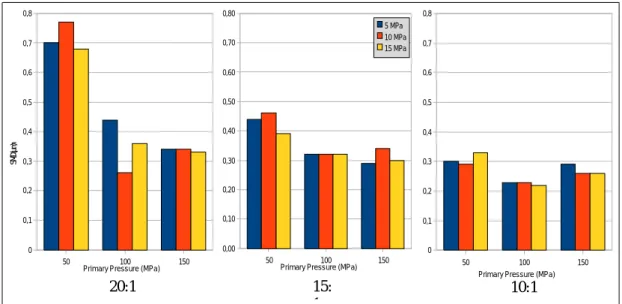
Previamente à secagem da emulsão, esta foi optimizada, no que respeita à concentração de caseinato de sódio e parâmetros de homogeneização. Foi utilizada uma tecnologia de homogeneização emergente, em que se aplicam pressões ultra-altas (acima de 50 MPa), para conseguir uma dimensão média das partículas de uma escala de nanómetros. Quanto à concentração de caseinato, foram testados os rácios óleo:proteína de 20:1, 15:1 e 10:1; de modo a minimizar o diâmetro médio das gotículas, assegurar uma estabilidade física (resistência à recoalescência) satisfatória e minimizar a degradação de caroteno resultante da homogeneização. Quanto à homogeneização, foram utilizadas pressões na gama entre 50 e 150 MPa de pressão primária e 5 a 15 MPa de pressão secundária do processo.
A caracterização das alterações físicas do encapsulado consistiu na descrição da relação entre a actividade da água do meio e a humidade de equilíbrio do material, com vista à adaptação das isotérmicas de sorção BET e GAB. O encapsulado foi sujeito a um período de armazenamento de 40 dias a várias humidades relativas, e foram efectuadas análises periódicas para observar a variação do conteúdo de
V
caroteno à superfície e a variação da estrutura física da emulsão reconstituída. As transições térmicas do material foram determinadas por DSC, e também por DMA e DEA. Estas duas análises tinham como objectivo a correlação dos resultados com as temperaturas obtidas por DSC, através da equação de Arrhenius. Por fim, o encapsulado foi observado no fim do período de armazenamento, ao microscópio com luz polarizada, para observar a possível ocorrência de cristalização. Em conjunto com os objectivos principais deste trabalho, foi desenvolvido um método
espectrofotométrico para a determinação de β-caroteno em soluções de n-hexano.
Este método foi utilizado em todas as quantificações de caroteno deste trabalho.
Os resultados permitiram concluir que a matriz se mantém estável se for mantida a
um aw de 0.339 ou inferior. Valores mais altos permitem a transição vítrea a
temperaturas inferiores à temperatura ambiente, causando cristalização espontânea da matriz, afectando assim as características funcionais do encapsulado. Os dados de sorção da matriz ajustaram razoávelmente às isotérmicas BET e GAB, indicando uma humidade da monocamada de 4.64% e
3.21%, respectivamente. A análise por DSC indicou uma Tg de 107.9ºC para a
amostra anidra, 55.2ºC para um armazenamento a uma pressão relativa de vapor de água de 11% e 30.2ºC para o armazenamento a 33%. Não foi possível correlacionar estes resultados com os dados da DMA e DEA, devido à elevada irregularidade dos resultados obtidos.
As emulsões homogeneizadas a pressões ultra-altas revelaram um diâmetro médio de partículas satisfatório, bem como a estabilidade física das emulsões. No entanto, a influência da pressão secundária do processo não é evidente.
Conclui-se que existe uma vantagem efectiva na utilização da homogeneização a pressões ultra-altas, e que a matriz se mantém íntegra para o período de tempo considerado, se armazenada a uma humidade relativa inferior a cerca de 45%. Contudo, é necessária uma avaliação da eficiência de encapsulamento desta matriz neste tipo de produto, utilizando métodos quantitativos e experimentais mais adequados. Conclui-se também é necessário maior conhecimento para utilização de DMA e DEA neste tipo de materiais, para melhor correlacionar com os resultados obtidos por DSC.
VI
TABLE OF CONTENTS Acknowledgements ….……….….… I Abstract …...……….….… III Resumo …...……….….… IV Table of Contents …...……….….… VIIndex of Tables …...……….….… VII
Index of Figures …...……….….… VIII
Abbreviations ……..………...… X
Introduction ………....……….... XI
Chapter I – Literature Review
1.1. Physical State of Food Solids ……….…...………..… 1
1.2. Encapsulation …….……...……….………..… 15
Chapter II – Preliminary Emulsion Study and Selection 2.1. Materials and Methods ………..…. 29
2.2. Results ………...…. 32
Chapter III – Encapsulation: Water Sorption and Physical Stability 3.1. Materials and Methods ………...…. 37
3.2. Results ………...….. 42
Chapter IV – General Discussion and Conclusions 4.1. General Discussion ………. 52
4.2. Conclusions ………...…. 55
References ………...……... 57
VII
INDEX OF TABLES
Table 1.1: Estimated values of onset glass transition temperatures for
pure anhydrous carbohydrates, related to their molar masses. P. 4
Table 1.2: Experimental values of onset temperatures for glass transition
and crystallization, determined on freeze-dried, amorphous α-lactose
and sucrose, hydrated under different water activities. P. 7
Table 1.3: Water activities of various saturated salt solutions,
at 25ºC. P. 8
Table 2.1: Emulsion formulations used for the preliminary study.
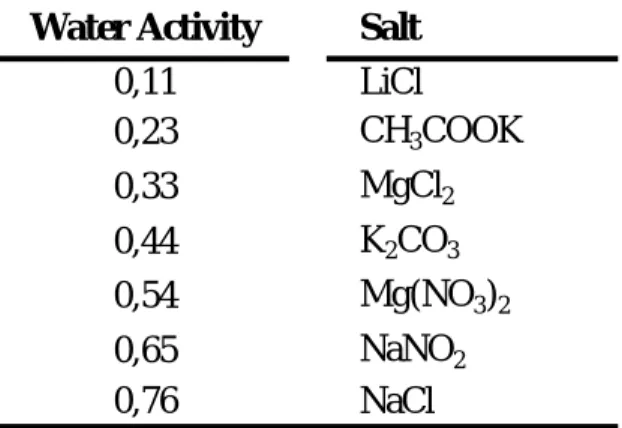
P. 29 Table 3.1: Relation between the theoretical water activities used, and the
salts that were placed as saturated solutions inside the desiccators. P. 37
Table 3.2: Relation between the expected and the determined aw,
used for data correction. P. 40
Table 3.3: Derived parameters of the fitted sorption isotherms. P. 42
Table 3.4: Glass transition temperatures (onset, midpoint and endset)
VIII
INDEX OF FIGURES
Figure 1.1: Illustration of the glass transition, compared to a
melting/crystallization of a pure non-polymeric substance. P. 5
Figure 1.2: Typical sorption isotherms at different temperatures. P. 7
Figure 1.3: Standard scan of storage modulus (G’) and loss modulus (G’’) versus temperature, for determining the glass
transition temperature. P. 12
Figure 1.4: Illustration of an ideal conductor and an ideal
capacitor, related to their phase shift angle. P. 13
Figure 1.5: A typical spray-drier. P. 18
Figure 2.1: Sauter Mean Diameter of the three emulsion formulations
homogenized at 50, 100 and 150 MPa as primary pressures. P. 32
Figure 2.2: Distribution span of the three emulsion formulations,
homogenized under 50, 100 and 150 MPa as primary pressures. P. 32
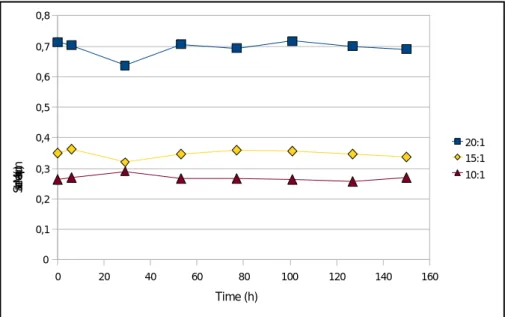
Figure 2.3: Variation of the Sauter Mean Diameter over time, for the three different emulsion formulations, homogenized under the same
conditions. P. 33
Figure 2.4: Variation of the droplet distribution's span value over time, for the three different emulsion formulations, homogenized under the same
conditions. P. 34
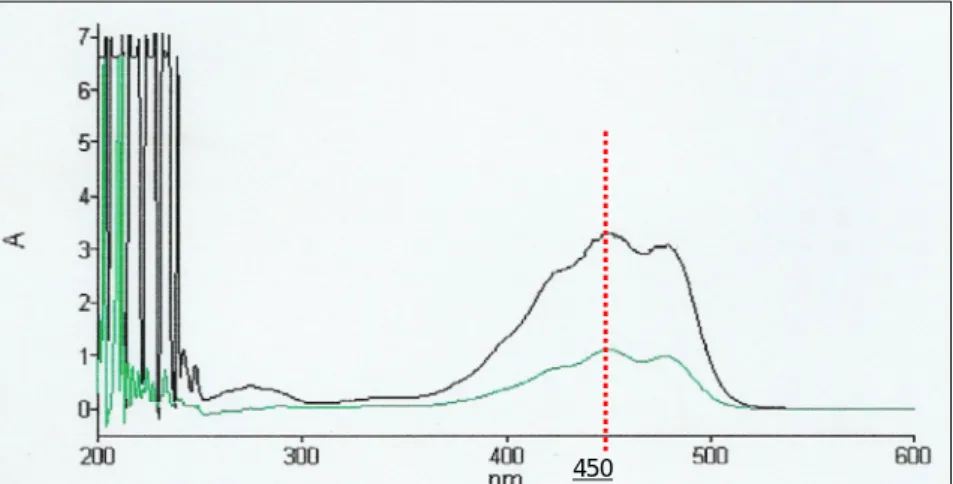
Figure 2.5: Absorbance profile of β-carotene, determined on two samples
of different concentrations, showing a clear peak at 450nm. P. 34
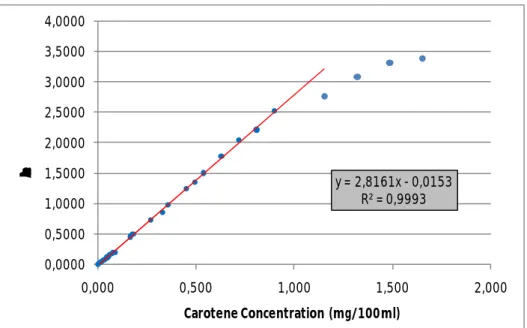
Figure 2.6: Calibration curve of β-carotene in hexane, at 450nm, with its
IX
Figure 2.7: Percentage of carotene lost during homogenization, using the
pre-mixed emulsion as reference. P. 35
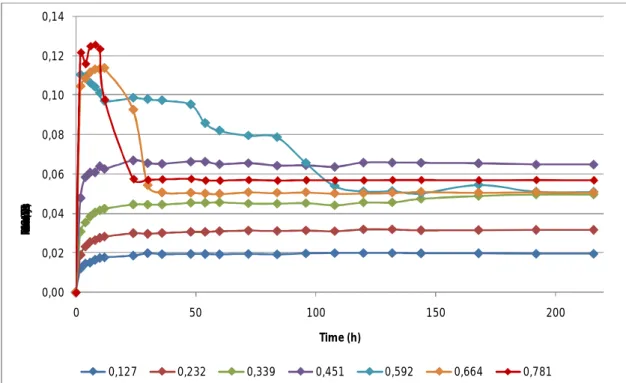
Figure 3.1: Water adsorption data for the spray-dried encapsulate, under
the seven different water activities studied. P. 41
Figure 3.2: Water sorption isotherms at 25ºC of lactose-trehalose-sodium
caseinate spray dried powder. P. 42
Figure 3.3: Variation of the surface carotene fraction over total carotene
in the four storage aw values studied. P. 43
Figure 3.4: Comparison between droplet size distributions of the feed emulsion and the emulsion resulting from rehydration of the encapsulate,
on the same day of production. P. 44
Figure 3.5: Variation over time of the Sauter Mean Diameter (D(3,2)) of
the reconstituted emulsions of the four different powder samples. P. 45
Figure 3.6: Variation over time of the droplet distribution span of the
reconstituted emulsions of the four different powder samples. P. 45
Figure 3.7: Comparative sequence of droplet size distribution curves of the reconstituted emulsion, resulting from rehydration of the powder at
59,2% RVP. P. 46
Figure 3.8: Comparison of details of microscopic snapshots taken from
the powder, hydrated under 59,2% RVP. P. 47
Figure 3.9: Arrhenius plots of the DMA results, showing the linear
X
ABBREVIATIONS
aw Water activity
BET Brunauer-Emmet-Teller
DEA Di-Electrical Analysis
DMA Dynamic Mechanical Analysis
DSC Differential Scanning Calorimetry
DTA Differential Thermal Analysis
E’ Storage modulus
E’’ Loss Modulus
GAB Guggenheim-Anderson-de Boer
NaCas Sodium caseinate
RVP Relative Vapour Pressure
RMS Root Mean Square
SMD Sauter Mean Diameter
Tg Glass transition temperature
w/w Weight over weight
ε’ Di-Electric constant
XI
INTRODUCTION
Encapsulation has been recently growing as a way of preserving sensitive food materials, creating a barrier between the molecule and the environment which causes degradation. The study of the physical structure of the barrier is important to establish under which conditions should the encapsulate be stored, in order to prevent unexpected breakdown of the capsules.
The purpose of this work was to study the physical changes of a model sugar system of equal parts of lactose and trehalose, related to its potential as an encapsulation matrix for β-carotene, a lipossoluble carotenoid. Such physical changes are generally related to the glass transition temperature, which is a very important, moisture dependent thermal transition. Above this temperature, molecular mobility is sufficient for the matrix to crystallize, irreversibly reducing the barrier effect.
The encapsulation system considered in this project is a spray-dried, oil-in-water emulsion. This study aimed to relate the water content of the amorphous matrix
sugars with the variation of the glass transition temperature (Tg) and the occurrence of
crystallization over time. The influence of these changes on the structure of the rehydrated emulsion and on the carotene content of the powder’s surface was also to be assessed.
Prior to spray-drying, the feed emulsion was modelled, in terms of emulsifier concentration and homogenization conditions, in order to achieve minimum droplet size, maximum emulsion stability and optimal carotene protection in the homogenization process. For that purpose, ultra-high pressure homogenization was used, which is a recent technology in food production. The sodium caseinate concentrations tested were expressed as oil:protein ratios of 20:1, 15:1 and 10:1.
These values are based on the optimal concentration of 15:1 reported by Vega et al.
(2006) for similar systems, based in milk powders.
Characterization of the spray-dried material’s physical changes consisted of a description of the sorption behaviour, with the objective of determining equilibrium moisture content of hydrated samples, and to fit the BET and GAB sorption isotherms to the experimental data. The spray-dried powder was analyzed, to monitor changes in the fraction of carotene that was exposed on the surface, and to detect changes in
XII
the structure of the reconstituted emulsion from the encapsulate. Thermal transitions were detected by Differential Scanning Calorimetry (DSC), and further analyses were made by Dynamic Mechanical Analysis (DMA) and Di-Electrical Analysis (DEA), to correlate with the DSC results, using Arrhenius equation. Finally, the stored encapsulate was observed with a microscope, under polarizing light, to detect crystallization of the matrix.
Alongside with the main guideline of the work, a spectrophotometric method for
1
CHAPTER I – LITERATURE REVIEW
1.1. Physical State of Food Solids
According to the needs of the food industry today, one of the most important concerns is extending the shelf-life or storage stability of foods. This can be accomplished by minimizing the rate at which chemical or biological degradation occurs, either by avoiding optimal conditions for the phenomena, or by reducing the availability of the reaction’s role-players. There has been some thorough study on the importance of
water availability (aw) in the shelf-life of foods, for its role as universal reaction medium
and its fundamental role in microbiology, which supports some classic food preservation processes such as drying and addition of humectants (salts or sugar). Another approach is to limit the mobility of the reacting species themselves, controlling their physical state.
The physical state of the food solids is dictated by the physical state of each component and its behaviour as a separate phase. It defines the molecular mobility of the material, thus influencing its rheological and electrical properties, as well as
diffusion and glass transition phenomena (Roos, 1995). Apart from water, foods are
mainly constituted by carbohydrates, proteins and lipids. The lipid fraction is not physically affected by water, so its phase behaviour is not as complex as the other fractions. The carbohydrates and proteins may exist in three different physical states: solubilized, crystalline or amorphous, all of them greatly affected by water content and temperature.
1.1.1. Crystallization
A crystal is a material in a solid state, composed by molecules, atoms or ions that are bound together, forming a regular pattern or lattice. Crystals are well organized, regular frameworks of molecules, connected by covalent, metallic, ionic
or molecular forces (Walstra, 2003). Crystallization occurs either from a melted or
solubilized solid, which can be a sugar, salt or triacylglycerol (Walstra, 2003). If
the starting point is a melted solid, crystals are formed by dropping the temperature below the melting temperature, and in the case of a solubilized solid,
2
Crystallization occurs in three steps, which are nucleation, propagation and maturation. This means that each crystal has a starting location, or nucleus, and further develops into a full grown crystal by addition of molecules. Therefore, it’s a phenomenon that depends strongly on molecular mobility and time, and can be
induced by increasing the temperature or the moisture content (Roos and Karel,
1991). Another important parameter for crystal formation speed is the melt or
solution’s viscosity, as it directly influences the internal molecular mobility of the fluid. It has been found that the addition of polymers may delay crystallization of
sucrose (Iglesias and Chirife, 1978, cit. in Roos and Karel, 1991), and the same
effect was observed when fructose was added (Roos and Karel, 1991), related to
increased viscosity and the correspondent hampering effect on the molecular mobility, which also explains faster crystallization in low molecular weight sugars
than in polymers (Roos, 1995). Some sugars may crystallize as hydrates, i.e.
including water molecules in their crystalline structure, and may show phase
behaviour very different from anhydride crystals (Roos, 1995). Crystallization of
amorphous carbohydrates may be related to browning reactions, stickiness and
caking of powders (Roos and Karel, 1991). Crystallization can be detected by
microscopic observation of the material, under polarizing light (Roos, 1995); it is
possible to run a quantitative analysis of the degree of crystallization of a
structure, by using Fourier-Transform Raman spectroscopy (Gunning et al., 1999),
or by calculating the ratio between the heats of fusion of a sample and a pure
crystalline form (Sutter et al, 2007).
1.1.2. Amorphous Materials
Amorphous materials, or glasses, are apparently solid due to their degree of molecular aggregation, although there are considerable differences in its internal structure. In fact, a glass is a supercooled liquid of very high viscosity, which exists in a metastable state of a mechanical solid, capable of sustaining its own
flow (Levine and Slade, 1992). In amorphous materials, the particles are closely
packed, creating a structure where particles show little translational and rotational motion, but without regular molecular density, and less stable than the crystalline state. Translational motion of molecules, i.e. diffusion, is dependent on the molecular radius and the glass viscosity, and it is a common phenomenon to
nearly all chemical reactions (Levine and Slade, 1992; Walstra, 2003). Glasses
3
common case in food products is a quick drying process (Roos and Karel, 1991),
which removes the solvent, not providing enough time to allow crystallization. Many of the food solids are presented in the amorphous state, especially low
molecular weight materials like sugars (Roos and Karel, 1991. Typical examples
of amorphous foods are dried skim milk, also called skim milk powder, where its main component is glassy lactose and dry cereal products like hard biscuits, breakfast cereals and pasta, where starch is presented in an amorphous state
(Walstra, 2003). The amorphous state is a metastable, non-equilibrium state. As a
result, many of amorphous materials’ physical properties depend largely on
temperature, moisture content and time (Levine and Slade, 1992; Roos, 1992,
1995; Roos and Karel, 1991).
1.1.3. Glass Transition
An amorphous material kept at sufficiently low temperatures is hard and brittle,
much like a glass (Sperling, 1986, cit. in Roos, 1995). Increasing the temperature
up to a certain point, the structure of the material loosens, thus allowing some molecular mobility. This can be described as a transition between the “glassy” state and the “rubbery” state, and occurs at a temperature known as the glass
transition temperature (Tg). It can also be described as the transition between a
solid-like material and a highly-viscous fluid; in the rubbery state, molecules exhibit translational and rotational motion, whereas such motion in inhibited in the
glassy state (Levine and Slade, 1992; Angell, 1988, cit. in Ubbink and Krüger,
2006). Even though mobility is effectively blocked in the glassy state, some
reorganization may occur with water, gases and small organic molecules (Ubbink
and Krüger, 2006). Although there are structural changes, glass forming or
disintegration is not to be considered as a thermodynamic phase transition, since a glass is not an equilibrium state, and glass transition temperatures aren’t
precisely constant (Walstra, 2003). Usually, there is a relation between a low
molecular weight and a correspondent low glass transition temperature, and this
becomes evident in sugars (Levine and Slade, 1992; Roos and Karel, 1991b).
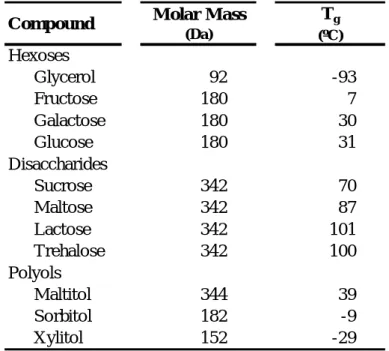
Estimated glass transition temperatures for some food solids are presented in Table 1.1.
4
Compound Molar Mass
(Da) Tg (ºC) Hexoses Glycerol 92 -93 Fructose 180 7 Galactose 180 30 Glucose 180 31 Disaccharides Sucrose 342 70 Maltose 342 87 Lactose 342 101 Trehalose 342 100 Polyols Maltitol 344 39 Sorbitol 182 -9 Xylitol 152 -29
Table 1.1: Estimated values of onset glass transition temperatures for pure anhydrous carbohydrates, related to their molar masses. Source: Walstra, 2003; Roos, 1995.
The most important changes that occur in glass transition are related to the specific volume, apparent viscosity and enthalpy flow. An illustration of these three
properties, both related to the glass transition temperature (Tg) and the melting
temperature (Tm) is shown in Figure 1.1. The variation of the specific volume (1/ρ)
is better understood if we consider cooling down the liquid across the glass transition temperature; if the liquid is cooled down slowly enough, crystallization occurs, and the specific volume decreases abruptly. As the material is further cooled down, the reduction of specific volume continues, but at a much slower rate. However, if the liquid is cooled down very fast, crystallization is avoided, and
the specific volume continues to decrease at the same rate as before, until the Tg
is reached. At this point, the specific volume decreases at the same rate as the
crystalline solid (Walstra, 2003). The glass transition affects the mechanical
properties of the material as a consequence of the increase in molecular mobility, i.e. the diffusion coefficient of molecules. By increasing the temperature across the
Tg, viscosity decreases drastically, showing what may be considered a plasticizing
effect of temperature on the food material (Roos, 1995). The enthalpy of the
system is shown in Figure 1.1 as a first order derivative. The narrow peak that
occurs at Tm corresponds to the melting of the crystalline structure, whereas the
small step that is observed at Tg. When a second derivative of the curve is plotted,
a peak is shown at the glass transition temperature; for that reason, we speak of a
5
Figure 1.1: Illustration of the glass tran sition, compared to a melting/crystallization of a pure non-polymeric substance. Equilibrium states shown as solid curves and non-equilibrium states are shown as broken curves. (a) Specific volume; (b) Apparent viscosity; (c) enthalpy flow (first derivatives), with the upwards direction representing an endothermic transition. Source: Walstra, 2003.
At temperatures above Tg, there is an increase in molecular mobility and a
decrease in viscosity, which are sufficient so that crystallization becomes possible,
if enough time is allowed (Roos and Karel, 1991); therefore, keeping the
environment temperature of amorphous food solids below the Tg is of great
importance when controlling storage stability and handling. Frequently, the
6
sensitive to moisture, and small amounts of water can decrease the material’s Tg
to a great extent. (Roos and Karel, 1991; Roos, 1995; Vega et al, 2006).
1.1.4. Water Relations
Water activity (aw) is the most important factor affecting food stability and shelf-life
(Roos and Karel, 1991). It is a measure of the availability of water to participate in
chemical, microbiological and enzymatic reactions that may cause degradation of foods. Water activity differs from gravimetric water content, because it is related to the vapour pressure exerted by the food’s water, and it is a better representative
of the influence of water in the food’s properties (Walstra, 2003). This vapour
pressure depends on the water content, but also on temperature and the composition of food. Some food components, named humectants, are effective in decreasing water vapour pressure in foods; these are usually low molecular weight sugars or salts, but larger molecules may also show activity as
humectants, although not as effectively (Lewis, 1996).
When a given food solid is associated with water, the glass transition temperature
of the system will decrease (Roos and Karel, 1991), as well as its instant
crystallization temperature, although it is more time dependent (Table 1.2). This can be explained by the action of the water as a low molecular weight plasticizer,
or its action as a diluent (Roos, 1995). Anyway, it becomes obvious that the
material’s water content is very important to account for its stability, when it comes to physical changes during processing and storage; as an example, amorphous lactose crystallizes very quickly at room temperature if stored at 40% of relative
humidity (Roos and Karel, 1991). Both temperature and moisture content are
responsible for plasticization of the amorphous structure, which increases
molecular mobility and decreases viscosity, leading to higher reaction rates (Roos
and Karel, 1991) However, crystallization rates are reported to depend closer to
the temperature disparity towards Tg, i.e. the (T-Tg) parameter; at the same (T-Tg)
value, the crystallization time is only mildly affected by moisture (Roos, 1992).
Empirical examples of glass transition in foods include boiling of pasta, which causes hydration and consequent change into a rubbery material, and loss of crispiness in dry biscuits due to excessive water uptake from the environment
7
Tg Tcr Tg Tcr 0,00 101,2 162,5 56,6 104,4 0,11 65,0 113,3 37,4 83,7 0,23 43,7 93,3 27,9 75,1 0,33 29,1 74,7 (a) (a)0,43 (a) (a) (a) (a)
(a) Crystallization occured rapidly at room temperature
Water Activity
(25ºC)
Lactose Sucrose
Table 1.2: Experimental values of onset t emperatures for glass transiti on and crystallization, determined on freeze-dried, amorphous α-lactose and sucrose, hydrated under different water activities. All temperatures are given in ºC. Standard deviation values are omitted. Source: Roos and Karel, 1991.
Because amorphous carbohydrates are hygroscopic, they will naturally absorb water from the atmosphere, until an equilibrium moisture content is eventually established with the surrounding environment. This phenomenon can be described by sorption isotherms, for any combination of adsorbent (food),
adsorbate (water) and temperature (Roos, 1993, cit. in Gunning et al, 2000).
Sorption isotherms, or vapour pressure isotherms, are plots of water content
versus aw, and for most foods they exhibit a typical sigmoid-shaped plot (Figure
1.2). The amount of water adsorbed by the food material is related to the specific surface that is exposed, which is related to the higher higroscopicity of fine, amorphous food powders. Knowledge of the sorption isotherms of food materials is very important to have an expression of their higroscopicity, allowing to decide
at what air humidity a food material should be stored (Walstra, 2003).
Figure 1.2: Typical sorption isotherms at different temperatures.
8
Salt Water Activity
LiBr 0,064 LiCl 0,113 CH3COOK 0,225 MgCl2 0,328 K2CO3 0,432 Mg(NO3)2 0,529 NaNO2 0,654 SrCl2 0,709 NaCl 0,753 (NH4)2SO4 0,803 KCl 0,843 BaCl2 0,903 K2SO4 0,973
Sorption isotherms are determined by equilibrating samples, usually dehydrated, with air at a known temperature and relative humidity. Controlled relative humidity is commonly accomplished by placing a saturated salt solution in a desiccator, with different relative humidities being provided by different salts, at different temperatures (Table 1.3). The sample is then put inside the desiccator, and its mass is determined at regular intervals, assuming that any increase or decrease is related to water content. Water sorption is affected by temperature, as higher temperatures lead to lower water contents at any environmental relative humidity
(Lewis, 1996).
Table 1.3: Water activities of various saturated salt solutions, at 25ºC.
Source: Roos, 1995.
In the determination of a sorption isotherm, some deviations may occur. When a
food sample is placed under a specific environmental aw, it may take up water
from the atmosphere or, if its original moisture is higher, it can release water into the atmosphere. For most foods, the adsorption isotherm doesn’t match the desorption isotherm, which means that the relation between relative humidity and equilibrium moisture content is dependent on whether the sample is hydrating or
dehydrating. Such phenomenon is known as hysteresis (Lewis, 1996). Another
deviation is crystallization of some sugars. Amorphous sugars take up much more water than crystalline sugars, because of their higher higroscopicity. However, if amorphous sugars are allowed to hydrate, and sufficient time is provided, they may crystallize. In sorption isotherms crystallization is shown as an
9
abrupt decrease in moisture content. During crystallization, water is released, which promotes further crystallization on the remaining non-crystallized fraction.
(Roos and Karel, 1991; Roos, 1995). Amorphous samples crystallize before an
equilibrium is reached, so they are considered inadequate for sorption studies
(Omar and Roos, 2007a).
Examples of mathematical models of isotherms include the Brunauer-Emmett-Teller (BET) isotherm, and the Guggenheim, Anderson-DeBoer (GAB) isotherm. The first isotherm is adequate for monolayer adsorption of water, best fitted under
the 0.1-0.5 aw range, while the GAB isotherm is more versatile to data of various
aw ranges, temperatures and materials, also providing information on monolayer
water (Laaksonen and Roos, 2000, Omar and Roos, 2007a, Roos, 1995).
BET Isotherm: w w w
a
K
m
K
K
m
a
m
a
1 11
1
)
1
(
(1.1)This is the linear form of the BET model, intended to fit the experimental data
by linear regression. In this equation, aw is the water activity, m1 the
monomolecular layer moisture content on dry basis and K is a constant.
According to Karel (1975) (cit. in Lewis, 1996), amorphous lactose has a
monolayer moisture of 6%. GAB Isotherm:
w w wa
a
m
a
2)
(
(1.2)This is a reduced version of the isotherm, intended for simplified data fitting by
second-order polynomial regression. Values of , and are used to
determine further parameters. In this isotherm, a new parameter, C, is
introduced (Laaksonen and Roos, 2000).
2
1
1
m
C
(1.3)10
C
m
K
11
(1.4) 2 14
1
m
(1.5)A measure of the extent of the data fitting to the models can be obtained by the relative percentage root mean square, or %RMS. This parameter is easily calculated and can be used to compare experimental data fitting to different mathematical models.
100
/
%
2
N iN
m
m
m
RMS
(1.6)In this equation, m is the experimental moisture content (dry basis), m’ is the moisture content determined by the isotherm and N is the number of samples
fitted to the model (Omar and Roos, 2007a).
1.1.5. Thermal Transition Determination – DSC, DMA and DEA
It is accepted that there is a direct relation between a food material’s thermal transitions (glass transition, crystallization and melting), and its physical properties
(Roos, 1995). Furthermore, it is related to the materials’ functionality as an
encapsulation matrix, and stability of the dried products (Roos, 1987). It should be
noted that crystallization is a time-dependant phenomenon, and can occur at temperatures below the experimentally determined instant crystallization
temperature (Tcr), if enough time is provided (Karel and Roos, 1991).
The thermal transitions and correspondent phase changes can be detected by differential thermal analysis (DTA) or differential scanning calorimetry (DSC)
(Roos, 1987; Lewis, 1996). The reactions that lead to such phase changes are
crystallization, melting and freezing, evaporation and some chemical reactions like
denaturation of proteins and starch gelatinization (Lewis, 1996). Both methods are
based in heating or cooling of a small quantity of sample and a reference material, but while in DTA the same amount of energy is put into both materials, and temperature difference is recorded, in DSC the temperatures of sample and
11
reference are the same, and the data collected is the amount of heat required. The results are shown in a thermogram, i.e. a plot of heat flow versus temperature, and when a thermal transition occurs, there is an enthalpy change involved in the reaction that is graphically expressed in the thermogram. DSC analysis is usually done in hermetically sealed pans, to avoid water evaporation,
which would greatly affect thermal transition temperatures (Roos, 1995).
Amorphous materials in food science are subject to relaxation phenomena due to the physical state itself as well as the glass-forming processes. For some samples it is common to run a heating program followed by a cooling program before the actual analysis, in order to minimize the influence of relaxation, in what may be
considered as erasing the thermal history of the material (Lewis, 1996; Roos,
1995).
DSC scans of mixtures, especially when biopolymers are involved, don’t show a
clear glass transition; for that reason, it can be easier to determine Tg by dynamic
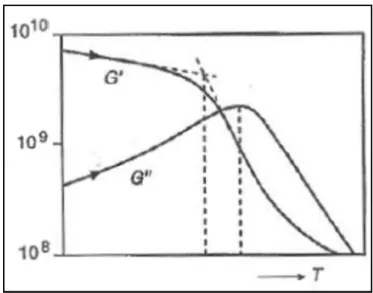
mechanical analysis (DMA) (Walstra, 2003). This analysis consists in monitoring
changes in mechanical modulus over temperature (Roos, 1995), as shown in
Figure 1.3. At the glass transition, the increase of the molecular mobility softens
the material, and its ability to store energy decreases (Laaksonen and Roos,
2000). In fact, storage modulus (G’) is maximum in the glassy state, and it
decreases sharply at the glass transition, while loss modulus (G’’) shows a peak at the glass transition temperature, and the peak’s onset corresponds to the endset
temperature of glass transition, measured by DSC (Roos, 1995). Like DSC,
dynamic rheological methods also depend on the rate of temperature increase, but also on the deformation frequency during the measurement, which can be
12
Figure 1.3: Standard scan of storage modulus (G’) and loss modulus (G’’) versus temperature, for determining the glass transition temperature. Source: Walstra, 2003.
The use of dielectrical thermal analysis (DETA or simply DEA) is, like in DMA governed by changes in storage and loss of energy. In this case, the principle is applied to the ability of the material to store or to conduct an electrical charge, as it
is related to molecular mobility (Lievonen and Roos, 2003). The two interesting
properties are the relative dielectric constant (ε’) and the relative dielectric loss factor (ε’’). The variation of these properties, in relation to glass transition, is
similar to the mechanical properties determined by DMA (Roos, 1995).
The relative dielectric constant, or relative permittivity, is the ratio of the food material’s capacitance and the capacitance of air or vacuum under the same analytical conditions. Capacitance is a measure of the ability of a material to store electrical charge. The SI unit of capacitance is the farad, but since ε’ is a relative value, i.e. a ratio of two capacitances, it is dimensionless. The relative dielectrical loss factor is a measure of the amount of energy that is dissipated, i.e. conducted by a material when subjected to an alternating electrical field. It is also a relative value, hence dimensionless. The dielectric constant is related to dipole alignment within the material, while the loss factor is related to the energy required to move
dipoles and ions (Lievonen and Roos, 2003). The dielectric properties depend
mainly on temperature, physical structure, chemical structure, moisture content and frequency of electric current. Free water and ions have high dielectrical
activity, whilst bound water and colloids have low dielectrical activity (Lewis,
13
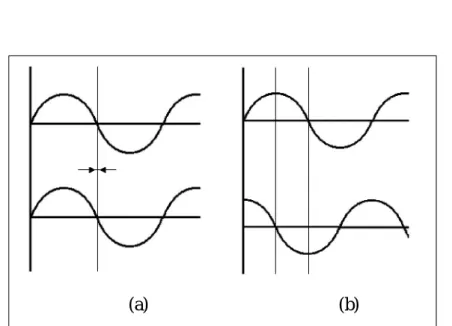
If an alternating, sinusoidal current is applied to a conductor, the resulting current is in the same phase as the applied voltage, and no storage of charge takes place. However, when a capacitor is added, the resulting electrical current is out of phase with the original voltage. The degree of the phase shift is represented as the δ angle, or loss angle, which is 0º for an ideal conductor, and 90º for an ideal capacitor (Figure 1.4). Food materials should show a loss angle between 0º and
90º (Laaksonen and Roos, 2000). The dielectric constant and the dielectric loss
factor are related by the loss tangent, or tan δ, according to the following equation:
' ' ' tan
(1.7)Figure 1.4: Illustration of an ideal conductor (a) and an ideal capacitor (b), related to their phase shift angle. The upper sinusoid represents the applied
alternating current, and the lower represents the resulting current.
Both DEA and DMA provide information leading to glass transition temperature. However, the physical changes that indicate the transition are dependent on frequency, whether it is a deformation, in DMA, or an electrical current, in DEA. To find a frequency that correlates to the DSC results, it is necessary to plot experimental temperatures with the correspondent frequency, as Arrhenius functions. This consists in plotting the natural (or Neperian) logarithm of frequency, against the reciprocal absolute temperature, in a linear form of the
Arrhenius equation (Talja and Roos, 2001):
14
RT E A f ln a ln (1.8) orA
T
R
E
f
aln
1
ln
(1.9)In this equation, f is the frequency, Ea is the activation energy, R is the
ideal gases constant, T is the absolute temperature and A is a constant.
1.2. Encapsulation
1.2.1. Overview
Encapsulation is the technique by which a small particle or material is entrapped
or enclosed within a continuous material (Soottitantawat et al, 2003). The main
goal is to establish a physical barrier between the external environment and the
entrapped component (Fuchs et al, 2005). Encapsulation of active ingredients
aims to cope with their sensitivity to a number of physical and chemical factors, like water, oxygen temperature and light, which may cause loss of biological
functionality, chemical degradation or inadequate release (Ubbink and Krüger,
2006; Fuchs et al, 2005; Pegg and Shahidi, 1999). Such active ingredients include
flavourings, colourants, antioxidants, vitamins, preservatives, minerals or, more
recently, probiotic microorganisms and various bioactive compounds (Ubbink and
Krüger, 2006; Weiss et al, 2006).
The continuous materials can either be carbohydrates, gums, polysaccharides,
proteins, lipids or biopolymer complexes (Soottitantawat et al, 2004; Ubbink and
Krüger, 2006), and it must be suitable as an encapsulation matrix. Specifically, it
must be easily handled as a vehicle for the sensitive ingredient, must not react with the core material, be compatible with the quality attributes of the other components in the food system and, most importantly, provide an efficient
protective effect (Weiss et al, 2006; Madene et al, 2006). The material’s behaviour
as an encapsulant depends on its stability, which is on its hand influenced by the chemical nature of the material, ratio of core material to wall material, storage
15
conditions and encapsulation method (Madene et al, 2006). According to the
encapsulation process used, the matrix may present several different features that can influence diffusion across the material, both inbound and outbound, with subsequent degradation of the core ingredient. Such features include material shapes (films, spheres, irregular particles), structures (porous or compact) and
physical states (crystalline, glassy, rubbery) (Madene et al, 2006). Since there is
not a single encapsulation matrix that complies with all the characteristics required, it is common to formulate mixtures of carbohydrates, polysaccharides
and proteins, in variable proportions (Kaushik and Roos, 2006; Pegg and Shahidi,
1999).
Encapsulation is also a method of controlled delivery of functional ingredients in food systems during processing, storage, or consumption, in this way improving
the effectiveness and application range of food additives (Gouin, 2003; Pegg and
Shahidi, 1999). In these systems, the encapsulating matrix is designed to collapse
under specific environmental conditions, such as pH, ionic strength, temperature or moisture content, thus releasing the encapsulated ingredient. Encapsulates as controlled release systems have long been used by other industries, such as
cosmetics and pharmaceutical (Weiss et al, 2006). Another well recognized
advantage of encapsulation is the conversion of liquid materials, such as essential
oils, into easily handled, free flowing powders (Whorton, 1995, cit. in Gunning et
al, 2000; Pegg and Shahidi, 1999; Soottitantawat et al, 2003). It can also be seen
as a method of extending shelf-life of perishable emulsions, irrespective of the
emulsion’s physical stability (Vega et al, 2006). Furthermore, since encapsulation
is frequently a drying process, it may also reduce the volume and weight of the
product, thus minimizing the packaging and storage requirements and costs (Vega
and Roos, 2005).
The main parameter in dehydrated powder’s quality is the composition of the powder surface, since it establishes the bulk behaviour of the powder in terms of
wettability, flowability and stability to degradation (Vega, Roos, 2005). These
properties may depend on the properties of the wall material, but also on the relative amount of lipids that remain unencapsulated on the powder surface. However, surface lipid content is usually low enough to avoid significant influences
on the powder’s shelf-life (Fuchs et al, 2005; Buffo and Reineccius, 2000, cit. in
16
emulsion, with no significant loss of physical structure (Turchiuli et al, 2005; Pegg
and Shahidi, 1999).
Incorporation of active ingredients in food products is highly complex due to the conditions of most of the food matrices. In other industries, like pharmaceutical, agrochemical or cosmetic, delivery of the active ingredient is the main purpose, and the remaining ingredients can be modelled flexibly. The food industry is subject to a great extent of regulations regarding ingredients, processing methods and storage, and public acceptability must also be considered, in terms of sensory
properties, freshness, ease of use, safety and appearance (Ubbink and Krüger,
2006; Weiss et al, 2006).
1.2.2. Encapsulation Systems and Methods
Encapsulation is generally achieved in a two-stage process. In the first stage, the core material is dispersed within a dense solution of the wall material; the second
stage consists of drying or cooling of the emulsion (Madene et al, 2006; Minemoto
et al, 1997). Many sensitive ingredients such as antioxidants, vitamins or flavours
are lipid-based or lipossoluble compounds, which exist in liquid form at room temperature. For these lipophilic substances the easiest means of encapsulation consists in a first stage of emulsifying the component in an aqueous solution, often
using a homogenizer or high-speed mixer (Soottitantawat et al, 2004; Turchiuli et
al, 2004); the emulsion may be simple oil in water dispersions, or more complex
such as multilayered emulsions (Guzey and McClements, 2006).
Encapsulation can be achieved by a number of processes, based on chemical or mechanical principles. The choice of the most suitable method is based on the desired particle size, physical and chemical properties of the matrix, future application of the encapsulate, desired release mechanisms, industrial scale and
production costs (Duarte, 2006; Pegg and Shahidi, 1999).
1.2.2.1. Chemical Processes
Coacervation: often regarded as the original method of encapsulation (Risch,
1995, cit. in Madene et al, 2006), coacervation consists in the formation of an
17
phase around the dispersed phase, which contains the sensitive material, thus forming microcapsules. Residual liquid continuous phase is separated by filtration or centrifugation, the capsules are then washed and, optionally, dried
(Vieira, 1998). It’s a very promising encapsulation technology due to very high
encapsulation efficiency and good controlled release possibilities, based on
mechanical stress and temperature (Gouin, 2003).
Co-Crystallization: in this process a supersaturated sugar syrup is held at high temperature, where crystallization becomes spontaneous. If the core material is dispersed in the syrup, small crystals are formed which incorporate the sensitive compounds, either by inclusion, entrapment or simultaneous
crystallization (Deladino et al, 2006; Madene et al, 2006). It has a great
advantage of higher wall material stability and low higroscopicity, since the material is in its crystallized state, and also good flowability and dispersion
properties (Quellet et al, 2001, cit. in Madene et al, 2006). On the other hand,
it has limited use for heat sensitive compounds (Bhandari et al, 1998, cit. in
Madene et al, 2006).
Molecular inclusion: in molecular inclusion processes, a sensitive molecule is fitted into and surrounded by the structural network of another molecule
(Godshall, 1997, cit. in Madene et al, 2006). The most documented case of
such process is the use of cyclodextrins for encapsulation of flavours (Madene
et al, 2006; Szente and Szejtli, 2003). Cyclodextrins are the result of cleavage
of starch, followed by joining of the edges of the resulting polymer; this is the
action of the cyclodextrin glucosyltransferase enzyme (Madene et al, 2006).
It’s a circular molecule with a hydrophobic inner cavity, which is large enough to partially or fully include apolar molecules, such as most of the flavours
(Madene et al, 2006; Pegg and Shahidi, 1999). The cyclodextrin flavour
complexes are highly resistant against oxidation, heat and evaporation
(Bhandari et al, 1999).
1.2.2.2. Mechanical Processes
Spray-drying: spray-drying is the most widespread method for large-scale encapsulation procedures, due to the relatively low costs, possibility of continuous processing, wide variety of possible matrix materials, and overall
18
good retention and stability properties of the product (Reineccius, 1989, cit. in
Madene et al, 2006). The principle is to dry an emulsion, solution or
suspension, where the sensitive molecule is dispersed in a solution containing the matrix. The emulsion is then spray-dried, i.e. atomized into a chamber where hot air is flowing at high velocity (Figure 1.5), and the small droplets are quickly dehydrated, thus ensuring low particle temperature, despite their
contact with hot air (Reineccius, 1994; Gibbs et al, 1999). The resulting
capsules, collected at the bottom of the drier, are presented as the dispersed
phase, coated in an amorphous matrix material (Turchiuli et al, 2005; Kaushik
and Roos, 2006).
Figure 1.5: A typical spray-drier. Source: Reineccius, 1994.
Although there is heat involved in the process, which may cause loss of volatiles, the temperatures reached are relatively low, which allows this
method to be applied to some volatile core materials (Dziezak, 1998, cit. in
Madene et al, 2006). For example spray-drying encapsulation of carotenoid
pigments, in gelatine or starch with sucrose, provides a protection effect
against degradation (Robert et al, 2003, cit. in Fuchs et al, 2005). The
formation of the capsules is based on changes in physical and chemical properties of the matrix and the core material, input flow rate of the drier, drying temperature and the nature of the encapsulating support. Since the emulsion is sprayed through a nozzle, the encapsulating material must be
19
highly soluble and have low viscosity when in solution, which limits the choice
of the wall material (Madene et al, 2006; Gouin, 2003). This drying process is
liable to leave some of the dispersed droplets uncoated, thus not encapsulating some of the core material, which will remain on the capsules’ surface. This not only represents a lowered efficiency of the encapsulation
process, but also a potential source of off-flavours due to oxidation (Desobry et
al, 1997, cit. in Madene et al, 2006).
The spray-drying method often results in very fine powders, usually in the range of 10-100µm in diameter. Consequently, the material’s specific surface is high, which results in quicker hydration of the amorphous matrix. To prevent this, the powder particle size can be increased by agglomeration, using the
fluidized bed process (Risch, 1995, cit. in Duarte, 2006; Madene et al, 2006;
Roos, 1995).
Freeze-drying: encapsulation by freeze-drying involves emulsion formation and drying of the continuous phase by sublimation, also known as
lyophilization (Minemoto et al, 1997). This method is extremely useful when
encapsulating thermosensitive substances, since it operates on very low temperatures, unlike the spray-drying method. However, freeze-drying tends to be unattractive, unless for very high value foods, due to the long processing time, and very high costs, up to 50 times higher than that of spray-drying
(Desobry et al, 1997, cit. in Madene et al, 2006).
Spray chilling/cooling: spray-cooling and spray-chilling are very similar in principle to spray-drying. The core material is dispersed (emulsified) in a liquefied wall material, and is then atomized through cooling medium, which solidifies the matrix. One essential difference from spray-drying is that no water is withdrawn, which means that the core material must be dispersed in a
melt before processing (Risch, 1995, cit. in Madene et al, 2006).
Since it doesn’t involve high temperatures, it is especially suitable for heat sensitive core materials. The typical encapsulating material used with this method is a hydrogenated vegetable oil, with a melting point around 38ºC. However, this method may require special handling and storage conditions in
20
Extrusion: encapsulation by extrusion is accomplished by adding the sensitive compound to a low-moisture carbohydrate melt, which is then extruded through small orifices under pressure. The extruded material is then immediately immersed in a cold isopropanol bath, where it attains its glassy
state, and is dried in hot air (Reineccius, 1994).
The main advantage of extrusion is its effective protection of oxidation-prone
flavours (Madene et al, 2006; Gouin, 2006). This method assures that the
sensitive material is totally isolated and any remains on the surface are
washed away (Gibbs et al, 1999). Extrusion is a very convenient method for
encapsulation of unstable or volatile components in carbohydrate matrices (Gouin, 2004, cit. in Madene et al, 2006). However, it is associated with very low retention of volatiles, high production costs and large particle sizes, which
can affect food texture (Duarte, 2006). Extruded carbohydrates are also prone
to form cracks, thin wall locations or pores that may develop on the material
during processing or storage, which may affect barrier properties (Madene et
al, 2006).
1.2.3. Molecular Approach on Encapsulation
Recently, there has been an increasing focus on understanding the molecular mechanisms behind the barrier effect, diffusion, phase transition and structural
rearrangement of the matrices (Whorton, 1995, cit. in Madene et al, 2006). To fully
understand the principles of encapsulation, it is crucial to focus on the mechanisms by which volatiles are retained inside a food matrix. In a single-phase system, volatiles are held within the impermeable matrix, which greatly decreases diffusion coefficients, hence their mobility. In a biphasic system, i.e. an emulsion,
structure issues are fundamental to volatile release (Gunning et al, 1999).
Protection of volatiles and controlled release depend mainly on the composition and structure of the wall, which depend not only on the matrix itself, but also on
the operating conditions during production and storage of particles (Fuchs et al,
21
1.2.3.1. Release of Encapsulated Molecules
The core materials can have a variety of molecular or physical forms, such as polarities, molecular weights and physical states, which will have a great influence in the location of the encapsulated ingredient. The volatile’s affinity for both phases (dispersed and continuous) will determine how it will be partitioned, i.e. a hydrophobic component like a fat of a lipossoluble vitamin will form an emulsion in water, while an hydrophilic compound will dissolve in the aqueous phase. This explanation complicates the approach on the release of complex mixtures of core materials, as multiple transport mechanisms must
be considered (Gunning et al, 1999).
If we consider encapsulation from a biphasic system, where a volatile dissolved in the dispersed phase of an oil-in-water emulsion is encapsulated by the dried continuous phase, the oil droplets will have to be at the surface of the material to release the volatile compound. Considering single-phase systems, the volatile is dissolved within the matrix, and diffusion is the
dominant mechanism of release (Gunning et al, 1999). Considering these two
mechanisms, it is important to note the influence of the partitioning effect of the volatile in a biphasic system; i.e. the solubility of the volatile in the continuous phase, where it behaves locally like in a single-phase system (Gunning et al, 1999). If the partitioning effect is irrelevant, and the volatile is fully enclosed behind the matrix, the surface will have to degrade or dissolve
for release to occur (Gunning et al, 1999; Pothakamury and
Barbosa-Canovas, 1995, cit. in Madene et al, 2006).
1.2.3.2. Materials
Carbohydrates are extensively used in spray-dried encapsulation matrices. Such materials include starches, maltodextrins, corn syrup solids and acacia
gums, but also proteins and lipids (Madene et al, 2006; Pegg and Shahidi,
1999). The advantages of carbohydrates as an encapsulating agent are their
diversity, low cost and acceptability, but also the ability to form low viscosity solutions, even at high solids content, which is useful when drying the
22
are effective as wall materials, like in milk powders, infant formulas, instant
coffee and confectionery products (Ubbink and Krüger, 2006). Encapsulation
systems based on glassy carbohydrates have been very effective in minimizing the release of flavours and the oxidation of oxygen-sensitive
compounds (Ubbink and Krüger, 2006; Gehl-Hansen and Flink, 1997, cit. in
Roos and Karel, 1991); this is due to the extremely slow diffusion of
molecules, including oxygen, across the glassy matrix. The rates of diffusion depend on the carbohydrate matrix composition, but can also be minimized by lowering water activity, and changing the granule morphology to a larger, less
porous structure (Ubbink and Krüger, 2006). Amorphous matrices also provide
better rehydration conditions, due to their higroscopicity (Vega and Roos,
2005).
Lactose is a disaccharide, formed by a β-1,4 link between galactose and
glucose monomers (Campos, 2002). It is found exclusively in milk, and it is the
most widely used matrix for spray-dried systems, as well as the most common pharmaceutical excipient. This is due to its relatively neutral flavour, sufficient solubility and low viscosity of its concentrated solutions (Vega and Roos,
2005). Pure lactose has a glass transition temperature of 107ºC (Miao and
Roos, 2004, cit. in Vega and Roos, 2005), but small amounts of water are
sufficient to decrease this temperature to a great extent, leading to accelerated
rates of food degradation (Vega and Roos, 2005). Trehalose is a common
name for α,α-trehalose, a non-reducing disaccharide, formed by a 1,1 linkage of two D-glucose molecules. Its technical qualities in cryo-preservation and desiccation protection are regarded as very promising for the food industry,
also associated with low production costs (Vega et al, 2006). In its anhydrous
form it has the same molecular weight as lactose; however, it crystallizes as a dihydrate, which means sufficient water must be available for trehalose to crystallize.
Food proteins are also used as encapsulants, although not as extensively as carbohydrates; such materials include soy protein isolate, whey protein isolate,
and sodium caseinate (Kim et al, 1996, cit. in Madene et al, 2006;
Baranauskiene et al, 2005). These are polymers that show a great variety of
chemical groups, hence the ability to associate between themselves and also interact with many other substances, like water, small ions and other
23
compounds at oil/water interfaces; they also present amphiphilic properties, large molecular weight, and polymer chain flexibility. Food proteins have excellent properties for usage in encapsulation systems, such as high solubility, low viscosity, and good film-forming and emulsifying abilities
(Madene et al, 2006; Kaushik and Roos, 2006). Sodium caseinate is the result
of a disintegrated casein micelle, found in milk. Casein micelles contain 4
different types of protein, αs1- αs2- β- and κ- caseins, present respectively as
38, 10, 36 and 12% of total casein in bovine milk. They all contain a high level of proline in their primary structure, which prevents the formation of a secondary structure, keeping the molecules linear. Proline also improves the protein’s stability to denaturation and surface activity, rendering good
emulsifying properties (Vega and Roos, 2005). If found in excess, sodium
caseinate can also work as a matrix forming compound in encapsulation systems, apart from its role as an emulsifier.
1.2.3.3. Glass Transition and Crystallization
The study of thermal transitions, especially glass transition, has gained importance as a concept in material science of foods, due to their relation with
processing and stability of carbohydrate based foods (Ubbink and Krüger,
2006). Phase transitions like glass transition and crystallization, or other
phenomena like caking and melting may be predicted by an adequate
selection of the initial formulation of powders (Fuchs et al, 2005).
The glass transition temperature is related to volatile release, structural
collapse, matrix crystallization and amount of extractable oil (Gunning et al,
1999). An amorphous material has the capability to encapsulate as long as it
remains in the glassy state; if the temperature is raised above the Tg, the
material shifts to the rubbery state, causing release of the encapsulated molecules due to structure collapse and crystallization, to the same extent to
which storage temperature exceeds glass transition temperature (Roos and
Karel, 1991; Gunning et al, 1999). Nevertheless, it is possible that changing the material from the glassy to the rubbery state is enough for some of the core material to break through to the surface of the matrix, without the
influence of crystallization (Gunning et al, 1999). Lipid release from a lactose