Journal of Pharmacy and Pharmacology 6 (2018) 188-196 doi: 10.17265/2328-2150/2017.02.012
Achieving Enzyme Stability Using a Simple Fabrication
Procedure: The Alcohol Dehydrogenase Example
I. Ribauand E. Fortunato
Departamento de Ciências dos materiais, Faculdade de Ciências and Tecnologia, Universidade Nova de Lisboa, Campus de Caparica, Caparica 2829-516, Portugal
Abstract: The use of screen-printing biosensors has been updated in this article as a tool to analyze the electron transfer process
involving redox proteins or enzymes. The aim of this research was to fabricate a simple apparatus which allowed the use of the enzymes (in the solid state) to maintain their stability. To prove this concept an enzyme in the solid state was mixed with the carbon ink and this mixture was used to print the working electrode. We choose as proving the alcohol dehydrogenase. The first reason is because it metabolizes the alcohol, which can be present in biological samples of blood, saliva and urine and also in the beverage; the second is that this enzyme is still a challenge to electrochemistry due to having lower stability in sensors. The results show that in this device the enzyme was active and stable during all the experiments and in the experimental conditions that could catalyze the ethanol to acetaldehyde. These devices have the advantage of being disposable, cheap and are easy to fabricate. And also, they do not need expensive tools to be fabricated, they only need 2 µL of electrolyte or sample, and they need lower amounts of enzyme to permit electrochemical studies.
Key words: Paper biosensor, disposable, alcohol dehydrogenase, multiple use.
1. Introduction
The use of carbon as a base material to construct screen-printing devices have been employed, during the last decades, because it has adequate properties that allows not only its simple use as porous materials, but also it permits surface modification and is cheap [5-9]. Fabrication of paper-based devices has also been developed in the last ten years, but still it is a challenge. Paper is an environmental friend material, easily manipulated, cheap, and biocompatible; has high adaptability for analysis of different substances. These properties make paper the perfect physic base for introducing microfluidic channels and to be used in Point-of-care devices [5, 8-10]. One disadvantage of The use of disposable and miniaturized biosensors that can detect subtract, like glucose and ethanol, in biological fluid or in food, with accuracy has been developed since the nineties [1-5].
Corresponding author: Isabel Ribau, Ph.D., researcher,
research fields: biosensors and bioeletrochemistry.
this apparatus is the lower electron transfer rate between biosensing elements and the electrode surface. Another important disadvantage is the interference of temperature and humidity on migration forces of liquid in microfluidic channels, which may lead to electrochemical signal variations [5].
Although there has been a great investment in analytical research methods related to dehydrogenases, only a few researchers developed sensors based on it, since the cofactor regeneration is a limitation [2] and the low enzyme stability is still a limitation factor [4]. The NAD-dependence and his free-diffusion is also a limitation to its use. Some strategies pass through a stable immobilization of the cofactor and enzyme in sol-gel matrices [11], immobilization of the enzymes and cofactor in nano-structured carbon platforms or carbon nanotubes modified electrodes [12-14], in alginate-silicate hybrid gel [15] and other polymers [3, 4, 16].
The ADH (alcohol dehydrogenase) is a zinc-containing enzyme, usually used in the food
D
Achieving Enzyme Stability Using a Simple Fabrication Procedure: The Alcohol Dehydrogenase Example
189
industry [17]. The Saccharomyces cerevisiae produced three isoenzymes of alcohol dehydrogenase, YADH-1 (expressed during anaerobic fermentation), YADH-2 (cytoplasmic form repressed by glucose) and YADH-3 (found in mitochondria) [17]. ADH belongs to Alcohol: NAD+ oxidoreductase class and structurally it is constituted by an asymmetric homotetramer with four different subunits, organized as analogous dimmers, (see in Fig. 1).
The structural analysis suggests that the dimeric subunits asymmetry of the tetramer (that provided two structures, in open and closed conformation) may be relevant for the catalytic mechanism. Some subunits present a close conformation with coenzyme bound to the catalytic site, but others subunits present an open conformation without coenzyme. Each subunit contains a “catalytic” zinc and a “structural” zinc. The active site of each subunit contains a zinc atom [18]. In the close conformation, the catalytic zinc presents a tetrahedral coordination with two reactive sulfhydryl groups of Cys-43, Cys-153, with a histidine residue (His-66) and a water molecule [18]. Baskar, Ramaswamy,
Fig. 1 Structure for ADH1 (alcohol dehydrogenase) tetramer (each subunit presents different colour) in the open conformation from yeast (Saccharomyces cerevisiae) determined by X-ray crystallography [18]. The zinc atoms are shown as grey spheres. In the dimer, the catalytic subunits of the two subunits in open conformation are closely associated with one another. PDB code: 4W6Z. This figure was prepared with Viewerlite program.
and Plapp (2014) have proposed a mechanism by which zinc-bound water, in the close conformation, is substituted by an alcohol or aldehyde. In the open conformation zinc is coordinated with Cys-43, Cys-153, His-66, and the carboxylate of Glu-67 [18]. In this conformation the zinc coordination in the catalytic domain is inverted (relative to the classic coordination) and the active site zinc coordination is flexible, which facilitates the movements of the zinc ligands and helps the approximation of the zinc ion to Glu-67 [18]. The other zinc atom (structural zinc) is linked to four cysteine residues (97, 100, 103 and 111) and it is in an external location protected by disulphide bridges. Its function is still unclear, although it seems to have an important conformational role, by stabilizing the tertiary structure of each subunit [19]. Its removal from the enzyme did not reduce the catalytic activity, but the enzyme was more susceptible to heat denaturation [19].
This enzyme catalyses the reversible reaction [20, 21]:
NADH → NAD+
+H+ +2e- (1) CH3CH2OH + NAD+⇄ CH3CHO + NADH + H+ (2) In this reaction, the nicotinamide adenine dinucleotide hydrate (NAD+) receives the hydride ion from a reduced substrate, but at pH 7 (neutral pH) the equilibrium (2) is shifted to the left. ADH, also can use glucose and lactate as substrate, as well as it is capable to reduce substrates which make it important in biofuel cells and biobatteries [21, 22].
To analyze the presence of alcohol in drinks and its influence in the determination of glucose, we fabricated a biosensor using the alcohol dehydrogenase from Saccharomyces cerevisiae (baker’s yeast). The main goal of this project was to develop biosensors that could be used to analyze the quantity of ethanol, in the presence of glucose, in the blood and alcoholic beverages, including beer, wine and spirits. These devices allow not only the study of the electron transfer process, but also the ethanol detection.
Achieving Enzyme Stability Using a Simple Fabrication Procedure: The Alcohol Dehydrogenase Example
190
2. Experimental
2.1 Materials and Methods
All reagents used were of analytical grade. The alcohol dehydrogenase lyophilized powder from Saccharomyces cerevisiae (Sigma-Aldrich A7011) (ADH) was used with no further purification. This enzyme has a molecular weight 141-151 kDa, an isoelectric point between 5.4-5.8 and the optimal pH is reported to be in the range of 8.6 and 9.0 [17-19]. Ethanol (96%), β-D-glucose and potassium chloride were acquired from Sigma-Aldrich. All solutions were prepared with buffer. All buffers used in this work were commercial and purchased from ROTH (Germany). The electrolyte was a buffer solution with potassium chloride (0.1 M). The carbon ink and Ag/AgCl ink were purchased from conductive compounds.
2.2 Fabrication of the Biosensor
The fabrication process of the biosensor is very simple and reproductive. It has two main parts: first is the use wax to do delimitate the microfluidic channel; the second is the screen-printing of the electrodes above the wax and of the microfluidic channels.
A Xerox Color Qube 8570 printer from Xerox was used to print the hydrophobic region of the devices. The paper used was Whatman n.01 chromatographic paper, and the wax was obtained from Xerox. After the wax printing, the wax was heat treated during 10 s in a hot plate (150 °C). After that, the paper, cooled at room temperature was ready to perform the screen-printing technique. The configuration system designed was a three electrode system with an Ag/AgCl reference electrode, a carbon counter electrode and a working electrode based in carbon ink. Using a mesh the counter electrode was deposited above the hydrophobic matrix (wax). Then the mesh was removed and the device was allowed to heat at hot plate (60 °C) during 8 minutes. The other two electrodes had the same screen-printing treatment.
2.3 Working Electrode Preparation
A mixture with an enzyme in the solid state and carbon ink was prepared and used to fabricate the working electrode.
2.4 Electrochemical Detection
The ADH usually metabolizes ethanol to acetaldehyde in the presence of NAD+. Our experiments were performed without the addition of this cofactor to the working electrode or to the electrolyte solutions used.
During the electrochemical measurements, a drop of the interest solution (2 µL) spots in the hydrophobic channel between the wax-limited zones and dispersed through the paper matrix in a few seconds, being in contact with the three electrodes. The electrochemical behaviour of each electrode was experimentally characterized through cyclic voltammetry.
All electrochemical acquisitions and measurements were performed in a Gamry ESA419 data acquisition system, using PHE 200 physical electrochemical and PV 220 physical electrochemical software coupled with a Gamry instruments (reference 600) potentiostat/galvanostat (ZRA) and the data analysis was processed by Gamry software package. All the experimental procedure is performed in normal atmosphere in the presence of oxygen.
3. Results and Discussion
3.1 Electrochemistry of ADH in Screen-Printing Electrodes
Voltammetric experiments at the screen-printing sensor have been performed in the electrolyte (phosphate buffer, pH 7) to obtain the ADH electrochemical signal, in non-turnover conditions. No modification was necessary in order to achieve direct electrochemistry of ADH. In the experiments, the electrode surface and the active site of the enzyme could be considered as a donor-acceptor pair and it is
possible to u transfer [23] distance bet have direct e that the tran mechanism conformatio can be seen defined ano peaks were Fig. 2). The all pe root of the mVs-1 thus The parame cathodic pea Fig. 2 Cyclic from -0.4 V electrode; a c in cathodic (Δ 0.009, R² = 0.9 0.9853; (Δ) ipc A use Markus th ]. In this cont tween donor electron trans nsfer occurre [24]. This i on, where the in the crysta odic peaks an observed in eak currents sweep rate denoting a eters obtained ak, Epa = (+65 c voltammogra to -0.4 V, at a arbon counter Δ) and anodic ( 9939; (Δ) ipc = c = -14.839v1/2 -Achieving Enz heory to desc text it is know atom and a fer is approxi ed via an ele is only possi active site is al structure [1 nd two well-different sca vary linearly between 20 diffusion-co d for the cou 5 ± 3) mV and ams (20 mVs-1 a screen-print r electrode; a w (○) current pea -1.8312v1/2 + - 0.253, R² = 0. zyme Stability The Alcohol
cribe this elec wn that the m acceptor atom imately 10 Å, ectron tunnel ible in the o s accessible, 7, 25]. Two -defined cath an rates (se y with the sq mVs-1 and ntrolled proc upled I/II wer d an anodic p
< v < 100 mV
ting electrode working electro aks with the sq 0.019, R² = 0.9 .9829) (B). y Using a Sim Dehydrogen ctron major m, to , and lling open as it well hodic ee in quare 100 cess. re: a peak, Ep c pea form rati also F a ca pea Ep of E to c 0.82 rate the that infl s-1) in a 2 µL e with a three e ode based in ca quare root of th 9997) (A); Cur mple Fabricat nase Example = (-152 ± 8) ak, Ep, of ( mal potential o of anodic o estimated at For the couple athodic peak, ak, Epc = (+22 p, of (95 ± 5) E0’ = (268 ± cathodic peak 2 ± 0.03. Alt e, Ep varies w unit. These d t it’s not only luenced by th
electrolyte (pho electrodes syst arbon ink (1.0 g he scan rate. C rrent peaks III
tion Procedur e mV, a separa (-218 ± 11) , E0’, of (-44 to cathodic p t 0.45 ± 0.03. ed III/IV the e , Epa = (+315 20 ± 9) mV, a ) mV vs.Ag/A 6) mV vs.A ks current, |ipa though ip/v1/2 with the scan r data suggest y controlled b he kinetics of osphate buffer ( tem configura g) with AHD (1 Current peaks I I and IV ((◌) i re: ation of anodi mV vs.Ag/ ± 3) mV vs. peaks current . estimated para 5 ± 4) mV an a peak-to-pea
AgCl and for Ag/AgCl. A ra
a
/ipc| was also is independen rate and |ipa/ip
a quasi-rever by diffusion, the electrode
(pH 7.0) with K ation (an Ag/A
14 mg)). Insert II and I ((○) ip ipa = 7.0835v1/2 191 ic to cathodic /AgCl and a Ag/AgCl. A t, |ipa/ipc| was
ameters were: nd an anodic ak separation, rmal potential atio of anodic o estimated as nt of the scan p c | is far from rsible system but it is also e process. KCl (100 mM)) AgCl reference tion: Variation a = 2.1772v1/2 -+ 0.0837, R² = c a A s : c , l c s n m m o ) e n - =
192
Fig. 3 Cyclic with a three e electrode base Scan rate dep
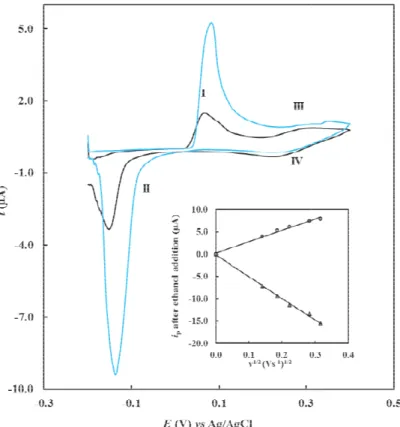
To verify enzyme, and domain, we see that the p ethanol. Thi which peak I and II, Fig A cathodi Ep c , (-149 ± could be ob both peaks. A a peak-to-pe obtained in a It’s possi correspond t with the etha enzyme is n has the corre condition the A c voltammogra electrode syste ed in carbon in pendence of the y if we were d the peaks th used ethanol peaks I and I is information corresponds . 3. ic peak, Epa, (+ ± 13) mV app bserved with A midpoint p eak separatio agreement wi ible to verif to the catalyt anol addition not in the inac
ect conformat e enzyme is i Achieving Enz ams (v = 35 m em configurati nk (1.0 g) with A e cathodic (Δ) in the presen hat correspon as substrate. I, increased i n permitted t to the catalyt +84 ± 3) mV peared. A ca an increase i potential of (-on of (-233 ith the previo fy that the tic process on n. We can also ctive conform tion to catalyz n the open co zyme Stability The Alcohol mVs-1) in phosp ion with an Ag AHD (14 mg) i and anodic (○) nce of the ac nd to the cata It was possib in the presenc the identifica tic domain, p and anodic p atalytic behav in the current -33 ± 6) mV, ± 16) mV, ous data. peaks II an nce they incr o assume that mation and th ze ethanol. In onformation, w y Using a Sim Dehydrogen phate buffer (p g/AgCl referen in the absence ) peak current ctive lytic ble to ce of ation eaks peak, viour ts in and are nd I rease t the hat it n this with the F volt an cata stru pote shap and T inve solu elec cyc reco in th area reco the mple Fabricat nase Example pH 7.0) and 10 nce electrode, a (___) and in the t. active site ac From these re tammograms electrochem alytic domain uctural zinc. ential (-0.5 V pe is almost t d IV disappea The effect of estigated ove ution all wit ctrolyte was a lic voltamm orded. After t he electrolyte a, and agai orded. The pH absence and tion Procedur e 00 mM KCl at a carbon coun e presence (___) ccessible to th esults, we ca of the alcoho mical signal n and anoth After the ap V vs. Ag/Ag the same as i ar and peaks I f pH on ADH er a range 3-th KCl (0.1 added in the w mograms at d that, 2 µL of e used before in the cycli H dependence d in the prese re: t a screen prin nter electrode a of ethanol (2.4 he substrate ( an suggest th ol dehydrogen correspond her correspon pplication of gCl), the vol in Fig. 1, but I and II remai H signal volta 10, using dif M). Initially working area, different sca ethanol solut was added in ic voltamog e of the forma ence of ethan nting electrode and a working 4%). Insertion: ethanol). hat the cyclic
nase presents ding to the ndent to the f a reduction tammograms the peaks III in.
ammetry was fferent buffer y a drop of , and then the an rate were tion prepared n the working gramas were al potential in nol shows an e g : c s e e n s I s r f e e d g e n n
increase bet value is alm Since the electrostatic hydrogen coordination also with the neighbourho simple. How altering the analyze a pK site related t formal pote estimation fr can be attrib pKa of 4.4 [2 Fig. 4 pH absence (○) a estimated at different buff ethanol prepa a screen prin configuration counter electr ink (1.0 g) w cathodic (Δ) root of the sca in the absenc (3.4 M). The 0.3549, R² = 0 (Δ) ipc = -3 -1.2988v1/2 + 0 A tween pH 3 most constant ( formal poten and hydro bonding, z n and geomet e movement ood of the a wever, it is im pH values of Ka transition to an acid tran ential variatio from the expe
buted to glut 26]. It is imp
dependence o and in the pres
t 4.6). Cyclic fer solutions w ared in differen nting electrode n with an Ag/A rode and a wo with AHD (1 and anodic (○ an rate, acetate ce (bold) and i best fitting cu 0.9894; (●) ipa = .2926v1/2 + 0. 0.0941, R² = 0. Achieving Enz and pH 5, b (see in Fig. 4 ntial of an enz ophobic env zinc axial try, and solve of the amino ctive site, its mportant to hi f the medium in the vicinit nsition. In the on with the rimental data tamic acid, w portant to un of the formal sence (Δ) of eth c voltammogr with KCl (100 nt buffer with e with a three gCl reference e orking electrod 4 mg). Insert ○) current peak e buffer (pH 4) in the presence urves were: (○ = 1.8149v1/2 - 0 .2051, R² = 0 9861. zyme Stability The Alcohol
but after that, ). zyme is relate vironment, w ligands, ent exposure acid chain in s analysis is ghlight that u m, it is possibl ty of the cata ese conditions pH allows a of 4.6. This which presen derline that in l potential in hanol (3.4 M) rams recorded mM) (○) and KCl (0.1 M) (Δ e electrode sy electrode, a ca de based in ca tion: Variatio ks with the sq ) with KCl (0.1 e (light) of eth ○) ipa = 4.6442v 0.1664, R² = 0.9 0.9805; (▲) i y Using a Sim Dehydrogen , pH ed to with zinc and n the not upon le to lytic s the pKa pKa nts a n the n the (pKa d in with Δ), at ystem rbon rbon on in quare 1 M), hanol v1/2 - 9749; ipc = enz tetr and that the imp iden the enz 3.2 B biol app inve elec rang gluc seei is n Fig. buff elec Ag/A and AHD gluc mple Fabricat nase Example zyme open ahedral coord d with the car
t the substitu catalytic ef portance in th ntification of presence of t zyme in the w ADH and Gl Because gluco logical fluids plicability of estigated th ctrochemical ge between cose promot ing in Fig. 5. not sense. . 5 Cyclic vol fer (pH 5.0) ctrode with thr AgCl referenc d a working el D (14 mg) in th cose (63 mM). tion Procedur e conformation dinated with rboxylate of utions of Glu-fficiency by he catalytic m f the pKa in o he active and working electr lucose ose is present s, and our aim
this sensor he influence signal of th 25 mM and ted an incre Below 25 mM tammograms ( and 100 mM ree electrode sy ce electrode, a lectrode based he absence (___) re: n, the cataly 43, Cys-Glu-67 [18, 2 -67 with Gln 100-fold [18 mechanism, co our experime d open conform rode. t in a beverag m was to dem in multiple u e of gluco he enzyme at d 100 mM, i ase in the c M the presen (v = 50 mVs-1 KCl at a sc ystem configur a carbon coun d in carbon in
) and in the pre
193 ytic zinc is -153, His-66, 25]. The fact n-67 decrease 8] reflect its orroborate the ents, and also mation of the ge but also in monstrate the use, we also ose in the t pH 5. In a in pH 5, the current peak ce of glucose ) in phosphate creen printing rations with an nter electrode k (1.0 g) with esence (- - -) of 3 s , t e s e o e n e o e a e k e e g n e h f
Achieving Enzyme Stability Using a Simple Fabrication Procedure: The Alcohol Dehydrogenase Example
194
This result has two meanings, the first one is operational—in samples with glucose in a concentration higher than 25 mM, it will interfere with the measurements of ethanol; the second is functional—this enzyme in the open conformation can not only catalyse the ethanol but also glucose. The implication of this last finding is that it is also possible to use glucose as a substrate of the ADH and this system can be used to develop biofuel cells and biobatteries. This result was also reported by Wang and co-workers in 2012 [21].
3.3 ADH and Ethanol Detection
The ethanol detection at pH 5 (the typical drinks/beverage pH) and pH 7 (blood, pH 7.4) was analyzed. This determination pretends to prove the ubiquity/utility of the fabrication procedure, which allow the stability of the enzyme and its functioning in different pH.
At pH 5, the ipa catalytic (v = 80 mV⋅s-1) varies linearly
Fig. 6 Catalytic current curve variation with the ethanol concentration between 2.4% (v/v) and 19.6% (v/v). Cyclic voltammograms recorded in buffer solutions (pH 5) with KCl (100 mM) (○) and with ethanol prepared in buffer (pH 5) with KCl (0.1 M), at a screen-printing electrode with a three-electrode system configuration with an Ag/AgCl reference electrode, a carbon counter electrode and a working electrode based in carbon ink (1.0 g) with AHD (14 mg). The best curve fit in the range of 2.4%-19.2% are ipa cat
= 0.029 [ethanol] + 1.023, R² = 0.989. Each point is the average of at least two measurements made with different screen-printing biosensors.
with the ethanol concentration in the range of 2.4%-9.6% shown in Fig. 6.
With this sensor it will be possible to quantify the ethanol in acid samples like beverage (wine, beer) which have an ethanol concentration between 2.4 % and 19.2%.
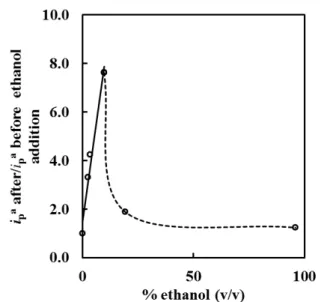
The variation of the catalytic current with the ethanol at pH 7 was also investigated. The curve obtained with standard solutions shows a linear variation in the range of 0% and 9.6%, and then a higher decrease in Fig. 7. This result shows that the sensor can also detect ethanol in samples with pH near 7, like blood, in the range of 2.4%-9.6%.
Since glucose in concentration lower 25 mM does not interfere with the biossensor, it can be used to determine the alcohol in drinks with glucose. It also can be used to test alcohol in the blood since the normal glucose concentration is under 4.4 mM or below 6.6 mM [27].
Fig. 7 Variations of the ip a
after/ip a
before ethanol addition with the ethanol concentration between 2.4% (v/v) and 19.6% (v/v). Cyclic voltammograms recorded in PBS buffer solutions (pH 7) with KCl (100 mM) and with ethanol prepared in PBS buffer (pH 7) with KCl (0.1 M), at a screen printing electrode with a three electrode system configuration with an Ag/AgCl reference electrode, a carbon counter electrode and a working electrode based in carbon ink (1.0 g) with AHD (14 mg). The best curve fit in the range of 2.4%-9.6% is ipa cat = 0.664[ethanol] + 1.493, R² = 0.9735.
Each point is the average of two measurements made with different screen-printing biosensors.
Achieving Enzyme Stability Using a Simple Fabrication Procedure: The Alcohol Dehydrogenase Example
195
4. Conclusions
The main goal of this paper was to present a simple and economic biosensor fabrication procedure that permits the use of enzymes in the solid state and improve their stability. To prove this idea we mixed lyophilized powder of ADH with the carbon ink and used it to print the working electrode of a biosensor. The construction of a working electrode by simply mix carbon ink with ADH permits stabilizing the enzyme and allows obtaining an electrochemical reversible signal. This way it was possible to have stable redox signals of the ADH with this sensor, corresponded to peaks I and II (Fig. 2).
The observed electron transfer between the electrode-enzyme pair is a diffusion-controlled-process that occurs in the formal potential of (-44 ± 3) mV vs. Ag/AgCl. These biosensors also sense the presence of alcohol. On the basis of the above results, it’s proposed that ADH can directly transfer electrons to the electrode surface of this sensor, enabling the ethanol diffusion from the solution to the electrode surface, which has enzymes. Having this in mind it is also possible to assume that the enzyme presents a stable open conformation which allows its functioning. The ethanol will bond directly to the zinc, via glutamic acid, and the catalysis will occur. We propose that the peaks III and IV (Fig. 3) correspond to another electron transfer process that is reversible, but it is not related to the catalysis. Our purpose is that the peaks III and IV are related to the reversible oxidation/reduction of the structural zinc.
The environment that surrounds the enzyme in the carbon ink, facilitate its stability and the permanence of the cofactor which are entrapped in the vicinities of the active site of the enzyme and does not leave the enzyme. The enzyme is enclosed in the carbon ink, which does not facilitate the escape of the cofactor by free-diffusion to the electrolyte.
The findings, published in this article suggest that this paper device permits the ethanol determination, in the range of 2.4-9.6% (v/v) at pH 7 and in the range of
2.4-19.2% at pH 5 in the presence of glucose (in concentrations lower than 25 mM).
These results encourage further investigations concerning the use of this fabrication procedure to study electron transfer mechanisms that involve redox proteins with more than a redox center and the use of this concept to develop biobatteries.
References
[1] Park, J., Yee, H., Lee, K., Lee, W., Shin, M. and Kim, T. 1999. “Determination of Breath Alcohol Using a Differential-Type Amperometric Biosensor Based on Alcohol Dehydrogenase.” Anal. Chim. Acta. 390: 83-91. [2] Alpat, S., and Telefoncu, A. 2010. “Development of an
Alcohol Dehydrogenase Biosensor for Ethanol Determination with Toluidine Blue O Covalently Attached to a Cellulose Acetate Modified Electrode.” Sensors 10: 748-64.
[3] Koyuncu, D., Erden, P., Pekyardimci, S., and Kiliç, E. 2007. “A New Amperometric Carbon Paste Enzyme Electrode for Ethanol Determination.” Analytical Letters 40: 1904-22.
[4] Bolivar, J., Rocha-Marín, J., Mateo, C., and Guisán, J. 2012. “Stabilization of a Highly Active but Unstable Alcohol Dehydrogenase from Yeast Using Immobilization and Post-immobilization Techniques.” Process Biochemistry 47: 676-86.
[5] Sekretaryova, A., Eriksson, M., and Turner, A. 2016. “Bioelectrocatalytic Systems for Health Applications.” Biotechnology Advances 34: 177-97.
[6] Blanco, E., Foster, C., Cumba, L., Carmo, D., and Banks, C. 2016. “Can Solvent Induced Surface Modifications Applied to Screen-Printed Platforms Enhance Their Electroanalytical Performance?” Analyst 141: 2783-90. [7] Nie, Z., Deiss, F., Liu, X., Akbulut, O., and Whitesides, M.
2010. “Integration of Paper-Based Microfluidic Devices with Commercial Electrochemical Readers.” Lab on a chip. 10: 3163-9. DOI: 10.1039/c0lc00237b.
[8] Nie, Z., Nijhuis, C., Gong, J., Chen, X., Kumachev, A., Martinez, A., Narovlyansky, M., and Whitesides, M. 2010. “Electrochemical Sensing in Paper-Based Microfluidic Devices.” Lab on a chip 10: 477-83. DOI: 10.1039/b917150a.
[9] Santhiago, M., and Kubota, L. 2013. “A New Approach for Paper-Based Analytical Devices with Electrochemical Detection Based on Graphite Pencil Electrodes.” Sensores and Actuators B 177: 224.
[10] Costa, M., Veigas, B., Jacob, J., Santos, D., Gomes, J., Baptista, P., Martins, R., Inácio, J., and Fortunato. E. 2014. “A Low Cost, Safe, Disposble, Rapid and Self-sustainable
Achieving Enzyme Stability Using a Simple Fabrication Procedure: The Alcohol Dehydrogenase Example
196
Paper-Based Platform for Diagnostic Testing: Lab-on-Paper.” Nanotechnology 25: 094006.
[11] Wang, Z., Etienne, M., Quilés, F., Kohring, G. W., and Walcarius, A. 2012. “Durable Cofactor Immobilization in Sol-Gel Bio-composite Thin Films for Reagentless Biosensors and Bioreactors Using Dehydrogenases.” Biosens. Bioelectron. 15 (32): 111-7. doi: 10.1016/j.bios.2011.11.043.
[12] Neto, S., Forti, J., Zucolotto, V., Ciancanglini, P., and De Andrade, A. 2011. “The Kinetic Behavior of Dehydrogenase Enzymes in Solution and Immobilized onto Nanostructured Carbon Platforms.” Process
Biochemistry 46: 2347-52. DOI:
10.1016/j.procbio.2011.09.019.
[13] Tsai, Y-C., Huang, J-D., and Chiu, C-C. 2007. “Amperometric Ethanol Biosensor Based on Poly (Vinyl Alcohol)-Multiwalled Carbon Nanotube-Alcohol Dehydrogenase Biocomposite.” Biosensors and bioelectronics 22: 3051-6.
[14] Manso, J., Mena, M.,Yáñez-Sedeño, and Pingarrón, J. 2008. “Alcohol Dehydrogenase Amperometric Biosensor Based on a Colloidal Gold-Carbon Nanotubes Composite Electrode.” Electrochimica Acta. 53: 4007-12.
[15] Schlager, S., Neugebauer, H., Haberbauer, M., Hinterberger, G., and Sariciftci, N. 2015. “Electrochemical Addressing of Immobilized Alcohol Dehydrogenase for the Heterogeneous Bioelectrocatalytic Reduction of Butyraldehyde to Butanol.” Chemcatchem 7: 967-71. DOI: 10.1002/cctc.201402932.
[16] Zhang, M., Mullens, C., and Gorski, W. 2007. “Coimmobilization of Dehydrogenases and Their Cofactors in Electrochemical Biosensors.” Analytical Chemistry 79: 2446-50. doi:10.1021/ac061698n.
[17] Leskovac, V., Trivić, S., and Peričin, D. 2002. “The Three Zinc-Containing Alcohol Dehydrogenases from Baker’s.” FEMS Yeast Research 2 (4): 481-94.
[18] Baskar Raj, S., Ramaswamy, S., and Plapp, B. 2014. Yeast
“Alcohol Dehydrogenase Structure and Catalysis.” Biochemistry 53: 5791-803.
[19] Magonet, E., Hayen, P., Delforege, D., Delaive, E., and Remacle, J. 1992. “Importance of the Structural Zinc Atom for the Stability of Yeast Alcohol Dehydrogenase.” Biochemical Journal 287: 361-5. DOI: 10.1042/bj2870361.
[20] Santos, A., Freire, R., and Kubota, L. 2003. “Highly Stable Amperometric Biosensor for Ethanol Based on Meldola’s Blue Adsorbed on Silica Gel Modified with Niobium Oxide.” J. Electroanal. Chem. 547: 135-42.
[21] Santos, A. S., Pereira, C. A., Duran, N., and Kubota, L. T. 2006. “Amperometric Biosensor for Ethanol Based on Co-immobilization of Alcohol Dehydrogenase and Meldola’s Blue on Multi-wall Carbon Nanotube.” Electrochim. Acta. 52:215-20.
[22] Wang, Z., Etienne, M., Poller, S., Schumann, W., Kohring, G. W., Mamane, V., and Walcarius, A. 2012. “Dehydrogenase-based Reagentless Biosensors: Electrochemically Assisted Deposition of Sol-Gel Thin Films on Functionalized Carbon Nanotubes.” Eletroanalysis 24: 376-85. DOI: 10.1002/elan.201100574 [23] Marcus, R., and Sutin, N. 1985. “Electron Transfers in
Chemistry and Biology.” Biochim. Biophy. Acta. Rev. Bioenerg. 811: 265-322.
[24] Armstrong, F., Hill, H., and Walton, N. 1985. “Reactions of Electron-Transfer Proteins at Electrodes.” Q. Rev. Biophys. 18: 261-322.
[25] Baker, P., Britton, K., Fisher, M., Esclapez, J., Pire, C., Bonete, M., Ferrer, J., and Rice, D. 2009. “Active Site Dynamics in the Zinc-Dependent Medium Chain Alcohol Dehydrogenase Superfamily.” Proc. Natl. Acad. Sci. 106: 779-84.
[26] Stryer, L. 1995. In Biochemistry. Fourth edition, W. H. Freeman and Company. New York.
[27] Wang, J. 2008. “Electrochemical Glucose Biosensors.” Chem. Rev. 108: 814-25.
![Fig. 1 Structure for ADH1 (alcohol dehydrogenase) tetramer (each subunit presents different colour) in the open conformation from yeast (Saccharomyces cerevisiae) determined by X-ray crystallography [18]](https://thumb-eu.123doks.com/thumbv2/123dok_br/18152882.872153/2.893.122.401.659.929/structure-dehydrogenase-different-conformation-saccharomyces-cerevisiae-determined-crystallography.webp)