UNIVERSIDADE DA BEIRA INTERIOR
Ciências Sociais e Humanas
The nonlinearity of financial depth and economic
growth:
Evidence from European countries
Ricardo Filipe Futre Carreira
Dissertação para obtenção do Grau de Mestre em
Economia
(2º ciclo de estudos)
Orientador: Prof. Doutor José Alberto Serra Ferreira Rodrigues Fuinhas
Acknowledgements
To my family, for the unconditional support provided during the academic journey and for reuniting all the social, economic and affective conditions.
To my friends, for delivering the necessary help in the harsh periods and for making everything easier through the good mood and companionship.
I would like to highlight the teacher’s role, especially Prof. Dr. Jose Alberto Fuinhas for accepting my guidance request and for the assistance provided during the essay elaboration.
Last but not least, enhance the active role of the people that interact with me until now.
Resumo
A relação não linear entre Crescimento Económico e Profundidade Financeira foi avaliada com recurso a um painel de 25 países europeus, para o período compreendido entre 1996 e 2011. Estes países partilham padrões espaciais comuns como foi confirmado pela presença de dependência seccional. Além disso, foi identificado heterocedasticidade e autocorrelação de primeira ordem no painel. O teste de Hausman suporta a presença de heterogeneidade, selecionando o modelo de efeitos fixos. Foi utilizado o estimador Driscoll e Kraay com efeitos fixos, que é robusto a estes fenómenos. A não linearidade da relação entre Crescimento Económico e Profundidade Financeira foi confirmada pelo U-teste de Lind e Mehlum. Pode-se concluir que o incremento na profundidade financeira restringe o Crescimento Economico para os países europeus. Como tal, a dimensão ótima do sector financeiro deve ser considerada pelos decisores de política económica.
Palavras-chave
Abstract
The nonlinear relationship between Economic Growth and Financial Depth was assessed with a panel of 25 European countries, for the period between 1996 and 2011. These countries share common spatial patterns as was confirmed by the presence of cross-sectional dependence. Furthermore, heteroskedasticity and first order autocorrelation are present in the panel. The Hausman test supports the presence of heterogeneity by selecting the fixed effects model. In accordance, the robust estimator to this phenomena, the Driscoll and Kraay with fixed effects, was used. The nonlinearity of the relationship was confirmed by the U-test of Lind and Mehlum. In short, results confirmed that excess of financial development constraint growth for the European countries. The optimal dimension of financial sector should be considered by policymakers.
Keywords
Table of contents
1 – Introduction ... 1
2 – Discussion about state of art: ... 2
2.1 – The Economic Growth and the Financial Depth ... 2
2.2 – EG, FD and Financial Liberalization ... 2
2.3 – EG, FD and the Stock Markets ... 3
2.4 – EG, FD and Energy ... 4
2.5 – EG, FD and the nonlinearity ... 4
3 – Data description: ... 6
4 – Methodology and preliminary tests: ... 9
5 – Results and discussion: ... 13
6 – Conclusion ... 15
Tables List
Table 1 – Variables description and descriptive statistics Table 2 – Correlation matrix and VIF statistics
Table 3 – diagnostic tests Table 4 - Unit Root test
Table 5 – Stata commands and options Table 6 – Results from the estimators Table 7 – U–Test
List of Acronyms
EG Economic Growth FD Financial Depth GDP Gross Domestic Product
DCBS Domestic Credit provided by Banking Sector DCPS Domestic Credit provided by Private Sector WDI World Development Indicators
EIA Energy Information Administration CSD Cross-Section Dependence
VIF Variance Inflation Factor FE Fixed Effects
RE Random Effects OLS Ordinary Least Squares
GMM Generalized Method of Moments PCSE Panel-Corrected Standard Errors FGLS Feasible Generalized Least Squares DK Driscoll and Kraay
1 – Introduction
The relationship between Financial Depth (FD) and Economic Growth (EG) was remounts to the early of XIX century, when Schumpeter (1912), Robinson (1952), Goldsmith (1969), McKinnon (1973) and Shaw (1973) were, among others, the firsts to document this issue. These former seminal literature on FD reveals a lack of consensus that is persistent. Indeed, financial intermediaries could promote economic efficiency which leads to the EG (Levine, 1997), or could lead to the reverse (e.g. Demetriades and Hussein, 1996). Moreover, the impact of FD on EG remain a hot topic in literature. The literature evolved to capture the relative dimension of finance in the economy. This financial dimension, has been used in research throughout indicators such as size of banks, financial institutions and financial markets. Indeed, the FD can be aggregated and related to output. The nexus of FD-EG remains largely inconclusive to the economies. This lack of consensus materializes on causality direction and it type of specifications. The main objectives of this essay are: (i) is there a relationship between EG and FD in Europe; and (ii) if this relationship subsists, what is the functional form.
To disentangle the nexus FD-EG in developed economies, the European Union countries which have available data in the span of time was used. The model included variables such as Gross Domestic Savings, ratio of private sector credit to Gross Domestic Product to measure FD, governmental expenditures, commercial balance, electric consumption and inflation in order to control other interactions that are necessary for FD-EG nexus analysis. Particular attention was provided to the construction of the variable which measures the FD and robust econometric techniques were used. We innovated by adding the dimension of energy consumption to the nexus. The Hausman test selected Fixed Effects model as the most suitable for the estimation. Heteroskedasticity and cross sectional dependence for the counties panel was found, and in accordance the Driscoll and Kraay (1998) estimator was used. Commercial balance, government expenditures, and electrification are drivers for growth. By the reverse, a negative effect occurred to inflation, and to FD. An inverted U – shape form was confirmed for FD through the U-test from Lind and Mehlum (2010).
The rest of the essay is organized as follows: Section 2 review of the literature. Section 3 describes data. Section 4 center on empirical methodology. In section 5, the results are discussed. Section 6 concludes.
2 – Discussion about state of art:
The discussion of the literature will be comprised. Moreover, the following part of the essay will be discussed on topics and threats the financial liberalization, stock markets, energy and the nonlinearity.
2.1 – The Economic Growth and the Financial Depth
In the last century, FD and EG received several contributions. Since the first steps delivered by Schumpeter (1912), Robinson (1952), Goldsmith (1969), McKinnon (1973) and Shaw (1973) that the literature tries to provide sustained theories to explain this nexus. Special attention has been given to the directional causal relationship between FD and EG and a concern to extend the theme to other related areas.
The relationship between FD and EG is controversial. In the early stages, Schumpeter (1912) believed that financial intermediaries were the responsible for the EG. This view was reinforced by Shaw (1973) and McKinnon (1973). Latter, Robinson (1952) argues the opposite, i.e. EG is the responsible to promote the financial development. The development of the economic literature in this area was quite remarkable, exposing clearly the relationship between FD and EG. (See, King and Levine, 1993a,b; De Gregorio and Guidotti, 1995; Odedokun, 1996; Demetriades and Hussein, 1996; Rioja and Valev, 2004). Nowadays the nexus FD-EG keeps in evidence among with new contributions added to the literature.
2.2 – EG, FD and Financial Liberalization
The financial liberalization can produce a positive impact on growth. In fact, contributions to this phenomena may be produced by the abolition of repressive policies and the establishment of the necessary measures to develop the financial sector (See, Arestis et al., 2002; Ang and McKibbin, 2007; Gamra, 2009; Carreira and Silva, 2010; and Misati and Nyamongo, 2012). A lower contribution of FD is assisted when policymakers decide to constrain the financial system. Moreover, the investment rate is reduced and produce a negative effect on growth (McKinnon, 1973; and Shaw, 1973).
A higher saving rate is verified when liberalization policies are applied in the banking sector. This fact occurs due to the rise of deposit interest rates and competition. Consequently, a higher monetary availability to preform investments is verified, leading to EG (Bumann et al., 2013). The same author “blames” the competition and the risk diversification by the loan rates reduction. Indeed, this promotes lower debt costs and a higher investment rate becoming positive arguments in the relationship between EG and the financial liberalization.
In the literature, it is exposed through empirical observations that if financial liberalization is not well implemented may conduct to severe financial crisis. In Stiglitz (2000) the innumerous financial crisis verified have for principle the financial market liberalization. In fact, this results due to the aggravation of the asymmetric information problems and a block of efficiency in the financial intermediaries. The Competition can be assessed in other view. A rise of competition introduces instability at the financial intermediaries. Besides that, financial intermediaries already face the problematic of asymmetric information and retrenchment of profit margins (Bumann et al., 2013). The financial liberalization removes stability to the banking sector and becomes more likely to suffer a financial crash. To deal with the retrenchment of profit margins, the banking sector took unnecessary risks in an attempt to increase profits (Hellmann et al., 2000). With this course of events, a country becomes exposed and with bigger odds to suffer a financial crisis.
The lack of agreement in this theme shows that the relationship between EG and financial liberalization is ambiguous. Indeed, financial liberalization can promote EG but also a financial crash due to the introduction of instability in the banking sector and unreal assumptions (See, Arestis and Demetriades, 1999; Stiglitz, 2000 and Bumann et al., 2013)
2.3 – EG, FD and the Stock Markets
Another highlighted study area in the literature are the stock markets, namely by Pagano (1993), Alfaro et al. (2004), Hondroyiannis et al. (2005). Some studies opt to focus the capital markets, like Stiglitz (2000) does but the large body of this study area goes to the stock markets (See, Beck and Levine , 2004; Capasso, 2008; and Marques et al. 2013).
There are several mechanisms by which financial markets impact positively or negatively in the EG. The stock markets
The stock markets, through the social capital turn firms more controlled. Moreover, the asymmetric information is reduced due to stock-exchange listing which channels all the players to the final goal of the company: generate profits (Nieuwerburgh et al., 2006). Financial markets provide more flows to investors by assessing funds, reducing financial restrictions, allowing the risk diversification and providing higher levels of investment due to the possibility of buying shares (Obstfeld, 1994). Plus, the financial markets channels investments to long-term deposits instead of short-term due to higher profitability. (Bencivenga and Smith, 1991; Xu, 2000).
Financial markets may produce negative effects to the EG. This event is related to the weak development of capital markets. In some cases, when this phenomena is verified
2000). With the pressure on banks, there is a reduction in interest rates and changes in consumption patterns (Carreira and Silva, 2010). In a closed economy, an increase of consumption in the present, can cause a reduction in the savings rate and the level of investment, slowing down the EG.
2.4 – EG, FD and Energy
The impact of FD on energy consumption is giving the first steps in the literature. Financial development promotes energy consumption indirectly through the EG. Indeed, the EG is connected to the need of constructing infrastructures capable of accommodate more firms and services (Ang, 2007). The installation of firms is associated with higher energy consumption levels. Moreover, it is easier to entrepreneurs to have access to the financial credit and expand their firm. Bigger firms are allowed to gain access to the stock market which provides a positive signal of economic growth. The access to the stock markets consents the risk diversification and higher funds availability to apply in investment projects. This chain of events creates the necessary conditions to develop the economy and creates energy demand (See, Sadorsky, 2010; Coban and Topcu, 2013; Komal and Abbas, 2015).
In the literature it is found that when an upraise of energy consumption is verified when a country is growing (Halicioglu, 2009). It is known the relationship between EG and energy consumption, i.e. increasing one of the factors causes an increase on the other. However the causality direction between them is not clear. In the literature, can be found a bi-direction causal relationship between EG and energy consumption (Fallahi, 2011). Others sustain a unidirectional causal relationship from energy consumption to EG (Warr and Ayres, 2010). Furthermore, Al-Mulali and Sab (2012) points out that energy consumption propels both EG and FD but carries consequences like pollution. The problematic of pollution brings the solution of the optimal energy mix. Taking into account the environmental and economic needs, it is necessary to apply monetary resources to the energy industry to foster energy savings. The goal of increasing energy production efficiency is to achieve the entire energy potential (Al-Mulali and Sab, 2012).
2.5 – EG, FD and the nonlinearity
Economic theory suggest that FD has a significant role on growth. In fact, when the number of financial institutions and instruments increases, this contribute to reduce the information and the transactions costs. Thus, developed financial markets help economic agents to trade and diminish transaction risks. These conditions increase the investments and stimulates economic growth (Masten et al., 2008). However, the existence of some constraints, such as geographic, temporal, financial and methodological conditions, allows to reveal a nonlinearity (De Gregorio and Guidotti, 1995). The former authors, along with
Demetriades and Hussein (1996) were the first to document the nonlinearity in the nexus EG-FD.
Berthelemy and Varoudakis (1996) introduced the concept of limits to FD. Based on this former study, Rioja and Valev (2004) split countries into groups and established critical values to the limits. This allowed them to determinate the different phases of the impact of FD on EG. Following this path, we can find in first instance that it is necessary to achieve a minimum of financial development value to register EG. Subsequently, especially in smaller economies, there is a sharp increase in EG, followed by a steady state of the process and, finally, a downward in the process, i.e., FD promotes the corrosion of EG. In the literature, authors also find an absence of the impact on economic growth of financial depth (See Greenwood and jovanovic, 1990; Lee, 1996; Acemoglu and Zilibotti, 1997; Deida and Fattouh, 2002; Rioja and Valev, 2004; and Kim and Lin, 2011).
Stablishing the threshold where FD-EG becomes negative when go beyond a percentage of GDP is a common practice in the literature. The Domestic Credit provided by Banking Sector (DCBS) to output critical value is around 90% (Cecchetti and Kharroubi, 2012; and Law and Singh, 2014) and for the ratio of private credit to GDP this limit is 110% (Aracand et al., 2012). The size of countries is also an important factor to stimulate EG. Countries with lower income levels, get EG through capital accumulation, are more qualified to generate growth through FD than those which generate EG from increasing productivity, i.e. with higher levels of income (e.g. De Gregorio and Guidotti, 1995; Deidda and Fattouh, 2002 and Rioja and Valev, 2004).
Using cross-country approach, the literature highlights the importance of FD to EG. Guiso et al. (2004) points that the development of financial markets through financial integration is important to archive growth. Rioja and Valev (2004) identified different levels of relationship between EG and FD inside of the same country. Deidda and Fattouh (2002) find a significant impact of finance on growth to high income countries and insignificant to low income.
More recently, literature has been focusing this issue of a nonlinear relationship between FD-EG nexus. Arcand, (2012) and Samargandi et al. (2015) have similar results, as FD promotes EG but only to a certain point. Moreover, FD has a positive impact on growth at long run but negative on short-run (Loayza and Ranciére, 2006). This trend means that at a certain point we start having excess of financial growth, eroding EG and politicians need to introduce measures to reverse this process. The impact on economic growth of financial depth appears to fade away over time. Samples with longer time spawn, feature higher significance of the FD on EG while in recent samples are less significant (Rousseau and Wachtel, 2011). The
3 – Data description:
For the analysis of FD-EG nexus in developed countries, was used annual frequency data from 1996 to 2011 for a group of European countries that shares strong financial integration, namely Belgium, Bulgaria, Cyprus, Czech Republic, Germany, Denmark, Estonia, Finland, France, United Kingdom, Greece, Croatia, Hungary, Ireland, Italy, Lithuania, Latvia, Malta, Netherlands, Poland, Portugal, Romania, Slovenia, Spain and Sweden. The chosen period and countries, results from the data restrictions and the tradeoff between more years and less countries or the reverse. This choice results in the exclusion of Austria, Slovakia and Luxembourg of the analysis.
In the literature, there is a lack of consensus in which variables should be used to measure FD and EG mainly due to the body of studied fields, the time periods or, the group of countries analyzed (e.g. Ang and McKibbin, 2007; Jalil and Feridun, 2011; Kim and Lin, 2011; Singh and Huang, 2011; Rewilak, 2013; Samargandi et al, 2015). The study begun with the commonly used variables in the FD literature and the electrification as a proxy of economic development.
To check the FD-EG nexus in Europe was used as dependent variable the Gross Domestic Product per capita at constant 2005 US$ (GDPPC). Additional independent variables were introduced, namely Domestic Credit Provided by Banking Sector (DCBS), Domestic Credit Provided by Private Sector (DCPS), Commercial Balance (TRADE), General Government Final Consumption Expenditure (GOV), Electrification (E) and Consumer price Index (CPIINF). The first two independent variables, as explained later, are aggregated to measure FD, TRADE and GOV are used to determine fiscal policy impact, CPIINF controls price distortion and a new variable electrification as a proxy of country general economic sophistication, i.e. emulates the absent variables. The variables GDPPC, FD2SQ, TRADE and GOV were extracted at the World Development Indicators (WDI). The CPIINF was imported from AMECO and Electrification from Energy Information Administration (EIA). Moreover, variables were expressed in absolute values and not as a percentage of GDP. Table 1 summarizes the respective descriptive statistics and the cross-section dependence of the variables. For the variables the prefix “L” denotes natural logarithms and suffix “PC” per capita.
Table 1
Variables description and descriptive statistics
Descriptive Statistics Cross section dependence (CSD) Variable Obs Mean SD Min Max CD-test Corr Abs(corr) LGDPPC 400 9.7401 0.7785 7.7638 10.8396 63.94*** 0.923 0.923 FD2SQ 397 4.4982 5.415 0.0202 35.1393 50.14*** 0.73 0.83 LTRADEPC 399 9.6539 0.8143 7.4683 11.3314 60.28*** 0.872 0.872 LGOVPC 399 8.1070 0.9159 5.2212 9.5223 58.58*** 0.848 0.848 CPINF 400 4.9565 14.295 -4.5897 244.96 22.66*** 0.327 0.37 LEPC 400 -12.23 0.4755 -13.204 -11.0089 41.90*** 0.605 0.684 Note: CSD test has N(0,1) distribution, hunder the H0: cross-section independence. ***, denotes the level of significance of 1%;
Building a variable to measure FD requires some cautions. Financial services are provided by several institutions and likewise to capture fully the financial sector is far from obvious. The literature suggests at least three ways to measure FD, all of them measured as ratios, due to minor the likely high multicollinearity between variables: (i) Ratio of M2 or M3 to GDP: the monetary aggregate captures the net liabilities of financial system. This measure of FD has the inconvenience of ignoring the transaction power of channeling funds from the financial sector deposits to investors (Ang and McKibbin, 2007); (ii) Ratio of private sector credit to GDP: corresponds to the sum of DCBS with DCPS to GDP. This ratio captures the credit extended to the private sector, allowing the use of funds on more productive activities (Samargandi et al., 2015). This ratio may also capture the differences between credit conceded to state firms or government, and private firms to stimulate growth (King and Levine 1993); (iii) Ratio of commercial bank assets to the sum of the same assets with central bank assets: this variable captures the dimension of the commercial banks in the financial system. This variable is used when is presumed that the commercial banks are more efficient in channeling funds to more profitable investments than central banks (Ang and McKibbin, 2007); and (iv) Principal Components analysis: This multivariate data analysis method extracts indexes and aggregates them into a new variable. The proposal of this method is retaining significant data variation without correlation problems (Çoban and Topcu, 2013). To measure the FD, the former ratio (ii) was used. The following reasons justify the exclusion of the other ratios. The ratio (i) produces non-significant estimations, most likely as they only reflect the ability of transaction services delivered by the financial system (Samargandi et al., 2015). The Ratio (iii) and (iv) restricts the time period and with the concern of having a strongly
that the effect of the financial system vanishes with time (e.g. Arcand et al., 2012; Law and Singh, 2014). The econometric analysis was performed using Stata 13.1 software.
4 – Methodology and preliminary tests:
It is well known that European countries share several common features. Therefore, panel data techniques are appropriate to control of individual heterogeneity and unobserved characteristics of errors but requires attention to these phenomena. Following similar methodology pursued for Marques and Fuinhas (2012), diagnostic tests were applied to assess the presence of phenomena of colinearity, multicolinearity, autocorrelation, cross-sectional dependence (CSD) and heteroskedasticity. Regarding the colinearity assessment, both the correlation matrix and the Variance Inflation Factor (VIF) are provided at Table 2. The presence of colinearity was assessed both from the correlation matrix and the individual and mean VIF.
Table 2
Correlation matrix and VIF statistics
LGDPPC FD2SQ LTRADEPC LGOVPC CPIINF LEPC LGDPPC 1.0000 FD2SQ 0.4843 1.0000 LTRADEPC 0.8828 0.4631 1.0000 LGOVPC 0.9743 0.4687 0.8805 1.0000 CPIINF -0.3516 -0.1476 -0.3304 -0.3758 1.0000 LEPC 0.7610 0.1916 0.7110 0.7828 -0.2062 1.0000 VIF 1.47 4.58 6.67 1.20 3.01 Mean VIF 3.39
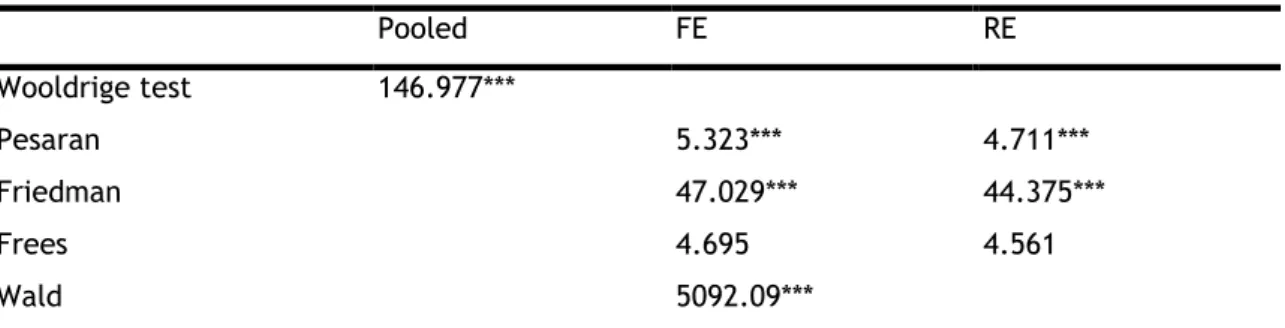
The Wooldrige test confirms the presence of autocorrelation of first order. The CSD was assessed through Pesaran, Friedman, and Frees test. These tests were applied instead of Breusch-Pagan LM test due to the characteristics of the sample, more crosses than time (Hoyos and Sarafidis 2006). The results are inconclusive both to FE model and to RE model. Pesaran and Friedman tests indicates the presence of CSD on contrary to the Frees’ test qoutcome. The Hausman test was used to verify the presence of significate differences between the estimators. The FE model carried out as the most appropriate for the estimation. At last, the modified Wald test revealed the presence of heteroskedasticity. Table 3 summarizes the results of the tests.
Table 3 Diagnostic tests Pooled FE RE Wooldrige test 146.977*** Pesaran 5.323*** 4.711*** Friedman 47.029*** 44.375*** Frees 4.695 4.561 Wald 5092.09***
Note: ***, represents the level of significance of 1%; the command xtcsd with options Pesaran abs, Friedman abs, and Frees abs was used to test CSD
Given that the detection of CSD (Table 1), the appliance of first generation unit root tests is unnecessary. Indeed, to apprise the order of integration of variables, the second-generation unit root test of the CIPS (Pesaran, 2007) was carried out. This test is robust to heterogeneity under a nonstandard distribution. From the CIPS test, the variables are integrated series of order zero I(0). Table 4 shown the results of unit root tests.
Table 4 Unit Root test
Variables LGDPPC FD2SQ LTRADEPC LGOVPC CPIINF LEPC CIPS (Zt-bar) -3.077*** -1.772** -1.700** -2.257** -4.729*** -1.394* Note: ***, **, * denotes significance at 1%, 5% and 10%, respectively; Pesaran (2007) Panel Unit Root test (CIPS): series are I(0); lag(1) and no trend specifications were used
In econometrics, panel data entries add value to the studies. With this provision, a database contains more information than others with a simple crosses. Nevertheless, when variables are introduced in this format some standard errors are introduced. Indeed, in order to be fixed, the results obtained in the diagnosis tests should be analyzed, interpreted and implement the best solution. In the literature, several estimators can be found in order to deal with standard errors and maintain the robustness. However, to bypass the errors that are not consistent with the modes usage requirements, pre-established assumptions are made. These assumptions may lead to erroneous results or diverted from reality.
The traditional panel data estimators – e.g., Fixed Effects (FE) model, Random Effects (RE) model and Ordinary Least Squares (OLS) – are used by the consistency presented, but they are ineffective to deal with some problems. Following this path, investigators have introduced changes in the covariance matrices to create new models that are able to solve this issue. The panel data entries face a sensitive concernment related with the CSD. The main estimators found in the literature are not adapted to deal with this problem. The origin of this problem is related with the common shocks, spatial dependence and unobservable
capable of dealing with CSD was Feasible Generalized Least Squares (FGLS). However, authors avoid the usage of this method. This occurs because the spawn of time needs to be equal or greater than the number of crosses (Reed and Ye, 2011). The Panel-Corrected Standard Errors (PCSE) allows to solve the previous restriction. This estimator admits that the error term is correlated across countries, autoregressive and heteroscedastic (Marques and Fuinhas, 2012). In our study, the spawn of time is lower than the number of crosses. The Driscoll and Kraay (DK) estimator transforms the covariance matrix of temporal series. Indeed, this transformation consents robust results regarding the CSD and temporal dependence. Another positive factor of this method is the absence of restrictions on the number of crosses and spawn of time.
To asset the nonlinearity, the Generalized Method of Moments (GMM) of Newey e West (1987) is commonly used. This estimator works quite well on micro panels and recently authors apply it to macro panels (Arcand et al., 2012). The GMM deals with heteroskedasticity, lags and autocorrelation. However, the usage of GMM estimator is conditioned to large samples, otherwise the achieved results may be spurious or biased (Roodman, 2006). Table 5 synthetizes the referred estimators.
Table 5
Stata commands and options
Command Option Robust for Notes
reg, xtreg vce(robust) Heteroskedasticity
reg, xtreg cluster( ) Heteroskedasticity and autocorrelation Xtregar First order autocorrelation
Newey Heteroskedasticity and autocorrelation from type MA(q)*
Xtgls panels( ), corr( ) Heteroskedasticity, cross-section and AR(1) N < T Xtpcse correlation ( ) Heteroskedasticity, cross-section and AR(1) N > T Xtscc Heteroskedasticity, autocorrelation from type MA(q)* and cross-section Note: *Autocorrelation with mobile media and lag q., Source: Hoechle (2007); N stands for the number of crosses while T stands for the number of years.
As was mentioned before, the variables reveal the existence of cross-sectional dependence, heteroskedasticity and first order auto-correlation. The Hausman test with the null hypothesis RE model as best option, was used to choose between RE and FE model. This test points for the FE model as the most suitable. Moreover, as the statistically highly
estimator, presents a limited compatibility with the FE model. Therefore, attempting to the results of diagnostic tests (Table 3) appoints Driscoll and Kray (1998) as the most suitable estimator. Moreover, this estimator has the advantage of no restrictions on the size of crosses and time dimensions.
The follow model specification was used:
, 15 14 13 12 2 11 1 1it it LEPC i it CPIINF i it LGOVPC i it LTRADEPC i it SQ FD i i it LGDPPC (1)
where
idenotes the intercept and
it the error term.After the model estimation, the U-test was applied to check the robustness of the results. This test has the advantage of detecting the form of the relationships between variables, i.e. in U or inverted U-shape through an explanatory variable and a quadratic term.
5 – Results and discussion:
The DK, FE and the FE Robust only correct parameters standard errors. Therefore, equal coefficients are expected. Table 6 synthesizes the main estimators used. We use RE model as a benchmark.
Table 6
Results from the estimators
Dependent variable LGDPPC
Models DK FE FE robust RE
(I) (II) (III) (IV)
Constant 8.24706*** 8.24706*** 8.24706*** 7.60679*** FD2SQ -0.00424*** -0.00424*** -0.00424*** -0.00451*** LTRADEPC 0.36422*** 0.36422*** 0.36422*** 0.35365*** LGOVPC 0.28160*** 0.28160*** 0.28160*** 0.32689*** CPIINF -0.00050** -0.00050** -0.00050 -0.00039** LEPC 0.35043*** 0.35043*** 0.35043*** 0.31963*** Statistics N 396 396 396 396 R^2 0.9159 0.9159 0.9159 0.9152 F 5711.02 797.17 130.27
Note: ***, **, * denotes significance at 1, 5 and 10%, respectively; On Stata the DK estimation was carried out with the command xtscc with options FE and lag (1)
The results for FD-EG nexus of our model, for Europe, have the same nature as Samargandi et al. (2015) for middle income countries and Arcand et al. (2012) for lower income countries. Therefore, it seems to be that the nexus results are common on the world. As revealed in Table 6, FD2SQ has a negative and statistically significant coefficient for all estimations. This could result from: (i) The threshold proposed by Arcand et al. (2012) of 110% was overpassed in the ratio of private credit to GDP or 90% in DCBS to GDP; (ii) Existing countries exclusively classified of upper middle income or high-income. As enunciated before, high developed countries have been revealed a slower pass-through from FD to EG.
The Inflation can exert a positive or negative impact on growth. Moreover, the effect can be positive, resulting from the excess of demand and provoking a persistent rise of prices and potentially stimulates the production, or negative due to the fact of measuring economic
positive effect on EG. Indeed this variable embody the effect of both energy, as a resource and as an economic sophistication/development. Indeed, in general a sophisticated economy is more electrified. Commercial balance (TRADE) contributes positively for the GDP. As expected, when countries open this induces EG. The GOV variable has a positive coefficient too. This former result is the expected because when a government use fiscal policy it provoke EG (Devarajan et al., 1996).
As mentioned before, a quadratic condition was imposed to FD. The exclusive introduction of FD2SQ instead of both variables is related with the multicolinearity between them. The estimations solely with FD, produce significant and positive coefficients, while with the quadratic term the coefficients are significant and negative. This reinforces the nonlinear relationship between FD and EG. The U-test was carried out to confirm the existence of an inverted U–shape. Table 7 show the results.
Table 7 U–Test
Statistics
Lower bound slope 0.41540***
Upper bound slope -0.24781***
Global test for inverted U-shape 8.45*** Note: *** denotes significance at 1%; H0: Monotone or U-shape; H1: Inverse U-shape; command utest with option quadratic was used
The null hypothesis of monotone or U-shape was rejected by the U-test, confirming an inverted U-shape between FD and EG. This result means that the use of polynomial shape on FD was relevant. The results found for Europe are consistent with other group of countries, namely lower income and middle income countries, i.e. excess of FD can hamper EG (e.g. Rousseau and Wachtel, 2011; Law and Singh, 2014; Samargandi et al., 2015). Data panel with the Driscoll and Kraay model and U–test confirm the nonlinear relationship between FD and EG. The origin of this phenomenon could be related with financial liberalization from latter 90’s. In fact, liberalizing this sector might provoke instability by restricting markup, raising information asymmetries and competition. Indeed, economies are more exposed and prone to financial crashes resulting in negative contributions of FD to EG (Bumann et al., 2013). Financial liberalization encourages another impact. Due to this process of liberalization, markets are pressured to reduce interest rates, encouraging an increase of non-productive consumption and lower levels of investments. An economy focused on present consumption promotes a lower impact of FD in EG. The electrification revealed to be a driver of EG. The analysis of this nexus suggests the necessity of comprehensive models. Indeed, variables such as TRADE, GOV, inflation and electrification need to be considered.
6 – Conclusion
This essay contributes to the literature by analyzing the nonlinearity between FD and EG in Europe. The measure of FD consubstantiated in the ratio of private sector credit to GDP revealed to be an effective driver of EG.
The estimator of Driscoll and Kraay with FE was used to 25 European countries for the period from 1996 to 2011. A negative coefficient was found for FD and inflation. Moreover, commercial balance, general government final consumption expenditure, and electric consumption have a positive effect on EG. Addressing the U–test, we confirm the presence of an inverted U-shaped between FD and EG, i.e. at long run, finance harms growth so it is necessary to inverse the tendency. In fact, policies aimed to growth of the financial system are ineffective and imprudent. Policymakers must found an optimal dimension to FD and avoid overpassing it. Likewise, liberalization policies to provide bank competition and cut the excess of power on financial sector are recommended to avoid a negative effect of FD on EG. Instead of being worried with the growth of the financial sector, policymakers should be worried with his development.
The research in this area will benefit from the extension of the analysis to other blocks of countries, and different time spawns. Instead of financial proxies the Principal Component Analysis could be used on future studies. Furthermore, the role of electrification in the context of FD and EG need to be more scrutinized.
References
Acemoglu and Zilibotti (1997): D. Acemoglu, F. Zilibotti “Was prometheus unbound by chance? Risk, diversification, and growth” Journal of Political Economy 105, (1997), pp. 709–751.
Alfaro et al. (2004): L. Alfaro, A. Chanda, K. O. Sebnem “FDI and economic growth: the role of local financial markets” Journal of International Economics, 64(1) (2004), pp. 89-112.
Al-mulali and Sab (2012): U. Al-mulali, C. N. C. Sab “The impact of energy consumption and CO2 emission on the economic growth and financial development in the Sub Saharan African countries” Energy 39 (2012b), pp. 180-186.
Ang (2007): J. B. Ang “CO2 emissions, energy consumption, and output in France” Energy Policy, 35(10), (2007), pp. 4772–4778.
Ang and McKibbin (2007): J. B. Ang, W. J. McKibbin “Financial liberalization, financial sector development and growth: Evidence from Malaysia” Journal of Development Economics, 84 (1) (2007), pp. 215–233.
Arcand et al. (2012): J. Arcand, E. Berkes, U. Panizza “Too much finance?” International Monetary Fund, Research Department (2012).
Arestis and Demetriades (1999): P. Arestis, P.O. Demetriades “Financial liberalization: the experience of developing countries” Eastern Economic Journal, 25, (1999), pp. 441-457.
Arestis et al. (2002): P. Arestis, P.O. Demetriades, B. Fattouh, K. Mouratidis “The impact of financial liberalization policies on financial development: evidence from developing economies” International Journal of Finance and Economics, 7 (2002), pp. 109–121. Beck and Levine (2004): T. Beck, R. Levine “Stock markets, banks, and growth: panel
evidence” Journal of Banking and Finance, 28 (2004), pp. 423–442.
Bencivenga and Smith (1991): V. R. Bencivenga, B. D. Smith “Financial intermediation and endogenous growth” Review of Economic Studies, 58, (1991), pp. 195 –209.
Berthelemy and Varoudakis (1996): J. C. Berthelemy, A. Varoudakis “Financial Development, Policy and Economic Growth” (1996) In: N. Hermes, R. Lensink, “Financial Development and Economic Growth: Theory and Experiences from Developing Countries” Routledge, London, pp. 66–89.
Bumann et al. (2013): S. Bumann, N. Hermes, R. Lensink “Financial liberalization and economic growth: A meta-analysis” Journal of International Money and Finance, 33 (2013), pp. 255–281.
Capasso (2008): S. Capasso “Endogenous Information Frictions, Stock Market Development and Economic Growth” The Manchester School, 76 (2) (2008), pp. 204–222.
Carreira and Silva (2010): C. Carreira, F. Silva “No deep pockets: Some stylized empirical results on firms’ Financial constraints” Journal of Economic Surveys, 24 (4), (2010), pp. 731–753.
Ceccheti and Kharroubi (2012): G. Ceccheti, E. Kharroubi “Reassessing the impact of finance on growth” BIS working paper, 381, (2012).
Çoban and Topcu (2013): S. Çoban, M. Topcu “The nexus between financial development and energy consumption in the EU; a dynamic panel data analysis” Energy Econ, 39, (2013), pp. 81-88.
De-Gregorio and Guidotti (1995): J. De-Gregorio, P. Guidotti “Financial development and economic growth” World Development, 23 (3), (1995), pp. 433–448.
Deidda and Fattouh (2002): L. Deidda, B. Fattouh “Non-Linearity between finance and growth” Economics Letters, 74(3), (2002), pp. 339–345.
Demetriades and Hussein (1996): P. Demetriades, K. Hussien “Does financial development cause economic growth?” Journal of Development Economics 51 (2), (1996), pp. 385– 409.
Devarajan et al. (1996): S. Devarajan, V. Swaroop, H. –F. Zou “The composition of public expenditure and economic growth” Journal of Monetary Economics, 37 (2), (1996), pp. 313–344.
Driscoll and Kraay (1998): J. Driscoll, A. C. Kraay “Consistent covariance matrix estimation with spatially dependent data” Review of Economics and Statistics 80, (1998), pp. 549–560.
Fallahi (2011): F. Fallahi “Causal relationship between energy consumption (EC) and GDP; a markov-switching (MS) causality” Energy 36 (2011), pp. 4156–70.
Frees (1995): E. W. Frees “Assessing cross-sectional correlation in panel data” Journal of Econometrics, 69, (1995), pp. 393–414.
Friedman (1937): M. Friedman “The use of ranks to avoid the assumption of normality implicit in the analysis of variance” Journal of the American Statistical Association 32, (1937), pp. 675–701.
Gamra (2009): S. B. Gamra “Does financial liberalization matter for emerging East Asian economies growth? Some new evidence” International Review of Economics & Finance, 18 (3) (2009), pp. 392–403.
Goldsmith (1969): R.W. Goldsmith “Financial structure and development” Yale University Press, New Haven, CT (1969).
Greenwood and Jovanovic (1990): J. Greenwood, B. Jovanovic “Financial development, growth, and the distribution of income” Journal of Political Economy 98, (1990), pp.
Halicioglu (2009): F. Halicioglu “An econometric study of CO2 emissions, energy consumption, income and foreign trade in Turkey” Energy Policy, 37 (3), (2009), pp. 1156–1164.
Hellmann et al. (2000): T. Hellmann, K. Murdock, J. E. Stiglitz “Liberalization, moral hazard in banking and prudential regulation: are capital requirements enough?” American Economic Review, 90 (1), (2000), pp. 147–165.
Hoechle (2007): D. Hoechle “Robust standard errors for panel regressions with cross-sectional dependence” The Stata Journal, 7(3), (2007), pp. 281–312.
Hondroyiannis et al. (2005): G. Hondroyiannis, S. Lolos, E. Papapetrou “Financial markets and economic growth in Greece, 1986–1999” Journal of International Financial Markets, Institutions and Money, 15(2) (2005), pp. 173–188.
Hoyos and Sarafidis (2006): R. E. De Hoyos, V. Sarafidis “Testing for cross-sectional dependence in panel-data models” The Stata Journal, 6(4), (2006), pp. 482–496. Jalil and Feridun (2011): A. Jalil, M Feridun “The impact of growth, energy and financial
development on the environment in China: A cointegration analysis” Energy Economics, 33 (2011), pp. 284–291.
Kim and Lin (2011): D. -H. Kim, S. -C. Lin “Nonlinearity in the financial development–income inequality nexus” Journal of Comparative Economics, 39 (2011) 310–325.
King and Levine (1993a): R.G. King, R. Levine “Finance and growth: Schumpeter might be right?” Quarterly Journal of Economics, 108 (3) (1993), pp. 717–737.
King and Levine (1993b): R.G. King, R. Levine “Finance, entrepreneurship, and growth: theory and evidence” Journal of Monetary Economics, 32 (3) (1993), pp. 513–542. Komal and Abbas (2015): R. Komal, F. Abbas “Linking financial development, economic
growth and energy consumption in Pakistan” Renewable and sustainable energy review, 44, (2015), pp. 211-220.
Law and Singh (2014): S. H. Law, N. Singh “Does too much finance harm economic growth?” Journal of Banking and finance, 41, (2014), pp. 36–44.
Lee (1996): J. Lee “Financial development by learning” Journal of Development Economics 50, (1996), pp. 147–164.
Levine (1997): R. Levine “Financial development and economic growth: Views and agenda” Journal of Economic Literature, XXXV (1997), pp. 688–726.
Lind and Mehlum (2010): J. T. Lind, H. Mehlum “With or without U? The appropriate test for U-shaped relationship” Oxford Bulletin of Economics and statistics, 72(1), (2010), pp. 109–118.
Loayza and Rancière (2006): N. V. Loayza, R. Rancière “Financial development, financial fragility, and growth” Journal of Money, Credit and Banking, 38(4), (2006), pp. 1051–1076.
Mckinnon (1973): R.I. Mckinnon “Money and Capital in Economic Development.” Brookings. Institution, Washington, DC. (1973).
Marques and Fuinhas (2012): A. C. Marques, J. A. Fuinhas “Are public policies towards renewables successfull? Evidence from European countries” Renewable Energy, 44, (2012), pp. 109–118.
Marques et al. (2013): L. M. Marques, J. A. Fuinhas, A. C. Marques “Does the stock market cause economic growth? Portuguese evidence of economic regime change” Economic Modelling, 32 (2013), pp. 316–324.
Masten et al. (2008): A. B. Masten, F. Coricelli, I. Masten, “Non-linear growth effects of financial development: Does financial integration matter?” Journal of International Money and Finance, 27 (2008) pp. 295–313.
Misati and Nyamongo (2012): R. N. Misati, E. M. Nyamongo “Financial liberalization, financial fragility and economic growth in Sub-Saharan Africa” Journal of Financial Stability, 8(3) (2012), pp. 150–160.
Newey and West (1987): W. K. Newey, K. D. West “A simple, positive semi-definite, heteroskedasticity and autocorrelation consistent covariance matrix” Econometrica, 55, (1987), pp. 703–708.
Nieuwerburgh et al (2006): S. V. Nieuwerburgh, F. Buelens, L. Cuyvers “Stock market development and economic growth in Belgium. Explorations in Economic History” 43, (2006), pp. 13–38.
Obstfeld (1994): M. Obstfeld “Risk taking, global diversification, and growth” American Economic Review, (1994), pp.1310–1329.
Odedokun (1996): M. O. Odedokun “Alternative econometric approaches for analyzing the role of the financial sector in economic growth: Time-series evidence from LDCs” Journal of Development Economics, 50 (1996), pp. 119–146.
Oliveira and Fortunato (2006): B. Oliveira, A. Fortunato “Firm growth and liquidity constraints: a dynamic analysis” Small Business Economics, 27(2), (2006), pp.139– 156.
Pagano (1993): M. Pagano “Financial markets and growth: an overview” European Economic Review, 37 (1993), pp. 613–622.
Pesaran (2004): M. H. Pesaran “General diagnostic tests for cross section dependence in panels” University of Cambridge, Faculty of Economics, Cambridge Working Papers in Economics, (2004), No. 0435.
Reed and Ye (2011): W. R. Reed, H. Ye “Which panel data estimator should I use?” Applied Economics, 43, (2011), pp. 985–1000.
Rewilak (2013): J. Rewilak “Finance is good for the poor but it depends where you live” Journal of Banking & Finance, 37 (2013), pp. 1451–1459.
Roodman (2006): D. Roodman “How to do xtabond2: An introduction to difference and sstem GMM in stata” Center for global development, Working Paper, (103)
Rousseau and Wachtel (2011): P. L. Rousseau, P. Wachtel “What is happening to the impact of financial deepening on economic growth?” Economic Inquiry, 49(1), (2011), pp. 276–288.
Sadorsky (2010): P. Sadorsky “The impact of financial development on energy consumption in emerging economies” Energy Policy, 38(5), (2010), pp. 2528-2535.
Samargandi et al. (2015): N. Samargandi, J. Fidrmuc, S. Ghosh “Is the Relationship between Financial Development and Economic Growth Monotonic? Evidence from a Sample of Middle-Income Countries” World development, 68, (2015), pp. 66–81.
Schumpeter (1912): J. Schumpeter “The Theory of Economic Development” Cambridge, MA, US: Harvard University Press; (1932).
Shaw (1973): E. S. Shaw, “Financial deepening in economic development.” New York: Oxford University Press. (1973).
Singh and Huang (2011): R. J. Singh, Y. Huang “Financial Deepening, Property Rights and Poverty: Evidence from Sub-Saharan Africa” International Monetary Fund, (2011). Stiglitz (2000): J.E. Stiglitz “Capital market liberalization, economic growth, and instability”
World Development, 28 (2000), pp. 1075–1086.
Warr and Ayres (2010): B.S. Warr, R. U. Ayres “Evidence of causality between the quantity and quality of energy consumption and economic growth” Energy, 35 (2010), pp. 1688–93.
Xu (2000): Z. Xu “Financial development, investment, and economic growth” Economic Inquiry, 38(2), (2000), pp. 331–344.