i
ASSESSING THE PATTERN BETWEEN CUSTOMER
METRICS AND NET PROMOTER SCORE
Diogo Alexandre da Silva Santos
A Portuguese Insurance Sector Case Study
Dissertation presented as partial requirement for obtaining
the Master’s degree in Statistics and Information
i
Title: Assessing the pattern between customer metrics and NPS
Subtitle: A Portuguese insurance sector case study
Student M2016108
full name Diogo Alexandre Silva Santos
MEGI
201
ii
NOVA Information Management School
Instituto Superior de Estatística e Gestão de Informação
Universidade Nova de LisboaASSESSING THE PATTERN BETWEEN CUSTOMER METRICS AND NET
PROMOTER SCORE
by
Diogo Alexandre da Silva Santos
Dissertation presented as partial requirement for obtaining the Master’s degree in Information Management, with a specialization in Marketing Research and CRM
Advisor: Professor Doutor Manuel Vilares
iii
ABSTRACT
Marketing and business strategy have been globally target of several transformations and improvements during the last century, from a business perspective product-centric, where the demand was bigger than the offer, to a customer-centric perspective, where offer is bigger than the demand. The client is now the focus of the company, the element generating revenues and spreading the word or repurchasing when satisfied, consequently enhancing companies business sustainability and growth.
This research intends to contribute to understand the relation between several customer metrics and net promoter score in the insurance sector in Portugal. To achieve this objective, it will estimated a Structural Equation Model using a data set with information collected by Nova Information Management School in scope of the project ECSI covering the latent variables (1) Image (2) Expectations (3) Perceived Quality (4) Perceived Value (5) Trust (6) Satisfaction (7) Loyalty and as target latent variable Net Promoter Score based on the willingness to recommend the organization. It is expected to find results suggesting a positive association between the customer metrics and NPS and therefore by the end of the study we hope to be able to contribute for a growth on customer satisfaction model’s evaluation as well as for implementing policies or strategies to increase the insurance sector overall performance.
KEYWORDS
Net Promoter Score, Loyalty, Customer Satisfaction, Word of Mouth, Insurance, Structural Equation Model
iv
INDEX
1.
Introduction ... 1
2.
Literature review ... 3
2.1.
Background and Hypothesis Identification ... 3
2.1.1.
Image, Expectations, Perceived Quality and Perceived Value ... 4
2.1.2.
Trust and Net Promoter Score ... 5
2.1.3.
Customer Satisfaction and Customer Loyalty ... 6
2.1.4.
Customer Satisfaction and Net Promoter Score ... 6
2.1.5.
Loyalty and Net Promoter Score ... 7
2.2.
Study Relevance ... 7
3.
Methodology ... 9
3.1.
Survey Methodology ... 9
3.1.1.
Target Population ... 9
3.1.2.
Sample Plan ... 9
3.1.3.
Data Collection ... 10
3.1.4.
Questionnaire Structure ... 10
3.2.
Specification and Structure of the Model ... 10
3.2.1.
Structural Equation Model ... 10
3.2.2.
Model Estimation ... 13
3.2.3.
Model Evaluation ... 15
4.
Results and discussion ... 17
4.1.
Measurement Model ... 17
4.2.
Structural Model ... 20
4.3.
Results ... 22
5.
Conclusions ... 24
6.
Limitations and recommendations for future works ... 26
7.
Bibliography ... 27
v
LIST OF FIGURES
Figure 1 - Business Cycle for Net Promoter Score ... 4
Figure 2 – Proposed Model: Customer metrics and Net Promoter Score ... 11
Figure 3 - Data Matrix for a PLS-SEM Example ... 13
Figure 4 - Structural model results ... 20
Figure 5 - Average results per company ... 22
Figure 6 - Distribution of Detractors, Passives and Promotors per company ... 23
vi
LIST OF TABLES
Table 1 - Quality criteria and factor loadings ... 18
Table 2 - Fornell-Lacker Criterion: Matrix of correlation constructs and the square root of AVE
(in bold). ... 19
Table 3 - Cross-loadings criterion ... 19
Table 4 - Multicollinearity – Variance Inflation Factor ... 20
Table 5 – Estimations of total effects on the latent variables index... 21
vii
LIST OF ABBREVIATIONS AND ACRONYMS
NOVA IMS NOVA Information Management School
ECSI European Customer Satisfaction Index
ASF Autoridade de Supervisão e Fundos de Pensões NPS Net Promoter Score
SEM Structural Equation Model PLS Partial Least Squares
1
1. INTRODUCTION
In a market disputed by several players, with plenty of substitute products and not many differences in price politics, a customer-oriented business strategy arise as the solution to create profit sustainability and competitive advantage in a long run (Kumar & Petersen, 2005). This reality is increasingly affecting the business environment, particularly, companies that do business to consumers (B2C), which is the case of organizations in banking or insurance sector.
The business environment is also being challenged by the connected community of clients, mostly due to internet revolution and social networks, where the opinion about a certain product/service or the global image of a company is being spread all over (Kumar et al., 2013). It has become commonplace that every time a customer wants to satisfy a need he will get more information about where to do it and about previous experiences of other customers, to assess whether they got or not satisfied. Depending on the information received, organizations can either acquire a new customer or lose one (Chevalier & Mayzlin, 2006). ↑
This is called Net Promoter Score (NPS), a business measure to evaluate customers and classifying them in distinct categories based on their probability of recommendation. One of the categories are Detractors, which are clients not satisfied and capable of reflect a bad opinion about the organization, another one are Passives, clients which are satisfied clients but not totally loyal to the firm since they can easily switch to a competitor and last, the Promoters, which are loyal and satisfied customers capable of sharing positive word of mouth and customer experience. NPS provides important guidelines to understand how organization’s services are being perceived in the client’s community. It is also used as a measure of loyalty, since recommendation and loyalty are linked, and as one of the important factors to evaluate future financial revenues and growth (Frederick F. Reichheld, 2003). Organizations capable of delighting a customer tend to gain a larger market share. Rawson, Duncan, and Jones (2013) reveal relevant results about it, indicating that insurance firms with a flexible process in the customer journey are most profitable since their clients are more satisfied. This is call customer experience and it can be considered a reflex of all the customer metrics under investigation with direct impact on word of mouth (Sirapracha & Tocquer, 2012).
In this research, we are going to analyze distinct customer metrics in the insurance sector and the influence they may have on the net promoter score of each of the insurance companies considered. For that, we will test relations with variables such as image, that represents all the kind of associations the clients have in mind for a specific organization; expectations, representing the past information on products/services that the customer had about the firm and the expected capability the firm has to offer product/services with quality in the future; perceived quality that is the evaluation of excellence in the product compared to other competitors; perceived value that encompasses a ratio between the price and the quality of the product/service; satisfaction as a comparison between product’s perceived performance and previous expectations; trust as the confidence that the clients have on the company and their services; loyalty as the intention to remain as a customer and finally; net promoter score that represents the willingness to recommend the company to others. (ECSI Portugal, 2017a)
We will be using data collected by Nova Information Management School in the context of the project European Customer Satisfaction Index (ECSI) Portugal – Índice Nacional de Satisfação do Cliente. ECSI measures the quality of goods and services provided in Portugal, evaluating several industries such as
2 Water, Banking, Gas, and Electricity, among others. The final goal is to integrate customer loyalty as main concern of the organizations, providing a panel of information to the companies involved, serving as the voice of the customer and building a national platform that allows comparison across countries and activities (ECSI Portugal, 2016a).
To test the research hypothesis, a Structural Equation Model will be put in place since it is described in the literature as the most appropriate choice for problems that include variables that cannot be directly measured.
With the results obtained in the investigation, we expect to prove the existence of a pattern between customer metrics and net promoter score as a driver for business growth. We also expect to generate more reliable and accurate decisions for players in the insurance sector composed by 75 companies, according to Autoridade de Supervisão e Fundos de Pensões (ASF).
Regarding the structure of this paper, the content will be organized in the following way:
• Literature review that presents the problem theoretical background pointing to past research done on customer metrics and how can they affect direct or indirectly net promoter score. Once perceived and well understood, appropriate hypothesis are presented as well as the study relevance for the community in general.
• Methodology is a step by step description on how the data was collected, in which format and according to which rules, the process of data analysis from the measurement model to the structural model and finally the model validation process.
• Results and discussion which is a section dedicated for comments on the results obtained and on the quality criteria assessment of the model.
• Conclusions provides a validation, based on the results, of the research hypothesis defined on the literature review as well as comments about the contribution of the results and accomplishments achieved for the studies on the field of marketing customer metrics. • Limitations and recommendations for future works is a discussion section including all types of
problems faced during the process and recommending different approaches for future investigations.
The paper is finished with the bibliography containing all the references mentioned and it is followed by the necessary appendices and annexes.
3
2. LITERATURE REVIEW
2.1.
B
ACKGROUND ANDH
YPOTHESISI
DENTIFICATIONWithout customers there is no revenues, no profit and without those, there is no growth or even possibility of business survival.
Past companies have spent their time and resources in a strategy based on the product at a firm level. By trying to make their own products as much exclusive as possible, they were ensuring large volume of sales without investing time understanding whether this product was satisfying the client or not. The fact is that, even in the past, literature was already emphasizing the relevance of a customer in a organization and also the relation between customer satisfaction and firm performance (Day & Fahey, 1988; Hogan et al., 2002). Customer satisfaction along with service quality and loyalty have always been metrics taken into consideration for several researchers in a marketing context, since it is familiar term for the customers and an easy concept to transmit for the managers (S. Gupta & Zeithaml, 2006). A satisfied and valued customer is not only the one who purchases and repeats it several times, but also the one willing to recommend the company’s products or services and convince other individuals to have the initial purchase (Mittal & Kamakura, 2001). Therefore, it seems obvious to consider that if the client has this much weight, he is the most valuable component for the companies and thus, the bigger the capability to work on their trust, satisfaction and loyalty, the bigger the probability for them to share positive experiences with others or to repurchase in the same organization without checking any other. Some authors try to evidence the real importance of considering the clients as a tangible asset to the firm and considering those assets as a relevant peace for determine the overall firm value (Sunil Gupta & Lehmann, 2003).
An organization values as much as their customer portfolio and the better the firm serves its clients the better the clients will pay in return, either on monetary value or by spreading the word (Ittner & Larcker, 1998). Positively or negatively spreading the word, is a storytelling about an experience and has been found to be individually a more powerful metric to predict a firm’s capability to grow than satisfaction and loyalty together.
Net promoter score is a probability measure of a negative or positive recommendation. By recommending the service or product of a certain company, the customer assumes the delivery value commitment and as consequence, assumes the compromise to remain as customer. He is risking his credibility on behalf of the company by sharing and convincing others about that company capability to satisfy a specific need (Frederick F. Reichheld, 2003).
Reichheld (2003), presents interesting data results on promoters and detractors, reporting direct impact on organization business performance through the acquisition of new customers and marketing financial efforts.
As pointed in Figure 1, a business cycle from a firm has several phases, starting by investing on marketing campaigns to initially acquire new customers to feed the business survival and maintenance; satisfy them, by providing the product or service that completely fulfill their needs; later on, ensure those same clients will repurchase becoming loyal customers; and, to complete the cycle, the loyal
4 customers would act like promotors that would bring new clients and that would start once more the cycle with the same process.
Figure 1 - Business Cycle for Net Promoter Score
There is an initial investment to transform customers into loyal customers and promoters, assuming they will continue the chain, and this is the real benefit presented on the business review. On the opposite side, the detractors are customers that the company initially invested, to get them as new customers, but their needs were not fulfilled. The real loss in this case is that, not only the company has invested money to get someone sharing bad experiences, as they will also have to invest it all over again on acquiring new more customers and on cleaning their image and reputation on the market. To confirm the relevance of measuring the recommendation probability to a third party, European Customer Satisfaction Index (ECSI) have always considered this metric for the measurement of customer loyalty (Gronholdt, Martensen, & Kristensen, 2000). The ECSI defines loyalty as the final goal of the model using as observed indicators intention to remain as customer, price sensibility and intention to recommend the company to family and friends and that choice is justified by the relevance that those indicators together can have in a business.
Within this research, we are implementing a different model that, on one hand, assumes the foundation of ECSI model since it is using the same indicators but, on the other hand, different on its final purpose, since it organizes the structural model placing intention to recommend the company to family and friends as the final goal, being explained by the latent variables satisfaction, loyalty and trust. As suggested by Reichfield (2003), “net promoter score is the only number you need to grow”, and the proposed model intends to be based on this approach, providing a different way to take valuable insights from customer metrics by understanding which latent variables are more responsible for explaining the net promoter score. Additionally, previous literature presents several articles where recommending intentions has been seen a precedent variable of loyalty and satisfaction behaviors, however, it lacks literature with exploratory research presenting it as a consequence of those behaviors.
2.1.1. Image, Expectations, Perceived Quality and Perceived Value
It is suggested by ECSI the importance of these four-latent variables that indirectly affects net promoter score though trust, satisfaction and loyalty.
Concerning image, theory presents the idea that a favorable image is viewed as a critical aspect of a company’s ability to maintain its market position. It is proposed that incoming information, as well as
5 customer evaluation of attributes of a service or product, will be judged in relation to an organization’s image (Bloemer, de Ruyter, & Peeters, 1998). The society requires, among other things, that a consumer can make judgments and comparisons between products, brands, and services. Such judgments are conducted by a process, where some or all items of information associated with the product, brand, or service are identified, evaluated, and integrated to form a composite judgment. In several studies, results have revealed a major significance from image rather than even price as well as a considerable influence on the quality perception of an organization (Szybillo & Jacoby, 1974). Moreover, image of the organization can have a key role on positively or negatively influencing the marketing activities. It can influence the customer perceptions of good and services offered. The literature identifies several situations that reflects image on customer's mind, through advertising, public relations, physical image and/or word of mouth (Kandampully & Suhartanto, 2000).
H1 – Image positively affects satisfaction, loyalty and trust
Besides image, customers create expectations prior to their encounter with the organization, they develop perceptions during the service delivery process and subsequently they compare their perceptions to their expectations in evaluating the outcome of the service provided. It is an emotional reaction to the difference between what customers anticipate and what they received, regarding the fulfillment of some needs, goals or desire (Angelova, 2011; Bloemer et al., 1998). To maintain or to add value to a customer's portfolio of an organization, a common strategy from the top managers is to delight the customer or in other words to exceed their expectations. This strategy is based on the positive relation between expectations and perceived quality (Rust, Jeffrey, Jianmin, & Zahorik, 1999).
H2 – Expectations positively affects satisfaction, loyalty and trust
Perceived Quality is described as the first attribute evaluated by the client regarding his recent consumption experience, justifying the direct impact on satisfaction.
H3 – Perceived Quality affects positively satisfaction, loyalty and trust
Perceived value is the second attribute evaluated, being a measure of quality relative to the price paid. (Angelova & Zekiri, 2011). When a customer, after a purchase, perceives that its value was bigger than the paid price, he can consider it a favorable ratio and feel equitably treated (Varki, 2001; Yang & Peterson, 2004).
H4 – Perceived Value affects positively satisfaction, loyalty and trust
2.1.2. Trust and Net Promoter Score
Trust is responsible for reduce the perceived risk from the customer. This is a truth applied to investments or purchases, but with special importance in the beginning of a certain commercial relationship, because, it can make a substantial difference in the time of giving the first step. The digital solutions and e-commerce are taking a large space in the market comparing to the traditional commerce. Insurance firms are providing their solutions to clients mainly using electronic channels which means that the customers are not directly dealing with the firm. Trust is then a vulnerability. The capacity that the firm have to demonstrate confidence and intentions in line with the customers pretensions, being able to generate long-term relationships (Ribbink, van Riel, Liljander, & Streukens, 2004).
6 Customers are also concerned about security, privacy and protection of their information against any improper use (R. E. Anderson & Srinivasan, 2003). According to Singh and Sirdeshmukh (2000) “trust is a crucial variable that determines outcomes at different points in the process and serves as a glue that holds the relationship together.”
Previous research has pointed that trust is a feeling that is created based on a ratio between positive and negative transactions between the client and the organization. When achieved, people tend to recommend products and services to friends and family (Victor, Cock, & Cornelis, 2011).
H5 – Trust positively affects Net Promoter Score
2.1.3. Customer Satisfaction and Customer Loyalty
Several definitions appear in the literature diverging one from another (Szymanski & Henard, 2001). From one perspective transaction-specific based to another more cumulative satisfaction based. The transactional perspective describes satisfaction as an emotional response of the consumer to the most recent transactional experience with an organization. The cumulative satisfaction perspective, describes satisfaction as an overall satisfaction of all the interactions between the customer and the firm (R. E. Anderson & Srinivasan, 2003).
Previous research have proved a positive relation between customer satisfaction and loyalty trough repurchase intention, depending on several customer characteristics like gender, age or number of children, pointing even females with higher ages and few kids as more loyal (Mittal & Kamakura, 2001). Similar studies were also done using ECSI methodology proving that, a dissatisfied customer tend to run away from long relationships and more likely to look for alternatives in order to reduce dependence from a specific company, which evidences once more the importance of satisfaction on customer loyalty. (R. E. Anderson & Srinivasan, 2003).
Monitor the level of satisfaction of the clients is a way of keeping them close to the organization, reason why, the measurement of satisfaction and loyalty and very important in the insurance sector (Joseph, Stone, & Anderson, 2003).
H6 – Satisfaction positively affects Loyalty
2.1.4. Customer Satisfaction and Net Promoter Score
Satisfaction turns people involved in whatever process they are integrated in and when achieving a larger level of satisfaction, it makes them loyal to the organization. Consequently, this will generate a chain of positive reactions affecting directly the firm in terms of growth but also in terms of reputation through word of mouth and recommendations. Therefore, we can assume a relation between customer satisfaction and net promoted score, through the direct impact on customer loyalty and repurchase intention (Chi & Gursoy, 2009).
A satisfied customer has also higher chances to recommend the firm while also increases the bond with the company (Daniel Schneider, Matt Berent, Randall Thomas, & Jon Krosnick, 2008). In other hand, an unsatisfied and not engaged customer can turn into a lack of recommendation or worse, a negative word of mouth (Serenko & Stach, 2009).
7 H7 – Satisfaction positively affects Net Promoter Score
2.1.5. Loyalty and Net Promoter Score
Recommendation behavior is seen in some cases as an asset for the customer, that when shared with other people, pass the idea of satisfaction, happiness, value of the services/products obtained from a specific organization. For example, in an automobile business it can assumes the willingness of share and show the car to other people (F. F. Reichheld & Sasser, 1990).
Loyalty and recommendation behaviors are key factors when linked to customer retention, promotion, and overall financial performance of service providers. While loyalty is measured in the literature trough repurchase intention and/or repurchase behavior, NPS is measured by the intention of recommend. Loyalty is the commitment from a satisfied customer to a brand or firm, when other options for the same service are also available and accessible. This commitment stimulates repurchase behaviors and recommendation willingness and therefore, it stimulates intention to recommend (Serenko & Stach, 2009)
The existence of a causal relationship between loyalty and net promoter score is usually sustained by the literature as simple to understand, since loyal customers report higher retention rates and therefore commit to keep spending their money in the firm as well as keep recommending it to family and friends (Keiningham, Cooil, Aksoy, Andreassen, & Weiner, 2007).
H8 – Loyalty positively affects Net Promoter Score
2.2. S
TUDYR
ELEVANCEThis research adds knowledge to literature investigating the relations between customer metrics and net promoter score in the insurance sector. Previous researches had concluded that the impact of satisfaction in the business performance can easily vary from sector to sector or even from company to another, simply because of the customer perceptions and their idea about what is considered by them as a given factor (Gursoy & Swanger, 2007)
The relation between the constructs under study can also depend on the business model from the firms. A business to business relationship tend to have stronger and longer relationships, while business to consumer relationship tend to have more independent transactions (Williams & Naumann, 2011).
Additionally, Portuguese economy is still under recovery from the financial crisis that has, during the last 6 years, negatively impacted organization’s financial results and, as such, it can also be interesting to verify the existence of this relation in this period. Finally, the financial sector has been targeted of several corruption actions and restructuring solutions, which might have had global effect on the customer confidence in the insurance sector. As such, conduct this investigation, with data from 2015, can be a limitation but it can also be a challenge, since it might confirm all the hypothesis, even in a serious economic and financial crisis.
To conclude, not only because there is a lack of literature in the analysis of this metrics for the insurance sector but also because it is facing a changing market with a lot of new technologies and more demanding customers - which present a big set of challenges for the industry - insurance
8 providers recognize the need of improvements on services quality and customer satisfaction since the customer may readily change provider if not satisfied (Siddiqui & Sharma, 2010).
9
3. METHODOLOGY
3.1. S
URVEYM
ETHODOLOGY3.1.1. Target Population
The data refers to 2015 and it was collected under the Project ECSI Portugal, that have a global objective to serve as an annual index of consumer’s satisfaction and confidence in Portugal.
The target population were individuals living in Portugal territory with at least 18 years old, with current experience in the acquisition of insurance services/products. In case of being client of more than one company, it was considered the company with more frequent relationship.
3.1.2. Sample Plan
The sample selection was done using a random sampling plan extracted from the population living in Portugal. This probabilistic method ensures that, each individual has the same probability of being observed and can only be picked once, but also allows a quantification of the sampling error, a proper size for the sample and, most of all, a reduction of bias coming from the subjectivity of the interviewer.
𝜋𝑖 =
𝑛
𝑁 (𝑖 = 1, … 𝑁)
The sampling plan contemplates a random selection of the phone numbers (correspondent to households), and within each household is selected one individual, between all the residents using a random plan such as the nearest birthday anniversary. Once selected, it was classified as company client using qualification questions. The following step is to do the interview, except if the sample for that specific company was already achieved (M. Vilares & Coelho, 2011)
To ensure that each variable can be statistically significant the following rules are applied (ECSI Portugal, 2016a)
• There was not the possibility of selecting individual replacement. In case of absence it was being done a follow up until 3 times to reach the individual, until be classified as a non-response.
• In the case of mismatch between the phone number and a household (belonging for example to a company) no interview was being done.
• It was only considered valid the questionnaires with at least 80 percent of answered questions • It was collected 250 interviews for each insurance company
To maximize the power of the model and overcome the missing values problem, it was done a mean imputation on the data. Theory indicates that it might be dangerous to replace values of the indicators by its mean since, this attenuated variance can origin to an underestimate of the correlations between variables, can distort the data distribution and generate bias and inaccurate results, however, those are consequences for poor datasets where minimum data collections requirements for indicator are not satisfied (Acock, 2005). Having less than 5% missing data per indicator enhances an effective mean replacement for the proposed model. Additionally, respondents with suspicious response patterns such as straight lining were removed from the dataset.
10
3.1.3. Data Collection
The quantitative research was done using a telephone (mobile and fixed phone) allowing to collect data in all the geographic space. The main purpose of a quantitative research is to develop and employ hypothesis and statistical models searching for correlations or causal effects between variables, since the data is collected in the form of numbers.
Telephone interviews are a very well known method for data collection, providing advantages such as decreased costs, a strong geographic reach, the ability to drive the respondents under complex interviews and high response rates (Novick, 2008).
3.1.4. Questionnaire Structure
The major purpose of this research is to study the effect of several customer metrics in net promoter score of the insurance sector, trying to understand the existence of causal relations between the latent variables considered in the proposed model. This was done measuring the customer’s opinions about image, expectations, perceived quality, perceived value, trust, satisfaction, loyalty and net promoter score. Since these constructs cannot be directly observed or measured, for each latent variable, a set of 3 to 6 questions were included in the questionnaire to serve as indicators to explore the real latent behavior.
The questionnaire has 50 questions and it was composed by:
• An introduction aiming to present the study, the goals and main goal of the investigation and to present the interviewer;
• 4 qualification questions to identify the eligibility of the individual to be part of the target population;
• 7 questions linked to social and economic status;
• And the remaining ones related to the model estimation.
A ratio scale was used in all questions between 1 and 10. It was considered as a negative evaluation, a response between 1 and 4, neutral responses between 4 and 6, positive answers between 6 and 8 and very positive answers above 8.
3.2. S
PECIFICATION ANDS
TRUCTURE OF THEM
ODEL3.2.1. Structural Equation Model
In Marketing Research, attitudes, opinions and personality are relevant drives of consumer’s behavior, yet, as latent variables we cannot observed them directly, we can only make inferences about what we can observe. Therefore, structural models applied to social sciences began to appear after 1970, combining features from principal component analysis and multiple regression.
SEM was considered the right methodology for this research for many reasons, since allowing to identify the importance of each determinants of net promoter score and other latent variables included in the model, such as customer satisfaction or customer loyalty, when, on the other side,
11 single equation models would only allow to understand the determinants of net promoter score. SEM allows to estimate the relations between several latent variables and the relations between each latent variable and its measurement indicators where, in other methods, this approach would have to be done in a separated manner. SEM can also combine the indicator that are building the latent variables in an objective way that can consider, not only the intra-dimensions correlations but also the global coherency of the models. To conclude, it also generates latent variables that can be correlated between them. In studies such as this one, where customer metrics are being analyzed, this is particularly important since the latent variables can hardly be seen as independents (M. Vilares & Coelho, 2011) .
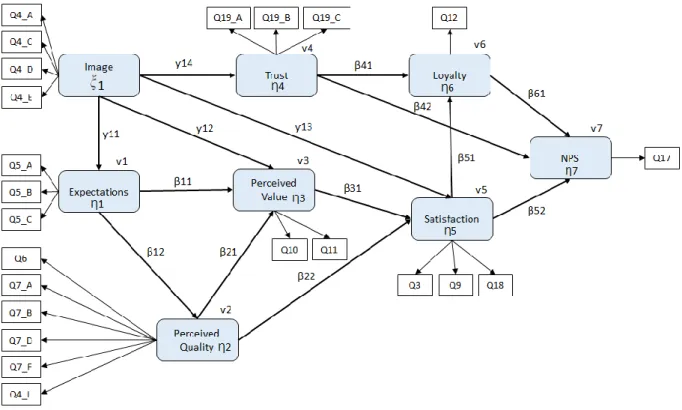
Figure 2 – Proposed Model: Customer metrics and Net Promoter Score
Figure 2 presents the relationships examined in the research: (1) The impact of company image on customer expectations, perceived value, customer satisfaction and trust; (2) the impact of customer expectations on customer perceived value and perceived quality; (3) the impact of customer perceived value on customer satisfaction; (4) the impact of customer satisfaction on customer loyalty; and finally (5) how customer loyalty, customer satisfaction and organization global trust affect net promoter score.
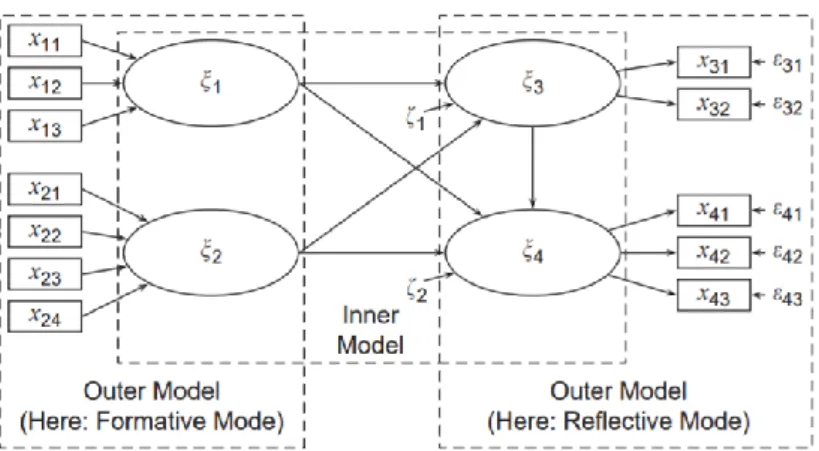
3.2.1.1. Structural Model
The first component of SEM is the structural model also called inner model that refers to the paths between the latent variables. In this context, we call exogenous to the latent variables that don’t have any structural path pointing to them, which is the case of the variable image. On the other hand, we call endogenous to the target latent variables that are explained by other latent variables, which is the case of the remaining variables.
Each exogenous variable can influence one or more endogenous variables and the endogenous variables can have influence on the others endogenous variables. The model presented on Figure 1
12 should be read from the left to the right and each line represent a direct impact measuring the effect of a unitary variation from an exogenous or endogenous variable on an endogenous variable.
The structural model can be written as:
Or in a matrix as:
Than can written in an agglomerated manner as:
Where
𝜂
is a vector of the endogenous variables,𝜉
is a vector of the exogenous variables,𝛽
and𝛾
are matrix of parameters assigned by impact coefficients and𝜈
is a vector of random residuals.3.2.1.2. Measurement Model
The second component of SEM is the measurement model also called outer model that includes the relationship between each latent variable and its observed indicators, obtained trough the questionnaire.
According to Fornell and Bookstein (1982, p.441) the decision on the type of the measurement model, namely reflective, formative or mix, is based on the study objective, theory and empirical contingencies.
Our measurement model is based on reflective relations, since the purpose of the study is to explain the variation of the measurement indicators. It is assumed that these models are measuring the same phenomena or the same latent variable. As for the theory, variables related to attitudes such as satisfaction, loyalty or net promoter score are observed, like the indicators, which are reflexes of the latent variables. Empirically, the measurement model coefficients are obtained through simple regression, meaning they are not affected by multicollinearity problems, making the reflective models
13 more advantageous and more frequently used.
Figure 3 - Data Matrix for a PLS-SEM Example
3.2.2. Model Estimation
It has been proposed two types of methods for the estimation of structural models. One is based on covariances, minimizing the difference between the covariance or correlation matrix of the sample and the correspondent matrix of the theoretical model, the other one is based on minimize the variance of the dependent variable’s residuals, being those latent or observed. The different methods are distinguished by the matrix form (M. Vilares & Coelho, 2011; M. J. Vilares, Almeida, & Coelho, 2010).
3.2.2.1. Covariance Based Methods
According to Ridgon (1998), the different covariance-based methods are variations on the minimization of a common general discrepancy function:
Where S is a vector of the unique (non-redundant) elements of the sample covariance or correlation matrix, ∑ is a parallel vector of elements from the model-implied matrix, and W is a matrix of weights. Different estimation methods correspond to different matrices W. The two most used estimation methods are the Generalized Least Squares (GLS) (with W as the variance and covariance of the residuals) and the Maximum Likelihood Method (ML) (that uses the fitting function ln |∑| + trace (S / ∑) – ln (|S|) – p, with p being the number of indicators).
Among the several programs, able to minimize the different discrepancy functions, the most well-known is LISREL LISREL (Linear Structural Relations), a ML implementation. ML methods produce asymptotically unbiased, consistent and efficient estimators under the empirical conditions that the indicators follow a multivariate normal distribution, the sample is large and independence of observations exists (Clogg & Bollen, 1991).
When these assumptions are violated, these methods may produce, improper solutions such as negative variance estimates. Moreover, these methods do not provide unique values for individual case values of latent variables, since there is an infinite set of possible scores that are consistent with the parameter estimates and finally all the indicators must be treated in a reflective manner because
14 the model otherwise would create a situation where we are unable to explain the covariances of all indicators, which is the rationale for this approach (Chin, 1998; Fornell & Bookstein, 1982a).
3.2.2.2. PLS Methods
PLS for structural equation modeling is a method where no assumptions are made about the distribution of measurement variables or about the independence of observations. The PLS approach has two stages: the first estimates the observations of the latent variables (case-values) with an iterative scheme. The second estimates the parameters of the structural equations and measurement model.
PLS is supported by an iterative process that iterates between two approximations to the latent variables: the inner approximation and the outer approximation. In each iteration the outer approximation produces an estimate for each latent variable as a weighted mean of their manifests. The inner approximation produces another estimate for the latent variables. Here each variable is obtained as a combination of the external approximation of the other latent variables directly connected to it. Various weighting schemes have been used in this context, the best well-known being: the centroid, the factor and the path weighting schemes. The two estimations are iterated until convergence is reached (using a stopping rule based on relative change from previous iteration). From this process each latent variable is determined both by the inner and outer structure, in such a way that both the inner residual variances and the outer residual variances minimized. Finally, case values for the latent variables are obtained, allowing using Ordinary Least Squares (OLS) to estimate, in a non-iterative way, the structural model coefficients, the measurement model loadings, mean scores and location parameters for all variables (M. J. Vilares et al., 2010).
PLS-SEM was the estimation method that become established in marketing and business research (Fornell & Bookstein, 1982b; Henseler, Ringle, & Sinkovics, 2009). It has been increasingly applied in marketing assuming a top position estimation method in published articles for several marketing journals (Henseler et al., 2009). It avoids many of the restrictive assumptions imposed by maximum likelihood (ML) techniques and ensures against improper solutions and factor indetermination. When comparing SEM models and PLS and covariance-base methods, theory points several differences, which were relevant in deciding which method to apply in this research. Covariance-based methods are more appropriate when indicators follow a multivariate normal distribution, the sample is large, and independence of observations exists (Clogg & Bollen, 1991). On the other side, PLS works well with small samples sizes , when assumptions of multivariate normality and interval scaled data cannot be made, and when the researcher is primarily concerned with prediction of the dependent variable (Birkinshaw, Morrison, & Hulland, 1995).
Moreover, a research from Vilares and Coelho (2010), comparing the performance of the two kind of methods, have reveal that globally, PLS estimates were generally better than ML estimates both in terms of bias and precision and that the PLS approach was very robust both to the inclusion of formative blocks and skewed data. On the other hand, the ML estimators were much more sensitive to the various potential deficiencies in data and in the model specification. Finally, PLS has shown a tendency for overestimation of the outer model and for underestimation of the inner model structure, while ML method showed exactly the opposite tendency.
15
3.2.3. Model Evaluation
The measurement model evaluation was done based on internal consistency, indicator reliability, convergent validity and finally discriminant validity (F. Hair Jr, Sarstedt, Hopkins, & G. Kuppelwieser, 2014; Hair, Ringle, & Sarstedt, 2011):
1. Cronbach’s Alpha is an index in reliability analysis and represents a strong tradition in the SEM community as a measure of internal consistency. Describes the extent to which all the items in a test measure the same construct and hence it is connected to the inter-relation of the items within the test. Internal consistency should be determined before a test can be employed for research, to ensure validity. If the items in a test are correlated to each other, the value of alpha is increased. A block is considered homogenous if this index is larger than 0.7 for confirmatory studies. Among several alternative and equivalent formulas, this index can be expressed as:
where Pq is the number of manifest variables in the q-th block.
2. Dillon-Goldstein’s better known as composite reliability, meaning that a block is considered homogenous if this index is larger than 0.7 (Werts, Linn, & Jöreskog, 1974):
3. Indicator reliability measures the outer loadings of the indicators, which corresponds to the contribution that the indicator has for its construct. In other words, measures the relevance of the indicator when explaining the latent variable.
4. Convergent validity aims to verify if the latent variable can explain a substantial part of each indicator’s variance, meaning also that, the variance shared between the construct and its indicator shall be larger than the measurement error variance. It’s a measure that can validated trough Average Variance Extracted (AVE) that according to Fornell and Lacker (1981) is defined by:
where
𝜆
is coefficient of the measurement model equation and𝜀
𝑖
is the equation’s residual.16 5. Discriminant validity implies that a construct is unique and therefore is capturing a
phenomenon not represented by other constructs in the model The structural model evaluation was done based on the below steps:
1. Collinearity assessment measured by tolerance and VIF values had the purpose of verify possible correlation between the predictor variables.
2. Path coefficients examination and assessing the significance of the relationships using bootstrapping, a non-parametric approach to estimate the precision of PLS estimators. It is generated k samples that allow to calculate k estimations for each model parameter. Each sample n is generated trough the extraction of similar sample from the original sample and then it is calculated the significance of the variables.
3. Coefficient of determination (R2), that represents the amount of variance in the
endogenous constructs explained by all exogenous constructs linked to it.
4. Effect size (f2) that intends to evaluate a change in the R2 value when a specific exogenous
construct is omitted from the model, allowing to understand the substantive impact of the omitted construct in the endogenous construct.
5. Blindfolding that instead of directly using the scores of latent variables, it will predict the construct based on an equation where the loadings are multiplied by antecedent exogenous constructs. The blindfolding procedure will then compare the original values with the previous predicted values from the PLS algorithm. The predictive relevance (Q2)
represent a measure of how well the path model can predict the originally observed values.
17
4. RESULTS AND DISCUSSION
Structural Equation Model (SEM) is a estimation method changing the nature of research in marketing and management by distinguish between the measurement model and structural model, taking error measurement into account as well (Henseler et al., 2009). Among the two families of SEM techniques, covariance-based represented by LISREL and variance-based, commonly represented by PLS, the most appropriated type for this research was variance-based.
PLS-SEM is focused on variance of the endogenous variables, without inference hypothesis neither on the distribution nor on observation individuality. PLS popularity comes from, in first place, instead of solely drawing on the common reflective mode, it allows the computation of cause-effect relationship models for both reflective and formative measurement models (Diamantopoulos & Winklhofer, 2001). Secondly, it can be used to estimate path models when sample sizes are small (Chin, Wynne, 1999). Third, PLS path models can be very complex without leading to estimation problems and to conclude, it can be used when distributions are highly skewed since there is no distributional requirements (Hair et al., 2011).
Smart PLS 2.0 was the software used for estimating the research model. Initially, measurement model is discussed and analyzed, and then structural model is tested, according to what was described on methodologies section of this document.
4.1. M
EASUREMENTM
ODELAs described in Methodology section (section nº 3) of this document the measurement model was assessed by internal consistency, indicator reliability, convergent validity and finally, discriminant validity. As presented in the Table 1, all the constructs have Composite Reliability and Cronbach’s Alpha index above 0.7 which suggests a correlation between the indicators that are measuring the same construct (Straub, 1989).
The indicator reliability was assessed based on the criteria that loadings shall be greater than 0.7 and that loadings below 0.4 should be removed (Hair et al., 2011). In all cases, loadings were above 0.70, representing the high contribution from the indicators to the construct.
Convergent validity was assessed based on the criteria that average variance extracted (AVE) should be higher than 0.5 (Hair et al., 2011; Henseler et al., 2009). All the constructs successfully achieved values above this threshold meaning that, on average, the construct is explaining more than half of the variance of its indicators. An AVE below 0.5, would contrarily mean that more error was remaining in the items that the variance explained by the construct.
18 Table 1 - Quality criteria and factor loadings
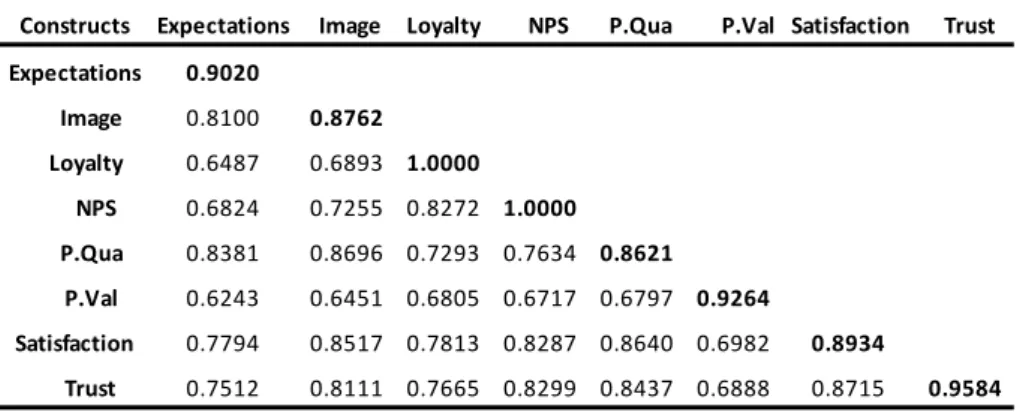
Discriminant validity was assessed based on two criteria, Fornell-Larcker and Cross-loadings criteria. Fornell-Larcker criteria points that the square root of each construct’s AVE should be greater than its highest correlation with any other construct (Fornell & Larcker, 1981). Cross-loadings criteria points that the indicator’s outer loading on the associated construct should be greater than all its loadings on the other constructs (Hair et al., 2011).
According to Table 2, Fornell-Larcker criteria was pointing us relatively approximated values between Perceived Quality and Satisfaction since AVE’s square root (0.8621) was relatively lower than the correlation with Satisfaction (0.8640). Table 3, is presenting the correlation between indicators, and has, however, confirmed the uniqueness of the phenomena, since all the cross-loadings of each indicator for their construct was bigger than the highest correlation with other indicators.
Construct Item AVE Composite Reliability Cronbachs Alpha Loading t-value
Expectations Q5_A 0.8985 23.7475 Q5_B 0.9194 33.2353 Q5_C 0.8879 23.3024 Image Q4_A 0.8846 24.5907 Q4_C 0.8575 18.8114 Q4_D 0.896 27.2862 Q4_E 0.8664 18.9545 Loyalty Q12 1.00 1.00 1.00 1.00 1.00 NPS Q17 1.00 1.00 1.00 1.00 1.00 P.Qua Q6 0.8784 23.0091 Q7_A 0.8962 30.9331 Q7_B 0.8346 13.7883 Q7_D 0.8193 13.3273 Q7_F 0.8782 22.9206 Q7_L 0.8638 18.1994 P.Val Q10 0.9097 22.811 Q11 0.9429 60.6585 Satisfaction Q3 0.8828 22.656 Q9 0.9084 30.7155 Q18 0.8888 29.6059 Trust Q19_A 0.966 78.4296 Q19_B 0.9684 79.543 Q19_C 0.9405 38.1841 0.7982 0.9223 0.8736 0.9185 0.9713 0.9556 0.7433 0.9455 0.9308 0.8583 0.9237 0.8368 0.8136 0.9291 0.8854 0.7678 0.9297 0.8992
19 Table 2 - Fornell-Lacker Criterion: Matrix of correlation constructs and the square root of AVE (in
bold).
Table 3 - Cross-loadings criterion
During the analysis, the items Q7_C, Q7_G, Q7_H, Q_J and Q7_K from the construct Perceived Quality and the item Q4_B from the construct Image were removed, since they didn’t pass the quality criteria for the measurement model. The removal of this items has greatly improved AVE and R-square and
Constructs Expectations Image Loyalty NPS P.Qua P.Val Satisfaction Trust
Expectations 0.9020 Image 0.8100 0.8762 Loyalty 0.6487 0.6893 1.0000 NPS 0.6824 0.7255 0.8272 1.0000 P.Qua 0.8381 0.8696 0.7293 0.7634 0.8621 P.Val 0.6243 0.6451 0.6805 0.6717 0.6797 0.9264 Satisfaction 0.7794 0.8517 0.7813 0.8287 0.8640 0.6982 0.8934 Trust 0.7512 0.8111 0.7665 0.8299 0.8437 0.6888 0.8715 0.9584
Expectations Image Loyalty NPS P.Qua P.Val Satisfaction Trust
Q10 0.5087 0.5274 0.5608 0.5539 0.5536 0.9097 0.5708 0.5545 Q11 0.6362 0.656 0.6883 0.6792 0.6927 0.9429 0.7101 0.7073 Q12 0.6487 0.6893 1.0000 0.8272 0.7293 0.6805 0.7813 0.7665 Q17 0.6824 0.7255 0.8272 1.0000 0.7634 0.6717 0.8287 0.8299 Q19_A 0.7201 0.7796 0.7419 0.8033 0.8026 0.6672 0.8477 0.966 Q19_B 0.7336 0.7849 0.7504 0.8092 0.8184 0.6766 0.8443 0.9684 Q19_C 0.7059 0.7675 0.7107 0.7732 0.8049 0.636 0.8134 0.9405 Q4_A 0.7314 0.8846 0.6268 0.6489 0.7911 0.5613 0.7849 0.7481 Q4_C 0.6778 0.8575 0.5415 0.5908 0.7277 0.5645 0.6905 0.6849 Q4_D 0.7529 0.8960 0.6656 0.6935 0.7947 0.5852 0.7962 0.7433 Q4_E 0.6724 0.8664 0.5751 0.6042 0.7305 0.5498 0.7068 0.6615 Q5_A 0.8985 0.7452 0.5932 0.6285 0.7495 0.5784 0.7153 0.6939 Q5_B 0.9194 0.7358 0.5881 0.6169 0.7672 0.5636 0.6998 0.6787 Q5_C 0.8879 0.7104 0.5738 0.601 0.7511 0.547 0.6938 0.6599 Q6 0.7882 0.8236 0.6804 0.7034 0.8784 0.6074 0.8377 0.7754 Q7_A 0.7766 0.7895 0.6477 0.6727 0.8962 0.6271 0.7777 0.7611 Q7_B 0.6468 0.6947 0.6146 0.6593 0.8346 0.5446 0.7094 0.7144 Q7_D 0.6893 0.7072 0.5433 0.5702 0.8193 0.5649 0.6518 0.6444 Q7_F 0.7056 0.7406 0.6434 0.6751 0.8782 0.5799 0.7524 0.7472 Q7_L 0.7164 0.7317 0.6348 0.6617 0.8638 0.587 0.7254 0.7136 Q9 0.7132 0.7575 0.6997 0.7297 0.7963 0.6263 0.9084 0.7799 Q3 0.6976 0.7882 0.6579 0.6818 0.773 0.5698 0.8828 0.7253 Q18 0.679 0.7391 0.7335 0.8047 0.7474 0.6714 0.8888 0.8267 MAX 0.7882 0.8236 0.8272 0.8272 0.8184 0.6805 0.8477 0.8299
20 therefore, the results obtained. Being the measurement model validated we can move to validate the latent variables of the structural model.
4.2. S
TRUCTURALM
ODELThe PLS estimation was done according to SmartPLS recommendations, using 300 as maximum iterations and applying Mean Replacement Algorithm for missing values. The structural model was assessed based on collinearity between constructs, the path coefficients and the statistical significance of those paths, the coefficient of determination, effect size and blindfolding. Concerning collinearity assessment on Table 4, the threshold varies in the literature between 5 and 10. For this research it was assumed a VIF threshold of 10, misplacing the existence of correlation between predicting constructs (O’Brien, 2007). Constructs Statistical Significance
Table 4 - Multicollinearity – Variance Inflation Factor
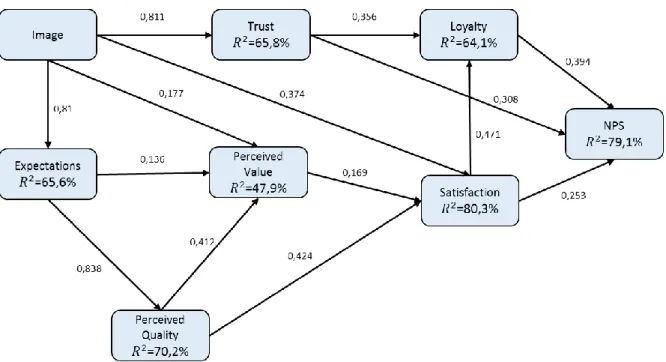
Figure 4 - Structural model results
The model presents, according to Figure 4, reduced coefficient of determination for the latent variable perceived value, yet, presents a explanation power between 65% and 80% in variables trust, customer satisfaction and customer loyalty.
Constructs VIF Expectations 3,712974824 Image 5,184601142 Loyalty 1,056614264 P.Qua 6,509831363 P.Val 2,015949099 Satisfaction 6,298048451 Trust 5,116019859
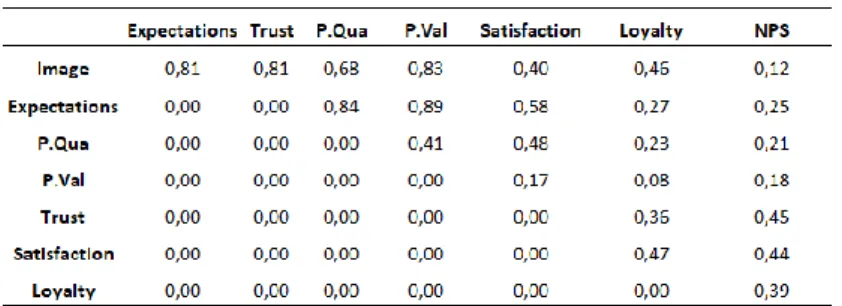
21 Table 5 – Estimations of total effects on the latent variables index
Impact coefficients are measuring the effect on a latent variable due to a unitary variation on another latent variable. They can assume the type of direct effect, where the effect is directly provided by the coefficient, and total effect that are the sum of the direct and indirect effects. Table 5 presents the total effect that each latent variable has on other ones, allowing us to identify the most relevant way to improve the Net Promoter Score.
By measuring the effect size (f2) we are understanding the substantive impact a construct has
predicting Net Promoter Score. From its application we got a reduction on NPS Coefficient of Determination to 73.5% removing Loyalty, 77.7% removing Satisfaction and 77% removing Trust, assuming Loyalty the role of most important variable for Net Promoter Score prediction.
It was also applied blindfolding to assess the predictive relevance (Q2) of Net Promoter Score which
provide the result of 0.7858. Since Q2 is above 0, we can then say that NPS have a larger predictive
relevance for the endogenous constructs.
Based on all levels of quality assessment, we can conclude the structural model can be validated.
22 Regarding the statistical significance on Table 6, we can conclude all the interactions have a strong statistical significance (p<0.01) or (p<0.05) which indicates solid relations among the latent variables.
4.3. R
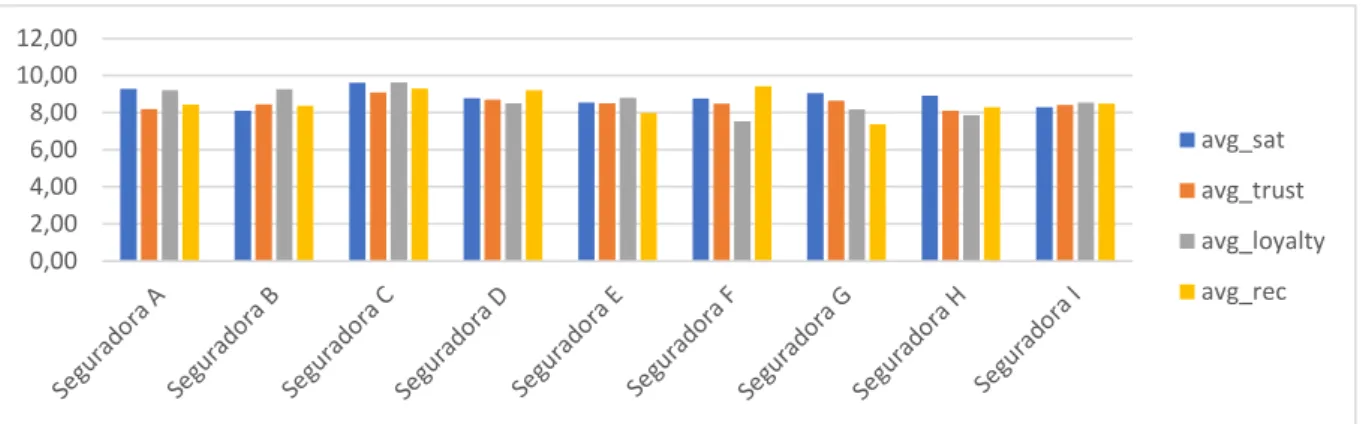
ESULTSFigure 5 - Average results per company
According to the Figure 5, where is presented the average values per insurance company, we can identify which of the companies are performing better in each of the latent variables:
• Satisfaction: o Seguradora C o Seguradora A o Seguradora G • Trust: o Seguradora C o Seguradora D o Seguradora G • Loyalty: o Seguradora C o Seguradora B o Seguradora A • Recommendation: o Seguradora F o Seguradora C o Seguradora D
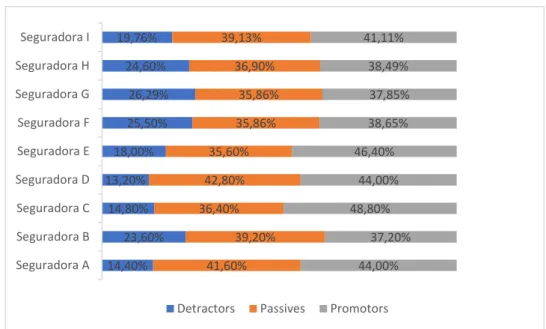
Based on average values for each variable, Seguradora C, Seguradora A and Seguradora D are the ones with better results. In addition, when considering the remaining information on Figure 6, where is presented the distribution of detractors, passives and promotors per insurance company and on Figure 7, where is presented the net promoter score (% Promoters - % Detractors) ordered from the best to the worse insurance company we can obtain the same insights.
0,00 2,00 4,00 6,00 8,00 10,00 12,00 avg_sat avg_trust avg_loyalty avg_rec
23 Figure 6 - Distribution of Detractors, Passives and Promotors per company
Figure 7 - Net Promoter Score per company
14,40% 23,60% 14,80% 13,20% 18,00% 25,50% 26,29% 24,60% 19,76% 41,60% 39,20% 36,40% 42,80% 35,60% 35,86% 35,86% 36,90% 39,13% 44,00% 37,20% 48,80% 44,00% 46,40% 38,65% 37,85% 38,49% 41,11% Seguradora A Seguradora B Seguradora C Seguradora D Seguradora E Seguradora F Seguradora G Seguradora H Seguradora I
Detractors Passives Promotors
34,00%
30,80% 29,60% 28,40%
21,34%
13,89% 13,60% 13,15%
24
5. CONCLUSIONS
Customer satisfaction and customer loyalty are nowadays one of the biggest concerns of all the players in the market and it is a relevant consideration when planning the organization strategy. This is justified by the fact that, as already proved in theory, satisfied customers turn into loyal customers that turn into promotors of the products/services and that ultimately generate a strong financial consolidation and sustainability.
Previous research on the field of customer satisfaction did not fully linked a positive association between satisfaction, loyalty and trust to net promoter score, especially in the insurance sector. To fill this research gap, this study implements a distinct model, whose origin comes from the model applied on ECSI project and that aims to confirm the following hypothesis:
H1 – Image positively affects satisfaction, loyalty and trust
H2 – Expectations positively affects satisfaction, loyalty and trust
H3 – Perceived Quality positively affects satisfaction, loyalty and trust
H4 – Perceived Value positively affects satisfaction, loyalty and trust
The model in Figure 4, explains 80.3% of variation on Satisfaction coming from direct and indirect effects of Image, Expectations, Perceived Quality and Perceived Value, which we can assume as a very positive index. According to Table 5, the most relevant construct predicting Satisfaction with a total effect of 0.58 is expectations, which makes sense, since expectations is related to the prior consumption experience with the firm’s offering and a forecast of the supplier’s ability to deliver quality in the future. The role of expectations is important because of the ongoing relationship between a firm and its clients, such that, expected future quality is critical to overall customer satisfaction (Fornell, Johnson, Anderson, Cha, & Bryant, 1996). On Loyalty, the model explains 64.1% of variation being Image the most important construct predicting it, with a total effect of 0.46, a positive relation also suggested by Sirgy and Samli (1989). On the latent variable Trust, the model shows an explanation of 65.8% of variation coming from the direct effect of Image of 0.81, also justified on literature that suggests that the image perceived by the consumer helps to make tangible the influential factors that are present at the moment of execution of a transaction, diminishing the risk perceived by the individual and simultaneously increasing the probability of purchase (Lin & Ching Yuh, 2010). Thus, H1, H2, H3 and H4 are validated and confirmed.
H5 – Trust positively affects Net Promoter Score
This hypothesis is confirmed and validated. The variable Trust has a strong effect predicting Net Promoter Score trough a direct impact of 0.308 and total effect 0.45 trough Loyalty. According to Table 6, trust also presents a strong statistical significance (p<0.01) when predicting NPS.
We can conclude that, in the field of trust, social relationships are no different from business relationships since people tend to create solid relations and business with organizations they trust. As a consequence, by assuming trust in the organization they’re more likely to recommend it to other people (Hsiao, Lin, Wang, Lu, & Yu, 2010).
25 H6 – Satisfaction positively affects Loyalty
With a direct impact of 0.47 and a strong statistical significance (p<0.01), we can confirm this hypothesis saying that the bigger the level of satisfaction the bigger the level of loyalty. This relation was already proposed in several researches such as Anderson and Fornell (1994); Gummesson (1993); Heskett et al. (1990); Heskett et al. (1994); Reicheld and Sasser (1990); Rust, et al. (1995); Schneider and Bowen (1995); Storbacka et al. (1994); and Zeithaml et al. (1990); Nelson et al. (1992) in industries such as retail banking, health and insurance and in global models such as ACSI and ECSI.
H7 – Satisfaction positively affects Net Promoter Score
Satisfaction appears as one of the most important variables predicting Net Promoter Score with a total effect of 0.44, confirming past research saying that satisfied customers are more likely to engage in positive recommendation and therefore turn into promotors (E. W. Anderson, Fornell, & Lehmann, 1994; Athanassopoulos, Gounaris, & Stathakopoulos, 2001). We can also validate this hypothesis.
H8 – Loyalty positively affects Net Promoter Score
This hypothesis is validated and confirmed. Being loyalty a commitment from a person to remain as a customer of a specific company, it makes sense to also assume that promoters are coming from this bulk of customers. Before being able to recommend something to others, customers need, in first place, to feel completely satisfied during the journey they are having with the organization, and only then they can feel automatically comfortable to recommend it (Serenko & Stach, 2009). Loyalty has then a determinant role predicting net promoter score with a total effect of 0.39.
Although mature studies such as ECSI or ACSI were already studying effects of customer satisfaction, few studies have empirically examined the direct effect of satisfaction, loyalty and trust together on predicting recommendation behavior, being this the most important theoretical contribution of this research. Along with the remaining customer metrics, the model explains 79,10 per cent of the variation on net promoter score, demonstrating that the latent variables used, are important predictors, as already cited in the literature.
This research has also provided valuable insights into the field of studies on experience evaluation and behavioral intentions. The finding suggests that being able to understand how the customer feels in relation to an organization’s services or products can be an asset, since we’re able to identify how likely these customers are to become promotors and of course how confident an organization can feel about future financial performance in the market. From all the insurance companies included in the data analysis process, it’s easy to identify that the greater the evaluation on satisfaction, loyalty and trust the greater the probability of recommendation, which was the case of seguradora C, with a net promoter score of 34%. This percentage means that, this company will have in the market 34 percent more customers as promoters than as detractors, which can in first place pass a good image of the company, increases the trust from the current and potential new customers and finally, facilitates the acquisition of new customers. The last paragraph reinforces the belief that recommendation plays an important role in the insurance environment, being an important step to achieve financial consolidation.
26
6. LIMITATIONS AND RECOMMENDATIONS FOR FUTURE WORKS
Despite the effort to provide a complete view and analysis of the variants that can influence net promoter score, some limitations are recognized.
In first place, since a new theoretical model was being tested, there’s been some problems to identify previous literature proving the relation between some latent variables, being the case for example of the direct relation between trust and net promoter score. Our study was already, in this chapter, an added value for future related works, since, proved this relation.
Secondly, when it turns to assess emotions and attitudes and validating all the hypothesis with sustainable results, although the data collected was extensive, some other important metrics such as customer effort score may also have a word to say when in comes to recommendations, especially when talking about a sector, such as other ones, facing a digital transformation. A digital transformation implies very demanding online solutions to feed the customers with constant and quick ways of accessing services or resolving problems. Since customer effort score evaluates how easy it was to handle a certain issue, it can have a strong impact on net promoter score and perhaps could strongly increase the percentage of variation. Additionally, it is a variable constantly linked to analysis in the field of customer satisfaction and net promoter score (Dixon, Freeman, & Toman, 2010). Firms are also becoming more worried about the customer experience in online shopping but also more worried about the customer’s journey and from that perspective, it would also be interesting to study the same phenomena in the future.
Thirdly, the lack of collected data to assess the relation between NPS and financial performance would clearly turn the study much more complete, because in the business world the goal of measuring all this metrics is to verify how are they related with customer monetary value.
One last future research direction, which is becoming more and more important is data security. Being such a complex issue, it goes beyond technology, trustworthiness, location of data stored, data ownership, the prevalent regulatory and enforcement culture including privacy legislation. It might have also a word to say and can be worth to pursue.