Repositório ISCTE-IUL
Deposited in Repositório ISCTE-IUL:
2019-01-10Deposited version:
Post-printPeer-review status of attached file:
Peer-reviewedCitation for published item:
Ferreira, J. C. & Rato, V. (2018). M2* - mobility to anywhere, an IoT aggregation service platform. In International Conference on Science, Technology and Management (ICSTM). Wellington
Further information on publisher's website:
http://theires.org/Conference2018/NewZealand/1/ICSTM/
Publisher's copyright statement:
This is the peer reviewed version of the following article: Ferreira, J. C. & Rato, V. (2018). M2* -mobility to anywhere, an IoT aggregation service platform. In International Conference on Science, Technology and Management (ICSTM). Wellington. This article may be used for non-commercial purposes in accordance with the Publisher's Terms and Conditions for self-archiving.
Use policy
Creative Commons CC BY 4.0
The full-text may be used and/or reproduced, and given to third parties in any format or medium, without prior permission or charge, for personal research or study, educational, or not-for-profit purposes provided that:
• a full bibliographic reference is made to the original source • a link is made to the metadata record in the Repository • the full-text is not changed in any way
The full-text must not be sold in any format or medium without the formal permission of the copyright holders.
Serviços de Informação e Documentação, Instituto Universitário de Lisboa (ISCTE-IUL) Av. das Forças Armadas, Edifício II, 1649-026 Lisboa Portugal
Abstract— This work addresses the problem of the creation of a central integrated platform to collect and manipulate mobility data and sensor data towards the creation of useful information for users in their mobility process. This is an academic work towards a framework for mobility process, where that manipulate can create useful information for users, public transportation operators and authorities, energy and water real time consumption.
Index Terms—Mobility, Mobile Device, IoT, Sensors, Smart-city
I. INTRODUCTION
Mobility is a very broad and heterogeneous area that influences the daily lives of people, about whom we all know a little, give opinions or contributions, but whose practical actions with success turn out to be few. The reason why this happens is because many of the problems in the area of mobility are not technical, but human, sociocultural, and mostly related to its surroundings. In addition, mass transport, global mobility of goods and services, and population concentration have generated a plethora of new opportunities, as well as challenges with a high degree of complexity, with special emphasis on large urban centers and metropolitan areas.
Nowadays, the mobility process is dominated by individual transportation, where private car represents 46.5% of the commuting movements done by this mean [1]. This has clear consequences in terms of energy, environmental and congestion costs in cities. According to data from the European Commission, road congestion costs in Europe are estimated to amount to more than EUR 110 billion per year (1% of EU GDP) [2], and the transport sector is responsible by about 23.2% of the EU-28 gas emissions [3]. Mobile device and communications plays an important role in the real-time information access to user personalized information and this information access together
According to Pike Research about smart cities [1], it is estimated for 2020 billion EUR for this market, where it will be possible to compare information between different mobility alternatives, concerning variables such as travel time and cost, which can be an extremely useful decision support tool [4]. Real-time information contributes to the reliability of the Public Transportation (PT) system, decreasing the importance of the transport frequency and allowing the reduction of the waiting times (the user is
directed to the stop only at the eminence of the arrival of the transport that he wants). This access to real-time information, offering truly door-to-door multimodal services (including unconventional alternatives such as cars sharing or bike sharing), coupled with the use of simple and immediate payment methods, are conditions for the choice of more efficient transport by the population.
Other factor that contributes to the congestion problem in urban centers is due to the fact that many drivers spend a lot of time looking for a place to park de vehicle. It is estimated that 20% to 30% of city traffic is consequence of the search for a parking space, with a 10-minute average time [4]. The adoption of mechanisms facilitating this task will allow not only greater traffic flow but also significant energy savings and the associated benefits for the environment.
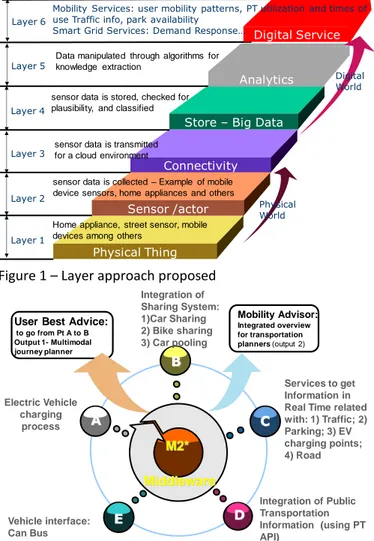
Our proposal in based on IoT approach towards the creation of valuable services used in the mobility process. We propose a layer approach based on Figure 1, where each layer uses previous layer output to give service to upper layer. This model is based on six layers: 1) physical, where we are all sensor types, like home appliance, street count
vehicle, temperature, humidity, noise, CO2 and others
sensors, mobile device. It is possible to interact with these sensors to take data on layer 2. On layer 3 we transfer these sensor data to a central store in a cloud environment based on appropriate communications (Wi-Fi, 3G and others). On layer 4 we check data to remove outliers and store. In some cases we transform this continuous data in discrete data, see examples [5]. Layer 5 data stored are manipulated through proper algorithms, examples of this are the works [6],[7] among others; Layer 6 is a service to use based on knowledge created, example of this are traffic information, parking availability, time spent and distance with mobility among others.
Some of the main problems associated to the mobility process are: 1) Lack of interworking/communication between different systems/technologies; 2) Lack of centralized and updated information of interest to the users; 3) Lack of knowledge and information on mobility and transport, as well as lack of tools to support the decision for public transportation authority’s; 4) Lack of dynamism in the sector and little connection with other strategic sectors, such as health and tourism, with lack of dialogue among stakeholders involved in mobility, to optimize resources, to eliminate redundancies, to identify and implement synergies and to improve the supply and quality of services; 5) Strong use of individual transport, due to lack of alternatives or ignorance about them; 6) Little use of public transport, due to their
M2* - Mobility to Anywhere, an IoT
Aggregation Service Platform
Joao C. Ferreira, Vasco Rato
Instituto Universitário de Lisboa (ISCTE-IUL), ISTAR-IUL
[email protected], [email protected]
inefficiency, inadequate supply to demand, poor quality of services or simply mistrust or lack of habit; 7) Lack of integration in the public transport offer and payment mechanisms of the various operators, which creates barriers to greater use; and 8) Few sustainable alternatives adapted to mobility in urban and mainly historical environments.
Figure 1 – Layer approach proposed
Figure 2 – Main M2* functionalities
This work proposes a mobility aggregator platform middleware (M2* Platform) and a mobile APP called M2*, capable of providing information and services for: 1) End users; 2) Operators and entities responsible for coordination and regulation of mobility, through access to intuitive mechanisms for managing the available services (see Figure 2). In order to achieve this, we propose a middleware capable of aggregating static and real-time mobility data and supporting the development of integrated services and applications in the area of mobility, including:
A. Smart Grid interaction, where demand response approach based on standards like OpenADR plays an important role [8]. From electricity measurements, see Figure 6 it is possible to create external commands based on predefined conditions.
B. Mobility monitor activity through mobile devices sensor data acquisition and all data manipulation towards the knowledge extraction to give useful information for C. Services to get information in real time related with: 1)
traffic information, for details see [10]; 2) Finding parking spaces in urban context in a way that is
integrated with carpooling and bike and car sharing mechanisms; 3) list of EV charging points and their availability; 4) road infrastructure information from maps system layers.
D. Integrating of data from external system based on the usage of system API. Access to Public Transportation data, car sharing, bike sharing and car pooling. Creation of a multimodal journey planner.
E. VIS, Vehicle Interface System, for details see [10] and it is out of this work scope;
In this work concentrate in topics B), C) and D) all related with users mobility process and the importance of sensor data acquisition/manipulation, sharing process and data integration among different systems towards a multimodal journey planner (output 1) and a mobility advisor for public authorities and public transportation operators (output 2) and real time information in a mobile device about electricity/water and temperature in a building.
II. MOBILITY PROCESS AND RELATED WORKS
Mobility is increasingly influenced by factors that hinder
citizens' mobility (traffic congestion, non-updated
information, public events, accidents, maintenance, among others). The day-to-day constraints of citizens (for example, living several kilometers from the workplace, leaving children in school, etc.) and the lack of integrated mobility services lead to less use of public transport and, consequently, increased traffic and congestion on urban areas, increased pollution and reduction in energy efficiency. To these relevant consequences, we can also add the increase in frustration and stress of drivers due to the traffic and the increased time spent on commuting, which decreases the productivity and quality of life of the citizens. It is clear at the moment that having more up-to-date information, more integration and better coordination of transport is central to better mobility, which needs to be inclusive, intelligent and tailored to the needs of users. It is considered that the mobility of the future will have to take into account all the different sources of data, with different levels of granularity and adequate updating frequency. This amount of data can only be managed using integrated and intelligent information systems that respond to the complexity, dynamics and disparities of data sources, as a result of the heterogeneity of cities, regions and countries.
For this reason, we consider that an urban mobility scenario requires the integration of several heterogeneous data sources to provide information about traffic, environmental conditions, people's feelings and their opinions.
External data sources can be classified into four main types: a) Stationary data - describe the static elements that make up the target environment. It includes geographic information, transportation infrastructures, points of interest and other information that may be relevant to perceive the location of the components within the scenario. b) Dynamic spatial data - contains information about a specific point in time. Includes information on georeferenced traffic, traffic and news status, existence of
Store – Big Data Connectivity Sensor /actor Physical Thing Layer 4 Layer 3 Layer 2 Layer 1 Analytics Layer 5 Digital Service Layer 6
Mobility Services: user mobility patterns, PT utilization and times of use Traffic info, park availability
Smart Grid Services: Demand Response…
sensor data is stored, checked for plausibility, and classified
sensor data is transmitted for a cloud environment
sensor data is collected – Example of mobile device sensors, home appliances and others
Home appliance, street sensor, mobile devices among others
Data manipulated through algorithms for knowledge extraction Physical World Digital World M2* B E C D A Electric Vehicle charging process Integration of Sharing System: 1)Car Sharing 2) Bike sharing 3) Car pooling Services to get Information in Real Time related with: 1) Traffic; 2) Parking; 3) EV charging points; 4) Road Vehicle interface: Can Bus Integration of Public Transportation Information (using PT API)
User Best Advice:
to go from Pt A to B Output 1- Multimodal journey planner Mobility Advisor: Integrated overview for transportation planners (output 2) Middleware
events, and all kinds of time information useful for measuring mobility conditions. c) Environmental data - provides information on environmental conditions as well as weather forecasts that may be important to understand the mobility of agents. d) Social networking data - provides useful data streams to extract information about unpredictable feelings and events.
Analysis of these data sources provides important information. They can be obtained in various forms, either through operational databases, text files or data streams. The processes for obtaining these data are generally called extraction, transformation and loading (ETL) processes. Although these processes adapt to the data sources that need to be processed, they have a set of standard principles that are interrelated. Modifying the data structure to optimized formats for analysis is one of the key steps. Other steps involve data cleansing and integration, and other types of transformations that include key modification, value calculation, pre-aggregation, and more.
These data, especially those from external sources (IoT for Smart City, see Figure 1), also need to be treated before being stored. In summary, the main tasks of data processing are: 1) Data cleaning - filling in missing values, reducing data noise, identifying or removing outliers and inconsistencies. 2) Data integration - establishment of relationship between data from various sources. 3) Data transformation - normalization and aggregation. 4) Data reduction - obtain smaller representations in volume but with the same analytical power. 5) Discretization of data - techniques of data reduction with special importance for numerical data. After treatment, the data can be used for access or for processing. Derived data can be generated through these algorithms or even machine learning techniques. This data can be stored in the system for later consultation, analysis and also to improve the performance of other processing algorithms. Example of this are our works [5]
A. State of Art in Systems
The relevant state of the art for this work focuses on: 1) Mobility services that allow travel planning using multiple modes of transport; 2) Tools that provide mobility operators with an integrated view of their service (for example, travel distances and travel times); 3) Personalized assistance services through human language processing; 4) Territorial planning tools for regulatory/mobility coordinators (as well as municipalities and inter-municipal communities) to collect and analyze various metrics of use and performance of transports on their city or region.
Currently, there are several solutions whose objective is to improve mobility and their respective services by providing public transport users with ubiquitous access to mobility information that allows them to plan routes by finding out which means of transport are available and which ones are capable of meeting their needs, either regularly or punctually. Some of these solutions, such as Moovit [https://www.moovitapp.com/], Google Maps,
OpenTripPlanner [www.opentripplanner.org] (now known
as Modeify [modeify.com]) or GoEuro [www.goeuro.pt],
present several characteristics such as the availability of static and geographic information (sometimes multimodal), some of which can provide real-time information, specifically the current location of transport, mainly in high-density metropolitan areas [13]. Most of them visually display routes using user location and taking into account characteristics such as the means of transport and the current state of traffic, offering some alert services related to occurrences of mobility services, from the entity to the consumer and not the reverse.
B. State of Art in Data Analyses
Data Analyses based on big data manipulation are a basis for knowledge creation towards the mobility advisor implementation. The term big data is generally used to describe large and heterogeneous data sets that come from several sources [11]. It usually includes unstructured data masses that need real-time analysis. The most common solutions for storing big data are retrieval engines. These engines have acquired great popularity and use because they allow the use of data with a less rigid structure and favor horizontal scalability. To achieve these characteristics, they sacrifice some of the attributes of reliability. Different engines implement these characteristics differently and there is a wide variety of retrieval solutions. Big Data Analytics represents a set of complex procedures that are executed in big data repositories in order to extract useful knowledge about these data [11]. In the business environment, the teams responsible for the analysis use their expertise in statistics, data mining, machine learning, and data visualization to answer questions their leaders put forward.
There already first implementation steps like entities such as Conveyal [http://conveyal.com], have been working to provide operators with some tools for data management and urban planning (Open Data Tools [12]), as well as
analytical data collection (such as Analyst
[http://conveyal.com/projects/analyst/]). The analytics
collected by these tools focus on urban planning, measuring only the demand and reach of some destinations using the transport fleet (both current and simulated), giving to the users a spatial/geographical notion of available transport. Additionally, this type of analysis provides, through the inclusion of data from different transports, not only more options of displacement, but also the improvement of the experience if the user prefers a specific type of transport. The analytics offered allow the user to perceive, while drawing the way, which points of interest he can visit, always ensuring that they are within a reasonable distance from his current location. In addition, Analyst can, through a Monte Carlo simulation, correlate various factors of the journey, including traffic, time taken in transshipments and waiting time for public transport, using datasets that give great detail in the information of the city. Finally, it is important to note that Analyst has the ability to import data in open formats for public transport and transit in general. In
addition to Analyst, Remix [https://www.remix.com/] stands out, a very advanced commercial solution, completely focused on this field of collection of metrics relevant to urban planning, namely the costs of transportation services, changing their frequency, dimension and the format of the routes, but again from an estimation perspective and not based on historical or real-time collected data.
III. MOBILE OBSERVER BASED ON IOT DATA
Tracking of user activity and associated mobility is now possible at low costs using mobile device sensor information. The data generated using this approach is in the class of big data and has great impact in the study of user mobility habits. This data can be complemented with other sensor data available in the city.
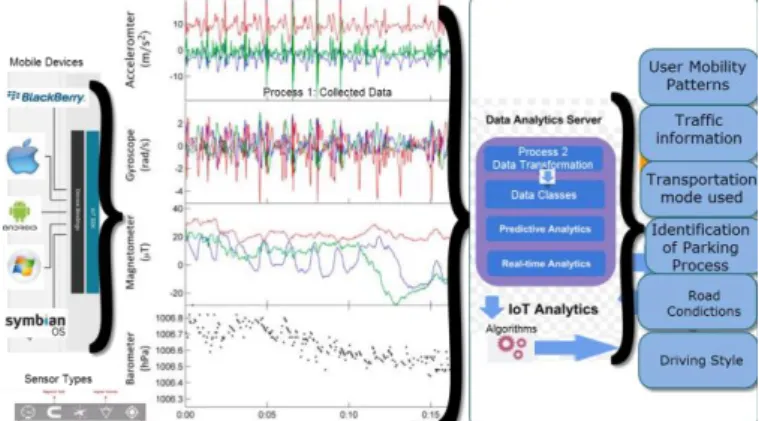
This mobile device sensor data is related with the information of the distinct locations where the users spend their time throughout the day (e.g., home, work, shopping centers, restaurants, etc.). From the data that we have collected, we are particularly interested in identifying locations where people spend a great deal of time, and associating these locations with information about the environment, obtained from geographic information system data sources. Since users carry all times mobile devices it is possible to identify transportation mode [13], driving style [14], identify traffic information [9], identification of parking process [15] and road condition. Figure 3, shows in a high-level process data sensor from mobile devices towards the creation of knowledge. The big data created can be associated and stored in a user mobility profile, in a cloud database, with the information about time and routes (XML graph with time and GPS coordinates). It is possible to present the route representation for that month with associated information of the transportation mode, the number of times the route was performed, and also the temporal periods. Thus, it is possible to represent the time that a user spent in each location. All these profiles can be manipulated to extract useful knowledge for public transportation operators and municipalities’ authorities. This is more less free information about user habits in a city.
Figure 3 – Data Sensor from mobile devices towards the creation of knowledge
IV. M2*PLATFORM
Since we have a diversity of mobility information integrated, it is possible to create user advice taking into account their
main mobility process usage private car, usage public transportation or other.
Case 1: Driver in a car and system detected traffic with high delays. M2* based on current location can look of public transportation and parking near and give advice with detailed information
Case 2: Based on past route M2* can generate advice towards carpooling based on the similarities of users’ route and times
Case 3: user needs information to reach point A, so M2* based on current position can advise about public transportation routes or other car or bike sharing alternatives
Case 4: user wants to go to a point C in other country. Since we can access data from different public transportation providers, it is possible to create an overview with transportation to the airport in the origin country and transportation out of destination airport
A. Multimodal journey advisor
This approach is based on other successful approaches of web mashup application development [9]. A mashup process uses content from more than one source to create a single new service displayed in a single graphical interface. One success example of this approach is the Google Maps where there is a combination of different information sources. The term implies easy, fast integration, frequently using open application programming interfaces (open API) and data sources to produce enriched results that were not necessarily the original reason for producing the raw source data. Therefore, this approach could solve the problem of integration of different data schemes of public transportation, but its main contribution is to overcome the problem of public transportation data access. Most of the times public operators do not provide data access.
Our work goal is to use this approach for the multimodal journey planner based on the information integration and manipulation of different journey planners of different operators that can offer services between user’s start point A and final point B. The user’s requested journey is split into component parts which can be planned by individual local journey planners, in a way that will allow the separate parts of the journey to be linked together into a seamless itinerary. This approach allows an incremental development of journey planning capabilities across Europe as each nation or region creates local journey planning systems that can integrate such a network or networks. It aims to make the user’s experience familiar for residents in all countries by enabling existing journey planning systems to seek information about journeys to, from or wholly beyond their own boundaries and to present that information to users, in their own languages and in familiar ways, on the systems that they use for local journey planning.
The journey planning process is based on the following process, as seen in Figure 4:
1. an interface to receive the user’s query about transportation needs, by the indication of start and end points of a journey (along with the required time and date of departure or arrival). This can be complemented by a
process to resolve any ambiguities in the possible matches;
2. a handle context of local public transportation infrastructure, which is solved by the introduction of Public Transportation Ontology;
3. an interface to different public transportation operators’ systems;
4. an aggregator, which based on public transportation space ontology creates the context for multiple operator queries through their available API. The aggregator system sends elements of the journey request to one or more relevant “distant” journey planners and receives a response from each of those planners;
5. an organized output of process 4 to the routing algorithm; 6. the application of routing algorithm and present solution
to the user in a map.
Figure 4 – Proposed system architecture for multimodal journey planner
V. SERVICE APPROACH ARCHITECTURE
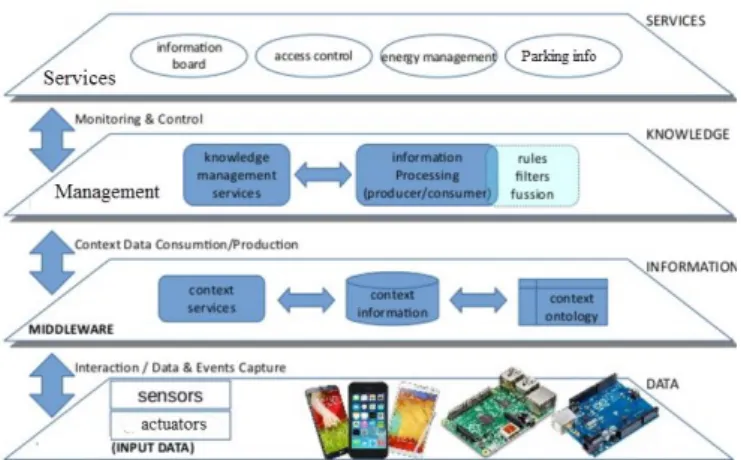
Figure 5 shows our vision for the problem where a diversity of sensors were installed at campus. These sensors provide data to a central cloud server, where the information is manipulated toward the desirable goal. A service-based approach is used to provide flexibility and allow the reuse of several algorithms towards the desirable extracted knowledge.
The proposed architecture is composed of four layers: 1. Data layer, which comprises the data collection from
the installed sensors.
2. Information, where data is manipulated towards achieving desirable information, based on data mining algorithms that are out of scope of this paper. 3. Knowledge, where this information can be used for campus management, and specific functional roles act on infrastructure and systems to optimize operation conditions.
4. Services, which feed main applications in a service-based approach, where the information can be incorporated in the related service; for example, the info about the number of empty spaces at the parking facilities can be used to increase the number of persons using them.
From the big data created, patterns can be extracted and analyzed. It is thus possible to make predictions about the physical or social phenomena being observed. The task of identifying patterns from big data is related to the application domain and oriented to a specific usage. In a university, the information to be collected and analyzed has the main objective of allowing an improved operations management
that leads to savings and therefore to a more sustainable performance. Nonetheless, in this type of institution, the ability to have data and detect patterns should also be related to research and teaching goals. In fact, these big data sets are also a major opportunity in the search for models relating several levels of information: external environmental conditions (temperature, relative humidity, solar radiation, wind speed, noise pollution, and air quality); internal environmental conditions (air temperature, radiant temperature, relative humidity, air displacement, noise level and air quality); time, date and location-related occupancy patterns and rate; resource consumption and waste and emissions generation.
Data collection was decided for sensors to measure, electricity and water consumption, measurement of temperature, light and humidity and turn on/off main water entrance during night period (from 23pm to 7am).
A. Electricity Consumption Monitoring System
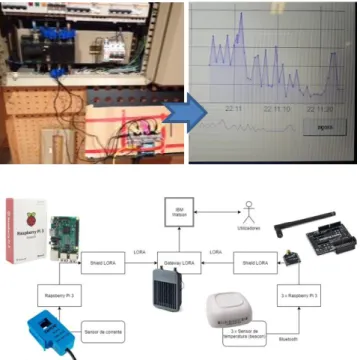
The hardware of the developed electricity monitoring system costs less than 100€ and is based on the following components:
1. Concentrator/Emitter: Arduino Uno + Dragino LoRa Shield and a PCB ProtoShield Interface for 3 current sensors.
2. Current sensor: YHDC SCT013-000, current
transformer, 100A:50mA.
3. Receiver - Raspberry Pi 3 Model B + LoRa Module. Figure 6 presents an overview of the implemented architecture, with a LoRa network and IoT platform (Bluemix) to centralize the information.
Figure 5 – General overview of proposed architecture of our IoT smart campus system
From the big data created, patterns can be extracted and analyzed. It is thus possible to make predictions about the physical or social phenomena being observed. The challenge in identifying patterns from big data is based on domain and oriented to a specific usage. In a university, the information to be collected and analyzed has the main objective of allowing an improved operations management that leads to savings and therefore to a more sustainable performance. Nonetheless, in this type of institution, the ability to have data and detect patterns should also be related to research and teaching goals. In fact, these big data sets are also a major opportunity in the search for models relating several cd multimodal User Query Public Transportation Operator System A Public Transportation Operator System B Public Transportation Operator System C Public Transportation Operator System Z Aggregator Public Transportation Ontology
Route path from different operator Routing Algorithm Route Adv ise API
levels of information: external environmental conditions (temperature, relative humidity, solar radiation, wind speed, noise pollution, and air quality); internal environmental conditions (air temperature, radiant temperature, relative humidity, air displacement, noise level and air quality); time, date and location-related occupancy patterns and rate; resource consumption and waste and emissions generation. Figure 6, shows our work on electricity consumption. Through our approach we connect our data to bluemix platform (https://www.ibm.com/cloud-computing/bluemix). From where it is easy to create on web or mobile devices information about real time consumption, create alerts on facebook, SMS or even actions like turn on/off lights, heating or air condition.
Figure 6 – Electricity Real time measurements
VI. CONCLUSION
The main goal of this work is to bring ICT and Internet of Things (IoT) approaches to this upcoming growing area of sustainable mobility process in smart cities. All proposed system modules are oriented in a way that mobile devices should be part user mobility process.
Increasing market penetration of IoT sensors is a reality with application in different areas: energy, automotive, healthcare, consumer spaces and general facility management. This is an ideal opportunity for an IoT application based on internal interest taking advantage of current state of technology (prices going down). In this paper we perform a high level vision about our proposed approach. This IoT approach is able to monitor persons and process and this data can be manipulated to extract knowledge. This knowledge has a profound impact on mobility process because real time data can help users on their mobility process. Also public transportation operators and public authorities can benefit from an overview data about users mobility process.
REFERENCES
[1] Report of pikeresearch on smart cities available at http://www.pikeresearch.com/research/smart-cities [acceded November 2017]
[2] Managing urban traffic congestion. Technical report, OECD Publishing (2007)
[3] Report of EU on A European Strategy for Low-Emission Mobility , available at https://ec.europa.eu/transparency/regdoc/rep/ 10102/2016/EN/10102-2016-244-EN-F1-1-ANNEX-1.PDF
[acceded November 2017]
[4] http://www.siemens.com/press/pool/de/feature/2015/mobi lity/2015-02-smart-parking/background-no-more-searching-for-parking-spaces-e.pdf
[5] João C. Ferreira, Vítor Monteiro, José A. Afonso, João L. Afonso. Methodology for Knowledge Extraction from Mobility Big Data Distributed Computing and Artificial Intelligence”, in Advances in Intelligent and Soft Computing, 1st ed., Sigeru Omatu, Ali Selamat, Grzegorz Bocewicz, Pawel Sitek, Izabela Nielsen, Julián A. García-García, Javier Bajo, Ed. AISC Springer Verlag, 2016, ISSN: 2194-5357
[6] João Ferreira, Jose Almeida, Alberto Silva. The Impact of Driving Styles on Fuel Consumption: A Data Warehouse and Data Mining based Discovery Process, IEEE Transactions on Intelligent Transportation Systems Magazine on Intelligent Transportation Systems in March 2015. DOI (identifier) 10.1109/TITS.2015.2414663
[7] Nuno Baeta, Agnelo Fernandes, Joao C .Ferreira. Tracking Users Mobility at Public Transportation. PAAMS 2016 proceedings – Volume 2 published by Springer CCIS
[8] P-56. João Ferreira, Hugo Martins, Manuel Barata, Vítor Monteiro, João L. Afonso, “OpenADR - Intelligent Electrical Energy Consumption towards Internet-of-Things”, CONTROLO Portuguese Conference on Automatic Control, Guimarães – Portugal, Sept. 2016
[9] .João C. Ferreira, Vítor Monteiro and João L. Afonso, “Vehicle-to-Anything Application (V2Anything App) for Electric Vehicles”. Industrial Informatics, IEEE Transactions on Industrial Informatics,Volume 10, N3. Digital Object Identifier: 10.1109/TII.2014.2343273, Publication Year: 2014 (august) , Page(s): 1927
[10] José Barata, Rui Ferro and João Ferreira. MY TRAFFIC MANAGER in proceedings of Conference on Electronics, Telecommunications and Computers (CETC2013), ISEL 5-6 December 2013
[11] Amir Gandomi, Murtaza Haider, Beyond the hype: Big data concepts, methods, and analytics, International Journal of Information Management, Volume 35, Issue 2, April 2015,
Pages 137-144, ISSN 0268-4012,
http://dx.doi.org/10.1016/j.ijinfomgt.2014.10.007
[12] https://www.europeandataportal.eu/sites/default/files/edp_ analytical_report_n4_-_open_data_in_cities_v1.0_final.pdf
[13] S. Reddy, M. Mun, J. Burke, D. Estrin, M. Hansen, M. Srivastava, “Using Mobile Phones to Determine Transportation Modes,” ACM Trans. on Sensor Networks, v6, n2,13-40, 2010.
[14] João C. Ferreira, Vítor Monteiro, José A. Afonso, João L. Afonso. “Tracking Users Mobility Patterns Towards CO2 Footprint. Distributed Computing and Artificial Intelligence”, in Advances in Intelligent and Soft Computing, 1st ed., Sigeru Omatu, Ali Selamat, Grzegorz Bocewicz, Pawel Sitek, Izabela Nielsen, Julián A. García-García, Javier Bajo, Ed. AISC Springer Verlag, 2016, ISSN: 2194-5357
[15] João C. Ferreira. Ad Hoc IoT Approach for Monitoring Parking Control Process 13th International Conference on Intelligent Environments - IE'17