lArtigos científicos
N.°2, Vol. 1, 2004, pp. 55a 67
Improving Efficiency in Fast Food
Restaurants
A Frontier Approach
Victor M. Gimenez*University School of Tourism and Hotel Management - Universitat Autónoma de Barcelona
A b s t r a c t
M e a s u r e m e n t of o p e r a t i n g e f f i c i e n c y is indispensable for service businesses. Modem and r i g o r o u s m e t h o d o l o g i e s for q u a n t i f y i n g overall efficiency are required in competitive sectors such as the restaurant industry in Spain. For example, chain restaurant managers need tools for carrying out a benchmarking process among their own or franchised restaurants to identify which ones are i n e f f i c i e n t a n d , as r e s u l t , set t a r g e t s f o r t h e improvement of their inputs and outputs in order to m a k e t h e m e f f i c i e n t . F o r t h i s p u r p o s e , a methodology known as data envelopment analysis is used to measure the overall operating efficiency of a leading Spanish restaurant chain. The study found that, by correcting the inefficiencies identified through the model, profit improvements amounting over 1.5 million euros could be achieved.
K e y w o r d s O p e r a t i n g e f f i c i e n c y , d a t a e n v e l o p m e n t a n a l y s i s , r e s t a u r a n t i n d u s t r y , b e n c h m a r k i n g , improvement targets R e s u m o A m e d i ç ã o d a e f i c i ê n c i a d e o p e r a ç õ e s é i n d i s p e n s á v e l p a r a os n e g ó c i o s na á r e a d o s serviços. Sectores competitivos, como é o caso do sector d a r e s t a u r a ç ã o e m E s p a n h a , requerem m e t o d o l o g i a s m o d e r n a s e r i g o r o s a s p a r a quantificarem a eficiência na sua globalidade. Por exemplo, os gestores de cadeias de restaurantes necessitam de ferramentas para poderem levar a cabo um p r o c e s s o de b e n c h m a r k i n g nos seus próprios restaurantes f r a n c h i s a d o s de modo a i d e n t i f i c a r os q u e n ã o s ã o e f i c i e n t e s e, c o n s e q u e n t e m e n t e , e s t a b e l e c e r m e t a s p a r a melhorar os seus inputs e outputs de modo a torná-los e f i c i e n t e s . N e s t e s e n t i d o , a m e t o d o l o g i a c o n h e c i d a c o m o a n á l i s e por e n v o l v i m e n t o de dados é utilizada para medir a globalidade d a e f i c i ê n c i a d e o p e r a ç õ e s de u m a c a d e i a d e restaurantes líder em Espanha. O estudo mostra que, corrigindo as ineficiências identificadas pelo modelo, podem ser atingidos aumentos de lucro superiores a 1.5 milhões de euros.
P a l a v r a s - c h a v e
E f i c i ê n c i a d e o p e r a ç õ e s , a n á l i s e p o r envolvimento de dados, sector d a restauração, benchmarking, metas de melhoria
RTÃD
56Acknowledgments - The author is grateful to Dr. Gerda Priestley for her helpful comments. Earlier versions of this paper were presented at the 2001 International TURDES conference, Cuba and the 2001 National ACEDE Conference, Spain. The author would like to thank contributors at both conferences for their comments.
1 Introduction
Survival and the creation of value in both manufacturing and service businesses that operate in an environment of growing competitiveness u n d o u b t e d l y r e q u i r e s the m e a s u r e m e n t a n d continued improvement of their operating efficiency. This concept is clearly defined in microeconomic theory, although it has rarely been applied to business management due to the lack of suitable techniques for these conditions. However, there has been significam interest in academic and business circles r e g a r d i n g its m e a s u r e m e n t , w h i c h is traditionally relegated to the calculation of partial productivity ratios.
The concept of efficiency is an especially useful tool in analysing the management of companies that do business through multiple business units, such as restaurant or hotel chains in the tourist industry. Follow-up of these units has usually taken place based on the monitoring of a number of absolute variables, such as turnover, costs grouped in various categories, consumption and results. T h e s e v a r i a b l e s h a v e f r e q u e n t l y b e e n complemented by others of a relative nature - ratios - associated with the concept of profitability or productivity. In the latter case, the numerator which appears in the ratios is an output, e.g. the units produced or sold of a given product or service, while the denominator is an input, e.g. the number of employees. What is known as partial productivity measure is thereby obtained. There are several examples of productivity ratios employed in the hospitality sector as meais produced/number of kitchen staff, total guest rooms/total kilowatt hours, restaurant revenue/total management salaries, food cost/food sales, etc. (Ball, Johnson and Slattery, 1986). These ratios can be designed to measure financial results or relationships between physical inputs and outputs, however financial measures are preferred by hospitality managers (Messenger and Mugomeza, 1995).
Unfortunately, several problems associated with the follow-up of business units based on ratios exist. Firstly, their conjunction is difficult in order to obtain
an overall view of the business p e r f o r m a n c e (Thanassoulis, Boussofiane and Dyson, 1996). However, it is essential to consider outputs and inputs simultaneously in the quest for productivity (Ball, Johnson and Slattery, 1986). For this purpose, tools such as the well-known "balanced scorecard" (Kaplan and Norton, 1996) have been devised. Nevertheless, these techniques generally fail in their attempt to obtain an overall view of the operation of the business. Kaplan (1990) argues that measures conducted in isolation do not give sénior management the full picture for making effective decisions on strategy. Secondly, when c o m p a r i n g different size units, ratio analysis assumes constant returns to scale. In other words, it is supposed that performance does not depend on the size of facilities. Thirdly, environmental or non-discretionary factors influencing performance such as, location or area wealth, are not taken into a c c o u n t w h e n p e r f o r m a n c e m e a s u r e s are computed regardless of the technique applied (Banker and Morey, 1986; Lozano-Vivas, Pastor and Hasan, 2001). Finally, improvement targets set by m a n a g e r s b a s e d on t r a d i t i o n a l p a r t i a l performance measures usually utilise as bottom tine historical measures (Kaplan, 1990) while improvement targets are often set arbitrarily. However, targets for inefficient units should be set as result of a rigorous economic analysis based on a performance benchmarking of the whole units evaluated. In addition, targets should consider environmental factors (location, for instance) and the current service quality leveis reached (Kaplan,
1990). For the relationship between quality and performance in the hospitality and restaurant industry see Schroeder (1985), Butterfield (1987), Witt and Moutinho (1994) and Jones (1988).
The aim of this work is to present a technique called Data Envelopment Analysis (DEA) that solve the p r o b l e m s d e s c r i b e d a b o v e . DEA models measure overall operative efficiency and are useful for establishing objectives for its improvement. This methodology is especially suitable for companies working through business units. Data Envelopment Analysis models take advantage of the know how of the business units being analysed, identifying those that are efficient and inefficient, and set improvement objectives for the latter based on the achievements of the former. In other words, they carry out a benchmarking of the units evaluated, u s i n g only the i n f o r m a t i o n a v a i l a b l e in the organisation itself regarding its business units, w i t h o u t n e e d i n g to m a k e any t h e o r e t i c a l
RT&D.
'Artigos científicos 57
suppositions. DEA has the advantage of taking into account simultaneously ali input and ali output leveis of a unit analysed (Thanassoulis, Boussofiane and Dyson, 1996). However, DEA models have some drawbacks that should be highlighted. Probably the most important is that the frontiers estimated by DEA models are very sensitive to the outliers. Thus, a previous analysis should always be carried out in order to'assure that this units do no exist within the evaluated sample. Fortunately, in our case, this will not be necessary since data has been provided directly by the restaurant chain managers who assured us there was not errors in the data.
This technique is classified within the methodology of frontier models. It is upheld by the rigorous concept of technical efficiency offered in microeconomic theory. It is also supported by the abundant literature that has appeared in the most prestigious scientific publications specialising in business management (Andersen and Petersen, 1993; Athanassopoulos and Shale, 1997; Banker, Chames and Cooper, 1984; Beasley, 1990; De Borger, Ferrier and Kerstens, 1998; Pedraja-Chaparro, Salinas-Jiménez and Smith, 1999; Seiford, 1995; Wagstaff, 1989; Thanassoulis and Dyson, 1992).
Frontier models have not been profusely applied to the tourism sector. Morey and Dittman (1995) evaluated the performance of a hotel general manager through the application of a DEA model. The model used by these authors was set up to identify the potential reduction in inputs while outputs were maintained (i.e. input minimisation). Two years later, Morey and Dittman (1997) applied DEA in selecting a hotel property. Their model combined DEA and regression analysis to deal with the interfaces between operations management and marketing. Anderson, Fish, Xia and Michello (1999) employed a stochastic frontier technique to estimate managerial efficiency leveis in the hotel industry. This limited evidence makes it clear that efficiency analysis is generally lacking in the tourism sector. This paper aims to contribute to this type of study by evaluating the operative efficiency of the restaurant industry using a DEA model.
The remainder of the article is organised as follows: the section "The concept of efficiency" provides an analysis of the microeconomic and conceptual basis for DEA models; the analytical framework is formulated in the section entitled "Methodology". This is followed by the practical application of a DEA model to the modern
restaurant industry for the real case of a group of 16 restaurants belonging to a well-known Spanish chain. Although, in this case, the empirical application is focused on the modern restaurant industry, it is equally applicable to other similar cases in the tourist industry, e.g. hotel chains. The article is completed with a synthesis and the main conclusions of the study.
2 The concept of efficiency
Efficiency of a DMU can be estimated by comparing the observed values with the optimum values corresponding to inputs and outputs. This comparison may be made using the maximum obtainable output, for a given levei of inputs and the one really attained, or by comparing the minimum levei of inputs necessary for a given levei of outputs and that really used (Lovell, 1993). Efficiency normally refers to the levei of inputs and outputs in physical units, and for this reason it is called operational or technical efficiency. However, the values observed can also be compared with the optimum values of variables such as costs, income and profit, in which case economic efficiency would be measured.There are three basic problems with calculating efficiency (Lovell, 1993). Firstly, there is the dilemma of how many and which inputs and outputs should be included in the analysis. According to Stiegler (1976), the inefficiency of a production unit may be a result of the failure to include ali the inputs and outputs. If the underlying technology is unknown, an essential input or output may easily be omitted. Secondly, how various inputs and outputs should be added when they are expressed in different measurement units. The solution frequently applied is to use prices as a homogenising element, but these are often unavailable or unreliable, especially when evaluating public sector units. Finally, there is the problem of how to determine the optimum levei or performance for comparative purposes. This is a truly complex problem. At a theoretical levei, it seems obvious that optimum behaviour should be located on the frontier of production, but this is a theoretical concept that cannot be observed in reality. It is for this reason that a considerable amount of literature has appeared regarding how to build empirical production frontiers and how to choose an empirical production unit as a comparative element when evaluating the performance of a specific production unit. The technique presented in this article provides
RT&D
58
answers to the last two questions.
In existing literature, the general nature of the concept has encouraged the appearance of various definitions. Fundamental contributions have been made by Koopmans (1951), Debreu (1951) and Farrell (1957). Koopmans defined the situation of technical efficiency as one in which an increase in any of the outputs demands a reduction in one of the others or an increase in at least one of the inputs (focusing on outputs), or where the reduction of any input requires at least an increase in another or the reduction of an output (focusing on inputs). On the other hand, Debreu and Farrell defined technical efficiency as either the difference between 1.00 and a coefficient representing the highest proportional reduction in ali inputs that still enables ali the outputs to be produced (focusing on inputs) or alternatively, as 1.00 plus the highest permitted proportional increase in ali the outputs with the same consumption of inputs (focusing on outputs). A DMU with an efficiency coefficient of 1.00 therefore indicates that its performance is not improved by another. An efficiency of less than 1.00 or greater than 1.00, depending on whether an input- or output-based focus respectively has been chosen, will show the levei of inefficiency. For example, in a focus on inputs, an inefficiency of 0.85 would indicate that this DMU must reduce consumption of ali its inputs by 15% to be efficient. However, in an output-based study, an efficiency levei of 1.20 would indicate that ali its outputs must be increased proportionally by 20% in order to be efficient.
In fact, Koopmans' concept of efficiency is stricter than that of Debreu-Farrell, and as will be seen, ali efficient units in Koopmans' terms are also efficient in those of Debreu-Farrell, while the opposite is not necessarily true. In order to define the Debreu-Farrell (DF) measurement more exactly and to make it comparable with that of Koopmans, some concepts and a notation that will also be useful to us throughout this study will be introduced.
Let there be some DMUs that use the inputs
x=(x
l
,...,x
) e R" to obtain the outputs y={yi,...,ym)eRr.A production possibility set is defined as:
L(y) = { x: (y,x) is feasible} [1]
i.e. those leveis of use of inputs "x" that produce at least the possible different combinations of the outputs vector "y".The isoquant is defined as:
Isoqly) = { x: x e Lfy), &x<£ Lfy), [0,l)}
[2]which represents those minimum combinations of inputs "x" necessary to obtain the same output vector "y". As is well known, isoquants are the set of ali the possible combinations of production factors sufficient to obtain a given production quantity.
Efficient set is another important concept when describing a technology which can be formally defined as:
EfMy)
= {x-.x&l{y), xéliy), x'<x]
[3]
with the property that ali points belonging to the efficient set also belong to the isoquant, thus making the statement
EffLyy) (Z IsoqL(y)
true.DF efficiency measurement in the case of input-oriented DF can be mathematically expressed as:
DF, (x,y) = min { Â: Xx e L(y)} [4]
withDF, {x,y)<
1.
Note that:
IsoqL{y) = {x:DF
l
(x,y)=l} PI
means that the unit would denote total efficiency and lower values than 1.00 the importance of inefficiency.
Focusing on the outputs approach the production possibility set would be made up of ali the combinations of factors and technologically feasible products that can be formalised in the following way:
P(x) - {y : (x,y) are feasible} [6]
In this case, the isoquant would be:lsoq$c)'={y: yeP{x), 0y£f{x), 0e
(U~>)}
[7]
The efficient set would be defined as:
Efrtx) = {y- yeP(x), y* P{X), y > y)
[81and the DF efficiency measurement as:
DF
0
(x, y)= max{ 9: Oy e P(x)}
[9] Thus,,fF^.T"jj^.,fwil _
ios científicos
DFo {x,y)>\ [10]
and:
IsoqP{x) = {y: DFo{x, y) = \ [11]
denoting the unitary value of total efficiency, while values greater than this denote the levei of inefficiency.
Note that Koopmans' definition of efficiency supposes that an efficient DMU will always belong to the efficient set, while Debreu-Farrell's definition of efficiency only supposes that it belongs to the isoquant.
Figure 1 depiets the meaning of the efficiency measurements of Koopmans and Debreu-Farrell, in order to demonstrate the differences between them more clearly.
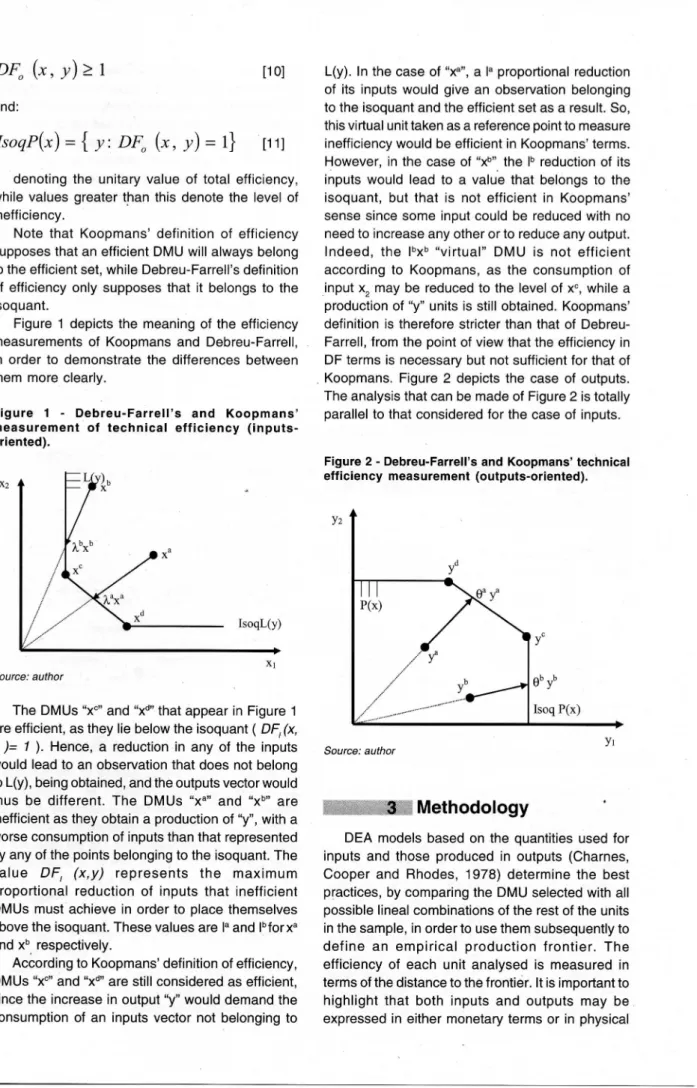
Figure 1 - Debreu-FarrelTs and Koopmans' measurement of technical efficiency (inputs-oriented).
X2
IsoqL(y)
Source: authorThe DMUs "x°" and "xd" that appear in Figure 1
are efficient, as they lie below the isoquant ( DFs(x, y )= 1 ) . Hence, a reduction in any of the inputs would lead to an observation that does not belong to L(y), being obtained, and the outputs vector would thus be different. The DMUs "xa" and "xb" are
inefficient as they obtain a production of "y", w't n a
worse consumption of inputs than that represented by any of the points belonging to the isoquant. The value DF, (x,y) represents the maximum proportional reduction of inputs that inefficient DMUs must achieve in order to place themselves above the isoquant. These values are Ia and lbforxa
and xb respectively.
According to Koopmans' definition of efficiency, DMUs "xc" and "xd" are still considered as efficient,
since the increase in output "y" would demand the consumption of an inputs vector not belonging to
L(y). In the case of "xa", a Ia proportional reduction
of its inputs would give an observation belonging to the isoquant and the efficient set as a result. So, this virtual unit taken as a reference point to measure inefficiency would be efficient in Koopmans' terms. However, in the case of "x"" the lb reduction of its
inputs would lead to a value that belongs to the isoquant, but that is not efficient in Koopmans' sense since some input could be reduced with no need to increase any other or to reduce any output. Indeed, the lbxb "virtual" DMU is not efficient
according to Koopmans, as the consumption of input x2 may be reduced to the levei of x°, while a
production of "y" u r |it s is s tiH obtained. Koopmans'
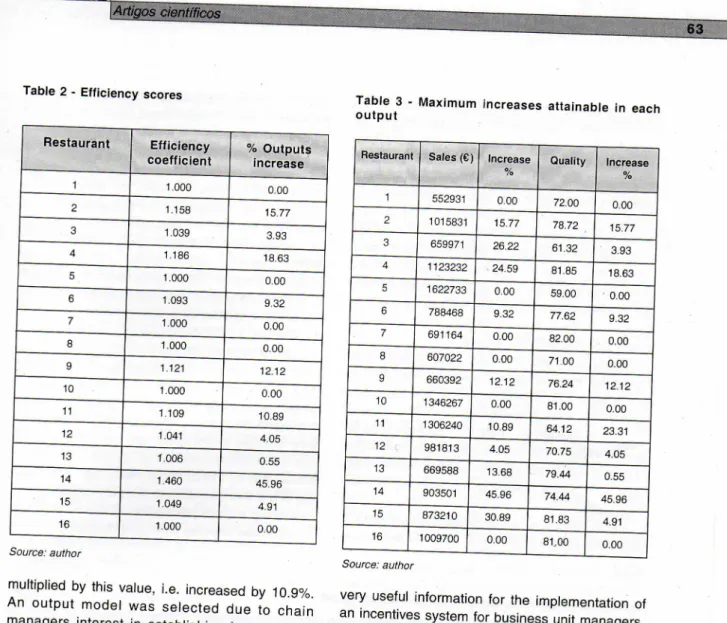
definition is therefore stricter than that of Debreu-Farrell, from the point of view that the efficiency in DF terms is necessary but not sufficient for that of Koopmans. Figure 2 depiets the case of outputs. The analysis that can be made of Figure 2 is totally parallel to that considered for the case of inputs.
Figure 2 - Debreu-Farrells and Koopmans' technical efficiency measurement (outputs-oriented).
y
dP(x)
y
c e VIsoq P(x)
Source: author yi3 Methodology
DEA models based on the quantities used for inputs and those produced in outputs (Chames, Cooper and Rhodes, 1978) determine the best practices, by comparing the DMU selected with ali possible lineal combinations of the rest of the units in the sample, in order to use them subsequently to define an empirical production frontier. The efficiency of each unit analysed is measured in terms of the distance to the frontier. It is important to highlight that both inputs and outputs may be expressed in either monetary terms or in physical
units. This characteristic is a significant advantage of this technique over others.
Unlike traditional methods based on ratios, in w h i c h t h e s e a r c h f o r o v e r a l l p e r f o r m a n c e evaluation measurements generally forces the a
priori establishment of weighting of outputs and
inputs, DEA models provide this measurement of overall efficiency without the need for establishing
a priori weights. In fact, it is the methodology itself
that assigns them, with the weighting employed for one DMU generally being different to that used for another.
As a consequence of the considerable amount of literature that has appeared on the subject (Seiford, 1995), various DEA models have been formulated, the most basic of which are described below.
The first model, initially proposed by Chames, Cooper and Rhodes (1978), is based on the ratios model, but with the particular characteristic that the weights assigned to the various outputs and inputs are not established a priori, but are determined by a lineal programme. Its mathematical formulation for the case of n inputs, m outputs and I DMUs analysed is as follows: Max y* r = \ n 1=1 m [12]
< 1 j = l,...,0,...,I
normalise t h e efficiency coefficient. This will therefore be less than or equal to 1, with the unit denoting the overall technical efficiency and values lower than this the amount of inefficiency.
As can be seen, [12] is not lineal, which makes its numerical resolution difficult. To solve this problem, it can be linealised by means of a simple transformation: Max £ u , yrl s.t [13 i=l
í ^ y ^ í v , ^ .
j =\,...,o,...j
r = l /=1 ur, v; > 0 r = l...m ; i = \...nThe formulation [13] of the CCR model is usually called the CCR ratio form, although it is much more common to use its dual program:
Min 6
s.t
t
i sr = yr0r
1\...m
[14] W=i J+ s~ = 0 x
iO i = 1.../J > 0 : l...m \...nwhere yr ]is the output r of the DMU j , the input i of
the DMU j , ur the weight assigned to the output r
and v the weight of input i.
This lineal programme is solved for each of the units analysed. The efficiency of the DMU analysed is defined as the ratio between the weighted sum of its outputs and the weighted sum of its inputs. However, these weightings are left free in order to maximise the efficiency of the unit analysed and, under this supposition, compare its performance with the rest of the units. The aim of these restrictions is forcing the efficiency ratios of the DMUs included in the analysis to be less than or equal in order to
s; >
0 ;
6e%
Note that as a consequence of the generally a c c e p t e d c h a r a c t e r i s t i c s of p r o d u c t i o n technologies, è cannot take a negative value as positive outputs cannot be obtained from a negative input vector or free production. On the other hand, because the objective function is of minimisation, the smallest value for è that fulfils the restriction will be obtained. In fact, what is intended is the s e a r c h for a lineal c o m b i n a t i o n of D M U s (or reference unit) that attains a greater or equal output levei to that of the DMU analysed, with an equal or lower consumption of inputs. This implies that, if such a lineal combination cannot be found, the DMU analysed will itself be obtained as a reference unit,
Artigos científicos 61
meaning that è will take the value of 1 at most, and therefore 0 e ( 0 , l ] .
The overall efficiency rate of the DMU analysed is t h u s p r o v i d e d by è. Its i n t e r p r e t a t i o n is the maximum by which consumption of ali its inputs can be reduced without changes in its mix. It is for this reason that this formulation of the problem is oriented towards inputs and it is a radial model.
H o w e v e r , a d d i t i o n a l d e c r e a s e s c a n be achieved in some inputs, by admitting changes in the input mix. The objectives established for inputs in t h i s c a s e w o u l d be g i v e n by t h e f o l l o w i n g expression, where the asterisks denote the optimum value of the variables:
0*x
iO-S7*
[151The objective for output r must be established as:
+*
[16]
At the s a m e t i m e , the C C R model o r i e n t e d towards outputs can be expressed in the following terms:
Max (j)
s.t
f i \ jy
UW
= 1 J [17] + j , = X;, i =1...
nÂ
0 ;<j>
€ 9 1In this case, too, owing to the characteristics of the production technology, the value of Õ will not be negative, as positive outputs cannot be obtained from a negative inputs vector or free production. On the other hand, because the objective function is of maximisation, the greatest value for /that fulfils the restriction will be o b t a i n e d . In fact, what is intended is the search for a lineal combination of DMUs that achieves an output levei greater than or equal to that of the DMU analysed, with an equal or lower consumption of inputs. This means that if such a lineal combination cannot be f o u n d , the D M U
analysed itself will be obtained as a reference unit, so that /will take have a value of 1 at most, therefore
<pe[\, + o o ) .
In this case, f must be interpreted as the increase that may be attained in ali the outputs without changes in its mix. Hence if a DMU can expand ali its outputs radially, í>1 will be obtained, and in the opposite case, / = 1 . In this case we are also faced with a radial model.
As occurs in the case of orienting the model t o w a r d s o u t p u t s , a d d i t i o n a l i n c r e a s e s c a n be obtained in some outputs, with changes admitted in the output mix as compensation. The objective that should be established for output r in this case would be given by the following expression:
fy
r0+ sr
while the objective for input / should be established as:
XÍO $i
[19]
4 Application of DEA
Models to the modern
restaurant industry
In this section, model [17] is applied to the case of 16 restaurants belonging to an important Spanish chain in the modern restaurant industry. Only one of the models defined theoretically in the previous s e c t i o n is c h o s e n , as a c o n s e q u e n c e of t h e similarities of the results that they ali provide. Moreover, by only applying one of them, the reader will a p p r e c i a t e the kind of results that c a n be o b t a i n e d f r o m t h i s t y p e of m o d e l a n d its interpretation more easily. T h e output-oriented m o d e l [ 1 7 ] h a s b e e n c h o s e n b e c a u s e it is c o n s i d e r e d to be the most a p p r o p r i a t e for the prevailing business conditions as it priorises the maximisation of outputs based on the available inputs.
The application of any DEA model requires a prior definition of the inputs and outputs to be used in the analysis. Its selection must, in practice, be agreed upon by the evaluator and preferably also with the units evaluated. In our example, annual sales (SALES), expressed in millions of euros and a quality rating of between 1 and 100 (QUALITY), based on the results of internai audits, the mystery shopper and client surveys, have been included as outputs. Ali the restaurants analysed apply the
62
RT&D,
same prices, since they belong to a local chain. So, efficiency can not be improved by making each restaurant its own decisions on product prices. Regarding the quality variable, one could wonder if perceived quality measures based on customers surveys should be used. In fact, two restaurants with the same "objective" quality (technical quality) could obtain different scores depending on its customers point of view. However, our opinion is that perceived quality has a greater effect in total sales than objective quality. Consequently, ali restaurants should effort to achieve the greater leveis of perceived quality to increase their sales. Four components as inputs have been selected for each restaurant: the square metres of the business premises (M2); its location (LOC) valued in a range
from 1 to 100 (the reason for including this variable is to consider environmental factors that may increase efficiency); staff costs (STAFF); and total food costs (FCOST). Due to purchasing process is centralised, raw materiais are also bought at the same prices for ali restaurants. AM data were provided directly by the chain managers and refers
to 1999. Owing to the fact that headquarters do not allocate advertising expenditures to each store, it made no sense to consider this variable. Detailed data is found in Table 1.
It must be pointed out that ali the results exposed below refer to the long-run, since changes in the fixed inputs are allowed in the evaluation (location and restaurant size). Now, we look at the results obtained. The overall efficiency coefficients (/) obtained by applying model [17] to the restaurants in the sample are shown in Table 2.
If coefficient fis equal to 1.00, it means that the unit is efficient. When it is greater than 1.00, the unit should be interpreted as being inefficient, and the higherthis value, the greater the inefficiency of the unit. The additional interpretation that can be made of a value greater than 1.00 for this coefficient is the minimum increase that can be achieved in ali the outputs simultaneously, i.e. without changes in the output mix. Hence the greater it is, the less efficient is the unit analysed. For example, in the case of restaurant 11, its efficiency coefficient is 1.109. This means that ali its outputs may be Tabie 1 - Inputs and outputs utilised
OUTPUTS j INTPUTS
RESTAURANT SALES QUALITY M2 LOC STAFF FCOST
# € (0-100) (0-100) € € 1 552,931 72 180 60 171,409 163,115 2 877,478 68 220 75 280,793 263,243 3 522,881 59 175 45 146,407 159,479 4 901,518 69 280 62 315,531 279,471 5 1,622,733 59 360 95 535,502 490,065 6 721,215 71 178 92 238,001 214,922 7 691,164 82 186 82 221,172 206,658 8 607,022 71 160 89 182,107 188,177 9 588,992 68 189 65 200,257 194,367 10 1,346,267 81 195 76 457,731 399,841 11 1,177,984 52 236 84 353,395 380,489 12 943,589 68 290 79 273,641 283,077 13 588,992 79 199 87 182,588 172,575 14 619,042 51 173 82 198,093 182,617 15 667,123 78 213 70 220,151 205,474 16 1,009,700 81 247 55 333,201 314,017 Source: author
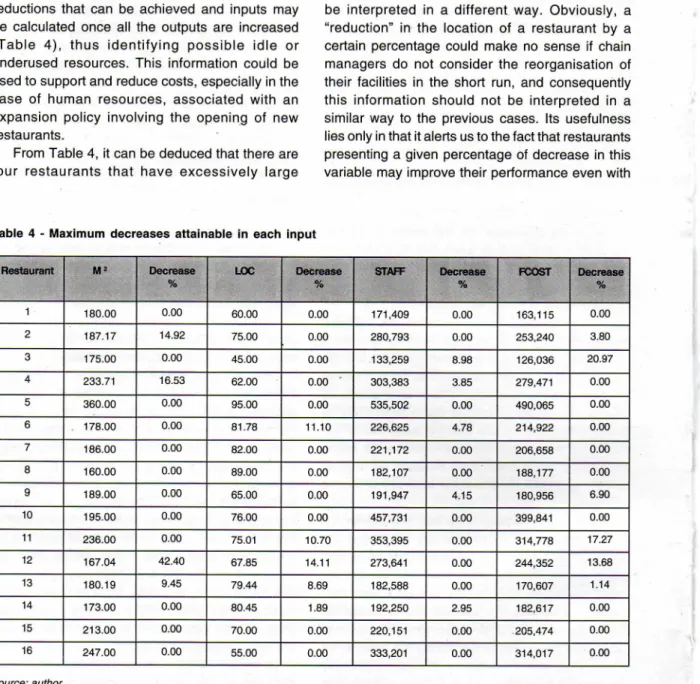
Table 2 - Efficiency scores
Restaurant Efficiency
coefficient % Outputs increase
1 1.000 0.00 2 1.158 15.77 3 1.039 3.93 4 1.186 18.63 5 1.000 0.00 6 1.093 9.32 7 1.000 0.00 8 1.000 0.00 9 1.121 12.12 10 1.000 0.00 11 1.109 10.89 12 1.041 4.05 13 1.006 0.55 14 1.460 45.96 15 1.049 4.91 16 1.000 0.00 Source: author
multiplied by this value, i.e. increased by 10.9%. An output model was selected due to chain managers interest in establishing improvement goals for sales.
Table 2 shows that only restaurants 1, 5, 7, 10, and 16 are totally efficient - ali have a coefficient equal to 1.00. The rest are inefficient, with restaurant 14 being the most inefficient, for it is the one that could at least increase ali its outputs by the largest amount (almost 46%, to be precise), as can be seen in the column of the table entitled "% outputs increase". It can also be seen that of the inefficient restaurants, the best is number 13, owing to the fact that it could only increase its outputs radially by 0.55%. The average inefficiency overall is 11.5%.
Identifying business units that are efficient in overall terms and those that are not has many applications. Firstly, it enables the best restaurant managers to be identified, which facilitates the implementation of a policy whereby they can transfer between the various establishments. Secondly, internai audits of the efficient units may be carried out, aimed at identifying the reasons for their operational superiority and subsequently emulate them in the inefficient units. Finally, it is
Table 3 - Maximum increases attainable in each output
Restaurant Sales (€) Increase
% Quality Increase % 1 552931 0.00 72.00 0.00 2 1015831 15.77 78.72 15.77 3 659971 26.22 61.32 3.93 4 1123232 24.59 81.85 18.63 5 1622733 0.00 59.00 0.00 6 788468 9.32 77.62 9.32 7 691164 0.00 82.00 0.00 8 607022 0.00 71.00 0.00 9 660392 12.12 76.24 12.12 10 1346267 0.00 81.00 0.00 11 1306240 10.89 64.12 23.31 12 981813 4.05 70.75 4.05 13 669588 13.68 79.44 0.55 14 903501 45.96 74.44 45.96 15 873210 30.89 81.83 4.91 16 1009700 0.00 81,00 0.00 Source: author
very useful information for the implementation of an incentives system for business unit managers. Although f shows the levei to which increase ali the outputs may be increased without varying the input mix, additional increases could be reached in some outputs. The maximum increases attainable in each, calculated according to expression [18], are depicted in Table 3.
The second and fourth columns of Table 3 show sales and quality objectives respectively. Both are expressed in absolute terms, as well as their variation percentage compared to the values currently seen in the third and fifth columns. There are restaurants in which the variation percentage is the same for both outputs, as is the case for restaurant 2, which is the same, as one would expect, as the maximum radial increase shown in Table 2. For instance, in the case of re§taurant 3 where the coefficients differ, sales could be increased by 26.22% and quality by 3.93%. The maximum radial increase for this restaurant is exactly 3.93% (Table 2), i.e. it is the same as the lesser of the increases individually achievable in the outputs shown in Table 3.
It should be pointed out that the information provided in Table 3 is very useful since enables
specific sales and quality objectives to be established, calculated on the basis of benchmarking of its own business units. He/she can also decide whether to establish these objectives on a radial or individual basis. It would surely be more suitable to use the radial increase coefficient for those outputs related to product sales or real services, given that the difficulty of changing the sales mix is usually a feature of the modem restaurant industry. However, personalised coefficients would be more appropriate when there are no difficulties in changing the mix of sales, or when dealing with special outputs, such as quality or any positive externai feature.
Finally, as is shown in formula [19], additional reductions that can be achieved and inputs may be calculated once ali the outputs are increased (Table 4), thus identifying possible idle or underused resources. This information could be used to support and reduce costs, especially in the case of human resources, associated with an expansion policy involving the opening of new restaurants.
From Table 4, it can be deduced that there are four restaurants that have excessively large
facilities, i.e. numbers 2, 12, 13 and 14. Of these, number 12 is the most over-sized, as it could operate with premises up to 42.40% smaller. In the other three cases, the excess space does not surpass 17%. Staff costs are demonstrated to have the narrowest margin, with five restaurants -numbers 3, 4, 6, 9 and 14 - having an excess of costs, which is not very high, at around 4% of sales on average (apart from restaurant 3, at around 9%). With regard to consumption, there are six restaurants where this could be reduced - numbers 2, 3, 9,11, 12 and 13. The restaurants that present the greatest imbalance in this aspect are numbers 3 (20.97%), 11 (17.27%) and 12 (13.68%).
The environmental input location results must be interpreted in a different way. Obviously, a "reduction" in the location of a restaurant by a certain percentage could make no sense if chain managers do not consider the reorganisation of their facilities in the short run, and consequently this information should not be interpreted in a similar way to the previous cases. Its usefulness lies only in that it alerts us to the fact that restaurants presenting a given percentage of decrease in this variable may improve their performance even with
Table 4 - Maximum decreases attainable in each input Restaurant M" Decrease % LOC Decrease % STAFF Decrease % FCOST Decrease % 1 180.00 0.00 60.00 0.00 171,409 0.00 163,115 0.00 2 187.17 14.92 75.00 0.00 280,793 0.00 253,240 3.80 3 175.00 0.00 45.00 0.00 133,259 8.98 126,036 20.97 4 233.71 16.53 62.00 0.00 ' 303,383 3.85 279,471 0.00 5 360.00 0.00 95.00 0.00 535,502 0.00 490,065 0.00 6 178.00 0.00 81.78 11.10 226,625 4.78 214,922 0.00 7 186.00 0.00 82.00 0.00 221,172 0.00 206,658 0.00 8 160.00 0.00 89.00 0.00 182,107 0.00 188,177 0.00 9 189.00 0.00 65.00 0.00 191,947 4.15 180,956 6.90 10 195.00 0.00 76.00 0.00 457,731 0.00 399,841 0.00 11 236.00 0.00 75.01 10.70 353,395 0.00 314,778 17.27 12 167.04 42.40 67.85 14.11 273,641 0.00 244,352 13.68 13 180.19 9.45 79.44 8.69 182,588 0.00 170,607 1.14 14 173.00 0.00 80.45 1.89 192,250 2.95 182,617 0.00 15 213.00 0.00 70.00 0.00 220,151 0.00 205,474 0.00 16 247.00 0.00 55.00 0.00 333,201 0.00 314,017 0.00 Source: author
Rim
T a b l e 5 - E s t i m a t i o n of improvement in potential results
Restauram SALES1 € SALES2C Var.€ STAFF1C STAFF2C Var.€ FCOST1 € FCOST2 € Var.C Var. Resulte 1 552,931 552,931 0 171,409 171,409 0 163,115 163,115 0 0 2 877,478 1,015,831 138,353 280,793 280,793 0 263,243 253,240 10,003 148,356 3 522,881 659,971 137,090 146,407 133,259 13,148 159,479 126,036 33,443 183,681 4 901,518 1,123,232 221,714 315,531 303,383 12,148 279,471 279,471 0 233,862 5 1622,733 1,622,733 0 535,502 535,502 0 490,065 490,065 0 0 6 721,215 788,468 67,253 238,001 226,625 11,376 214,922 214,922 0 78,629 7 691,164 691,164 0 221,172 221,172 0 206,658 206,658 0 0 8 607,022 607,022 0 182,107 182,107 0 188,177 188,177 0 0 9 588,992 660,392 71,400 200,257 191,947 8,310 194,367 180,956 13,411 93,121 10 1346,267 1,346,267 0 457,731 457,731 0 399,841 399,841 0 0 11 1,177,984 1,306,240 128,256 353,395 353,395 0 380,489 314,778 65,711 193,967 12 943,589 981,813 38,224 273,641 273,641 0 283,077 244,352 38,725 76,949 13 588,992 669,588 80,596 182,588 182,588 0 172,575 170,607 1,968 82,564 14 619,042 903,501 284,459 198,093 192,250 5,843 182,617 182,617 0 290,302 15 667,123 873,210 206,087 220,151 220,151 0 205,474 205,474 0 206,087 16 1,009,700 1,009,700 0 333,201 333,201 0 314,017 314,017 0 0 TOTALS 1,373,432 50,825 163,261 1,587,518 Source: author
a location worse than the one they currently have, meaning that it may be deduced that they are underusing it.
Finally, it is interesting to reflect on the suggestions provided by applying the DEA model, related to the variations in inputs and outputs in an estimation of the variation of the result that could be achieved in the optimistic scenario of attaining them exactly in reality. The projection of the potential improvement in results, supposing that efficiency is improved, is shown in Table 5.
This table shows the variations in the three variables that directly affect the calculation of economic results, i.e. sales, staff costs and consumption. The model application shows that a potential increase in sales of €1,373,432 could be achieved for the total of the 16 restaurants, while the savings derived from staff costs are €50,825 and those associated with consumption are €163,261. This would add up to an estimated improvement in the overall result of €1,587,518 if the restaurants were able to remove ali their inefficiencies. However, it should not be forgotten that this value must be corrected by incorporating other costs not included in this study that would probably be associated with the increase in sales.
5 Conclusions
The aim of this article has been to present a rigorous methodology called Data Envelopment Analysis (DEA) or analysing the operational efficiency of a set of business units. This methodology is applicable to a wide range of organisations that operate through business units, such as hotel and restaurant chains or bank offices. The technique is characterised by offering a single coefficient that providès an overall evaluation of the efficiency of each of the units analysed. This index allows a distinction to be made between those units that have been efficient and those that have not, as well as quantifying their inefficiency. DEA models also determine the leveis that inputs and outputs should reach to become efficient. This makes them a highly suitable and useful tool not only for the follow-up and evaluation of business units, but also for establishing objectives that lead to greater operational efficiency, which is essential in any highly competitive environment. DEA models undertake a comparative analysis of the inputs and outputs of the production process carried out by the business
66
units evaluated, using a benchmarking process to identify the best management practices.
Their empirical application was carried out on a sample of 16 restaurants belonging to a leading Spanish restaurant chain. The outputs used were the sales expressed in monetary terms and an Índex indicating the quality attained by each restaurant. In the inputs section, the surface area of the business premises, its location, staff costs and consumption were used. The results of the application made olear that only five restaurants were efficient in overall terms. Average inefficiency was calculated as 11.5%. In addition, the model provided the output increase and input reduction objectives that the inefficient restaurants should achieve in order to remedy their situation. On the basis of these figures, it was possible to estimate that an improvement of approximately €1,200,000 in the results could be achieved by correcting the inefficiencies. From Table 5 it can easily be deduced that inefficiencies are more a result of low sales than high costs. Restaurant 14 is the least efficient, demonstrating an attainable result increase of around €300,000. Information provided by frontier models are very useful for managers since they can easily take into account environmental factors influencing restaurants performance or service quality achieved. Setting improvement targets based on a chain's own know-how is also easy with this technique as a result of an internai benchmarking process. There is no doubt that this study clearly demonstrates the advantages of frontier models over other techniques, such as ratios, generally used in business practice. There are five drawbacks to the ratios technique that should be highlighted: 1) they provide only partial productivity measures instead of evaluating the overall performance of organizations; 2) it is difficult to set objective improvement targets; 3) they do not consider relationships between variables; 4) they do not take into account environmental factors such as location or social-demographic characteristics that affect performance; and 5) they assume constant returns to scale technologies when comparing different decision-making units. In contrast, frontier models overcome ali these defects, as has been demonstrated in the case study.
Finally, it should be highlighted that DEA models could also be very useful for the case of sales targeting in the opening of new restaurants. Sales targets could easily be estimated by introducing the new establishment to be opened in
the sample with the known inputs data and a unitary value for each output. In this way, DEA models would provide the output leveis (sales and quality in this case) that should be reached in order to make the restaurant efficient, taking into account its available inputs.
R e f e r e n c e s A n d e r s e n , P. & P e t e r s e n , N . C . ( 1 9 9 3 ) A p r o c e d u r e f o r r a n k i n g e f f i c i e n t u n i t s in d a t a e n v e l o p m e n t a n a l y s i s . Management Science, 3 9 ( 1 0 ) , 1 2 6 1 - 1 2 6 4 . A n d e r s o n , R . I . , F i s h , M . , X i a , Y . & M i c h e l l o , F. ( 1 9 9 9 ) M e a s u r i n g e f f i c i e n c y i n t h e h o t e l i n d u s t r y : a s t o c h a s t i c f r o n t i e r a p p r o a c h . International Journal of Hospitality Management, 1 8 , 4 5 - 5 7 . A t h a n a s s o p o u l o s , A . & S h a l e , E. ( 1 9 9 7 ) A s s e s s i n g t h e c o m p a r a t i v e e f f i c i e n c y of h i g h e r e d u c a t i o n i n s t i t u t i o n s in t h e U K b y m e a n s of D a t a E n v e l o p m e n t A n a l y s i s . Education Economics, 5 ( 2 ) , 1 1 7 - 1 3 4 . B a l l , S . D . , J o h n s o n , K & S l a t t e r y , P. ( 1 9 8 6 ) L a b o u r p r o d u c t i v i t y i n h o t é i s . International Journal of Hospitality Management, 5 ( 3 ) , 1 4 1 - 1 4 7 . B a n k e r , R . D . , C h a m e s , A . & C o o p e r , W . W . ( 1 9 8 4 ) S o m e m o d e l s f o r e s t i m a t i n g t e c h n i c a l a n d s c a l e i n e f f i c i e n c i e s i n d a t a e n v e l o p m e n t a n a l y s i s . Management Science, 3 0 ( 9 ) , 1 0 7 8 - 1 0 9 2 . B a n k e r R. D. & M o r e y , R. ( 1 9 8 6 ) T h e u s e of c a t e g o r i c a l v a r i a b l e s in d a t a e n v e l o p m e n t a n a l y s i s . Management Science, 3 2 ( 1 2 ) , 1 6 1 3 - 1 6 2 7 . B e a s l e y , J . E. ( 1 9 9 0 ) C o m p a r i n g u n i v e r s i t y d e p a r t m e n t s . Omega, 1 8 ( 2 ) , 1 7 1 - 1 8 3 . B u t t e r f i e l d , R . W . ( 1 9 8 7 ) A q u a l i t y s t r a t e g y f o r s e r v i c e o r g a n i z a t i o n s . Quality Progress, D e c e m b e r , 4 0 - 4 2 . C h a m e s , A . , C o o p e r , W . & R o d h e s , E. ( 1 9 7 8 ) M e a s u r i n g t h e e f f i c i e n c y o f d e c i s i o n m a k i n g u n i t s . European
Journal of Operational Research, 2 ( 6 ) , 4 2 9 - 4 4 4 .
C h a m e s , A . , C o o p e r , W . , L e w i n , A . & S e i f o r d , L M . ( 1 9 9 3 )
Data envelopment analysis. Theory, methodology and applications. M a s s a c h u s e t t s : K l u w e r A c a d e m i c P u b l i s h e r s . D e b o r g e r , B., F e r r i e r , G . & K e r s t e n s , K ( 1 9 9 8 ) T h e c h o i c e of a t e c h n o l o g i c a l e f f i c i e n c y m e a s u r e o n t h e f r e e d i s p o s a l h u l l r e f e r e n c e t e c h n o l o g y : a c o m p a r i s o n u s i n g U S b a n k i n g d a t a . European Journal of Operational Research, 1 0 5 , 4 2 7 - 4 4 6 . D e b r e u , G . ( 1 9 5 1 ) T h e c o e f f i c i e n t of r e s o u r c e u t i l i z a t i o n . Econométrica, 1 9 ( 3 ) , 2 7 3 - 2 9 2 .
Artigos científicos
F a r r e l l , M . J . ( 1 9 5 7 ) T h e m e a s u r e m e n t of p r o d u c t i v e e f f i c i e n c y . Journal of the Royai Statistical Society
Series A, 1 2 0 ( 3 ) , 2 5 3 - 2 8 1 .
J o n e s , P. ( 1 9 8 8 ) Q u a l i t y , c a p a c i t y a n d p r o d u c t i v i t y in s e r v i c e i n d u s t r i e s . International Journal olHospitality
Management, 7 ( 2 ) , 1 0 4 - 1 1 2 .
K a p l a n , R . S . ( 1 9 9 0 ) L i m i t a t i o n s of c o s t a c c o u n t i n g in a d v a n c e d m a n u f a c t u r i n g e n v i r o n m e n t s . I n R . S . K a p l a n . ( E d . ) Measures for manufacturing
excellence, B o s t o n : H a r v a r d B u s i n e s s S c h o o l P r e s s .
K a p l a n , R . S . & N o r t o n , D . P . ( 1 9 9 6 ) The balanced
scorecard: translating strategy into action. B o s t o n :
H a r v a r d B u s i n e s s S c h o o l P r e s s .
K o o p m a n s , T . C . ( 1 9 5 1 ) A n A n a l y s i s of P r o d u c t i o n a s a n E f f i c i e n t C o m b i n a t i o n of A c t i v i t i e s . In T . C . K o o p m a n s ( E d . ) Activity Analysis of Production and Allocation. C o w e l l s C o m m i s s i o n f o r R e s e a r c h in E c o n o m i c s , M o n o g r a p h N o . 1 3 , N e w Y o r k : J o h n W i l e y a n d S o n s , I n c .
L o v e l l , C . A . K . ( 1 9 9 3 ) P r o d u c t i o n F r o n t i e r s a n d P r o d u c t i v e E f f i c i e n c y . In H . O . F r i e d , C . A . K L o v e l l & S . S . S c h m i d t ( E d s . ) The measurement of productive efficiency, N e w Y o r k : O x f o r d U n i v e r s i t y P r e s s .
L o z a n o - V i v a s , A . , P a s t o r J . T . & H a s a n , I ( 2 0 0 1 ) E u r o p e a n b a n k p e r f o r m a n c e b e y o n d c o u n t r y b o r d e r s : w h a t r e a l l y m a t t e r s ? European Finance Review, 5 , 1 4 1 -1 6 5 .
M o r e y , R . C . & D i t t m a n D.A. ( 1 9 9 5 ) E v a l u a t i n g a h o t e l G M ' s p e r f o r m a n c e . Cornell Hotel and Restaurant
Administration Quarterly, 3 6 ( 4 ) , 3 0 - 3 5 .
M o r e y , R . C . & D i t t m a n , D.A. ( 1 9 9 7 ) A n a i d in s e l e c t i n g t h e b r a n d , s i z e a n d o t h e r s t r a t e g i c c h o i c e s f o r a h o t e l .
Journal of Hospitality and Tourism Research, 2 1 ( 1 ) ,
7 1 - 9 9 .
M e s s e n g e r , S . J . & M u g o m e z a , C . ( 1 9 9 5 ) A n e x p l o r a t o r y s t u d y of p r o d u c t i v i t y a n d p e r f o r m a n c e m e a s u r e m e n t i n z i m b a b w e a n h o t é i s . International Journal of
Contemporary Hospitality Management, 7 ( 5 ) , v - v i i .
P e d r a j a - C h a p a r r o , F., S a l i n a s - J i m e n e z , J . & S m i t h , P. ( 1 9 9 9 ) O n t h e q u a l i t y o f t h e d a t a e n v e l o p m e n t a n a l y s i s m o d e l . Journal of Operational Research
Society, 5 0 , 6 3 6 - 6 4 4 .
S c h r o e d e r , R . G . ( 1 9 8 5 ) Operations management:
decision making in the operations function, N e w Y o r k :
M c G r a w - H i l l .
S e i f o r d , L M . ( 1 9 9 5 ) A D E A b i b l i o g r a p h y ( 1 9 7 8 - 1 9 9 4 ) . In A . C h a m e s , W . W . C o o p e r , A . Y . L e w i n & L . M . S e i f o r d ( E d s . ) Data envelopment analysis: theory,
methodology and applications, B o s t o n : K l u w e r
P u b l i s h e r s .
S h e r m a n , D. ( 1 9 8 4 ) D E A a s a n e w m a n a g e r i a l a u d i t m e t h o d o l o g y - t e s t a n d e v a l u a t i o n . Auditing: A Journal
of Practice and Theory, 4 ( 1 ) , 3 5 - 5 3 .
S t i g l e r , G . J . ( 1 9 7 6 ) T h e e x i s t e n c e o f X - e f f i c e n c y .
American Economic Review, 6 5 , 2 1 3 - 2 1 6 .
T h a n a s s o u l i s , E., B o u s s o f i a n e , A . & D y s o n , R . G . ( 1 9 9 6 ) A c o m p a r i s o n of d a t a e n v e l o p m e n t a n a l y s i s a n d ratio a n a l y s i s a s t o o l s f o r p e r f o r m a n c e a n a l y s i s . Omega, 2 4 ( 3 ) , 2 2 9 - 2 4 4 . T h a n a s s o u l i s , E. & D y s o n , R . G . ( 1 9 9 2 ) E s t i m a t i n g p r e f e r r e d t a r g e t i n p u t - o u t p u t l e v e i s u s i n g d a t a e n v e l o p m e n t a n a l y s i s . European Journal of Operational Research, 5 6 , 8 0 - 9 7 . W a g s t a f f , A . ( 1 9 8 9 ) E s t i m a t i n g e f f i c i e n c y in t h e h o s p i t a l s e c t o r : a c o m p a r i s o n of t h r e e s t a t i s t i c a l c o s t f r o n t i e r s m o d e l s . Applied Economics, 2 1 , 6 5 9 - 6 7 2 .
W i t t , S . F . & M o u t i n h o , L. ( 1 9 9 4 ) Tourism marketing and