Acta Scientiarum
http://www.uem.br/acta ISSN printed: 1806-2636 ISSN on-line: 1807-8672
Doi: 10.4025/actascianimsci.v37i2.25355
Effect of age of dam on weight of calf in the genetic assessment of
Zebu cattle in random regression models
Jorge Luís Ferreira1*, Fernando Brito Lopes2, Tiago Bresolin3, José Américo Soares Garcia4,
Silvia Minharro1 and Raysildo Barbosa Lôbo5
1
Universidade Federal do Tocantins, Rua Paraguai, s/n, 77838-824, Campus de Araguaína, Araguaína, Tocantins, Brazil. 2
College of Agricultural and Life Sciences, University of Wisconsin, Madison, USA. 3
Universidade Estadual Paulista “Julio de Mesquita Filho”, Jaboticabal, São Paulo, Brazil. 4
Universidade de Brasília, Brasília, Distrito Federal, Brazil. 5
Associação Nacional de Criadores e Pesquisadores, Ribeirão Preto, São Paulo, Brazil. *Author for correspondece. E-mail: jlferreira@uft.edu.br
ABSTRACT. Current analysis estimated co-variance components and genetic parameters for growth traits by random regression models taking into consideration the cow’s age on the weight of calves. Genealogical data and records on weights of male and female Zebu cattle, born between 1993 and 2011, were provided by the National Association of Breeders and Researchers (ANCP). Different models were compared by Akaike and Bayesian criteria. Legendre’s orthogonal polynomials were used to model the direct and maternal genetic effects of maternal and animal permanent environmental effects. Joint modeling of cow age at the moment their progenies were weighed resulted in more accurate estimates of co-variance components and genetics parameters. Co-variance functions of the cow age retrieved the dam effect on real performance of the progenies, reduced biases, improved parameter estimates and predicted breeding rates.
Keywords: co-variance, genetics parameters, progenies, weight, Zebu.
Efeito da idade da vaca à pesagem da progênie na avaliação genética de bovinos Guzerá
em modelos de regressão aleatória
RESUMO. Objetivou-se com o presente trabalho estimar componentes de (co)variância e parâmetros genéticos de características de crescimento por meio de modelos de regressão aleatória considerando a idade da vaca no momento da pesagem de sua respectiva progênie. As informações foram utilizadas de genealogia e registros de pesagem de bovinos machos e fêmeas da raça Guzerá, provenientes da Associação Nacional de Criadores e Pesquisadores (ANCP), nascidos entre 1993 e 2011. Os diferentes modelos foram comparados pelo critério de informação de Akaike e o critério de informação Bayesiano de Schwarz. Utilizaram-se polinômios ortogonais de Legendre para modelar os efeitos genéticos aditivos diretos e maternal, de ambiente permanente do animal e maternal. A modelagem conjunta do efeito da idade do animal e idade da vaca no momento em que suas progênies foram pesadas resultou em estimativas de componentes de (co)variâncias e parâmetros genéticos mais precisos. A função de (co)variâncias da idade da vaca permitiu capturar o efeito que a idade da vaca apresenta sobre o desempenho fenotípico de sua progênie, reduzindo o viés e auxiliando na estimação de parâmetros e predições de valores genéticos mais confiáveis.
Palavras-chave: (co)variância, parâmetros genéticos, progênies, peso, Zebu.
Introduction
Co-variance components and genetic parameters of beef cattle have been estimated in Brazilian genetic improvement programs by weights calculated at the standard age, such as weight at 210 days (P210), 365 days (P365) and 450 days old (P450). Assessments were efficient since the processes using the methodology were effective (Albuquerque & Meyer, 2005; Ferraz & Eler, 2010; Valente et al., 2008).
Random regression models have been employed recently as an alternative tool for the modeling of traits measured several times during the animal’s life and which change gradually and continually
throughout the period (Dias et al., 2006; Freitas et al., 2010; Meyer, 2004). The application of random regression models for growth characteristics in cattle estimates parameters and predicts genetic rates for any age. It even includes the age in which the weight of the animal had not been measured (Meyer, 2004).
age would produce a genetic progress in all growth phases.
Fixed effects in studies with regression models reveal the growth trends of average body weight of the population, as a function of age. However, different average growth trajectories may occur due to sexual physiological differences (males and females) (Albuquerque & El Faro, 2008; Biassus et al., 2011; Valente et al., 2008).
Moreover, research which involves longitudinal data in random regression methodology taking into account the co-variable age of the Zebu cow at birth and at the moment in which the weight of the calf is measured is just fledging.
The age of the Zebu cow is modeled according to weight, coupled to the gradual and progressive effect that age may have on the development of the calves. Current research estimates the components of co-variance and genetic parameters for growth characteristics by random regression models taking the joint effect of age of the animal and the age of the dam at the instance in which the calf is weighed.
Material and methods
Data were retrieved from the records of the Brazilian Association of Breeders and Researchers (ANCP) on the genealogy and weight registers of Zebu cattle, males and females, born between 1993 and 2011, and bred in the Brazilian states of São Paulo, Mato Grosso do Sul, Mato Grosso, Goiás, Tocantins, Pará and Rondônia.
The contemporary group (CG) was determined from the concatenation of sources of environmental variations such as season of birth, year of birth, management group, gender and farm, with date of weighing common in the management group. For better consistency, only CG with at least four animals and bulls with at least three offspring were maintained on the file. Work file comprised 3,977 calves from 737 bulls and 1,931 cows, with CG 820. Parenthood matrix included 8,344 animals of all available generations. Table 1 gives a summary of the structure of the data.
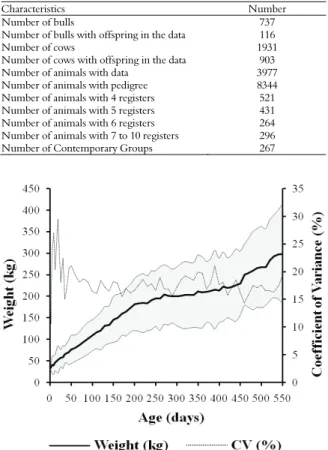
The model took into account CGs as a fixed effect and the age of the cow on weighing of calf and age of animal (both modeled by Legendre’s polynomial) as co-variables; it also took into account as randomized the direct and maternal additive genetic effect, permanent environment of the animal, maternal and residual. The heteroscedastic model was employed with a residue partitioned into 7 age brackets: 1-56; 57-147; 148-218; 219-259; 260-301; 302-372 and 373-550 days of age. The seven age
brackets were due to the variability of weights throughout the animal’s life (Figure 1). Internal homogeneous groups were thus obtained from the above age brackets.
Table 1. Structure of data file.
Characteristics Number
Number of bulls 737
Number of bulls with offspring in the data 116
Number of cows 1931
Number of cows with offspring in the data 903
Number of animals with data 3977
Number of animals with pedigree 8344 Number of animals with 4 registers 521 Number of animals with 5 registers 431 Number of animals with 6 registers 264 Number of animals with 7 to 10 registers 296 Number of Contemporary Groups 267
Figure 1. Distribution of average weight, at 95% confidence interval, and variation of weights according to age of Zebu cattle.
Legendre’s orthogonal polynomial model was employed for age at the weighing of animals to model the population’s average curve. Complete model runs as follows:
= + + +
−1
=0 −1
=0
+ +
−1
=0 −1
=0
+ +
−1
=0
in which:
yij = i-th measured by j-th animal; EF= set of
fixed effect; bm= fixed coefficient of regression to
model the mean curve of the population; m(ti) =
function of Legendre’s polynomial regression that describes the mean curve of the population according to the age of the animal; m(tij) = functions
Genetic evaluation of Zebu cattle by orthogonal Legendre polynomials 205
the curves of each animal j, according to age (ti), for the random genetic additive and maternal effects, permanent environment of animals and maternal; αjm,
γjm, δjm, ρjm= random genetic additive direct regression
and maternal coefficients, of permanent environment of animal and maternal, respectively for each animal; kb, kA, kM, kCe kQ = order of Legendre’s polynomials of
effects included in the model; eij = random error
associated to each age i of animal j, with N~(0, σ²). The different models were compared by Akiake’s information criterion AIC (Akaike, 1974) and by Schwarz’s Bayesian information criterion BIC (Schwarz, 1978). These criteria compared non-adjusted models and shunned more parametric models. BIC criterion is stricter with more parametric models (Sousa et al., 2008; Tholon & Queiroz, 2008). Models of better adjustments were considered those with the lowest AIC and BIC rates, determined by:
AIC= -2logL + 2p
BIC= -2logL + k x p
where:
logL is the rate of the natural logarithm of maximum likelihood function, p is the number of the parameters of the model, k is a constant equal to the logarithm of the number of observations (n).
The components of co-variances were estimated by restricted maximum likelihood method with program Wombat (Meyer, 2007). Legendre’s orthogonal polynomials were used to model the genetic additive direct and maternal effects, of the permanent environment of the animal and dam. Fifteen models were tested (Table 2) whose adjustment order varied from the first to the sixth order.
The following components of variance were estimated: genetic additive direct variance σa2;
genetic additive maternal variance σm2; genetic
co-variance between direct and maternal effects σam;
variance due to permanent environmental effects
2 ep
σ ; residual variance σe2. The following genetic
parameters could be estimated through these components of co-variances: direct heritability
( 2
2 2
p a a h
σ σ
= ); maternal heritability
(
22 2
p m a h
σ σ
= ),
genetic co-relationship between direct and maternal
effects (ram); total heritability
(
)
2 2 2
2 0,5 1,5
p am m
a T h
σ σ σ
σ + +
= ; and phenotypic variance
2 2
2 2
e am m a
p σ σ σ σ
σ = + + + .
Trends for weights, coefficient of variation, instantaneous growth rate, variances due to genetic additive direct effects, permanent phenotype and environment of the animal, and estimates of heritability were obtained by the regression of each parameter as a function of the animal’s age.
Results and discussion
The model that best fits to data had a fourth order coefficient for the genetic additive direct and maternal effects and a sixth order for the maternal permanent environmental effects (Table 2). AIC and BIC interpretation basically occurs by the greatness of its estimates which, for the selection of the best model, should present the lowest rates, as observed in model M4466.
The eigenvalue percentages for each polynomial order in model M4466 explained the variances since the intercept had the highest estimate of associated variance only in the direct genetic effect.
Table 2. Polynomial order for direct (ka) and maternal genetic effects (km), animal (kp) and maternal permanent environment (kc),
number of parameters (NP); logarithm of likelihood function (Log); Akaike information criterion (AIC) and Bayesian information criterion of Schwarz (BIC), for the random regression models for Zebu cattle.
Model ka km kp kc Het. NP Log(L) AIC BIC
M3311 3 3 1 1 7 21 -25,192.74 50,427.49 50,492.47
M3322 3 3 2 2 7 25 -25,232.71 50,515.42 50,592.77
M3333 3 3 3 3 7 31 -25,153.10 50,368.21 50,464.13
M4253 4 2 5 3 7 41 -25,352.38 50,786.76 50,913.62
M4353 4 3 5 3 7 44 -46,675.44 93,438.89 93,575.03
M4422 4 4 2 2 7 33 -25,175.03 50,416.06 50,518.17
M4433 4 4 3 3 7 39 -25,261.29 50,600.59 50,721.26
M4453 4 4 5 3 7 48 -24,974.73 50,045.46 50,193.97
M4454 4 4 5 4 7 52 -24,974.75 50,053.51 50,214.40
M4464 4 4 6 4 7 58 -25,197.96 50,511.92 50,691.38
M4465 4 4 6 5 7 63 -24,968.28 50,062.56 50,257.49
M4466 4 4 6 6 7 69 -24,880.39 49,898.79 50,112.28
M4533 4 5 3 3 7 44 -25,096.46 50,280.92 50,417.06
M4544 4 5 4 4 7 52 -25,143.44 50,390.88 50,551.78
However, eigenvalues remained close to zero in the estimates of maternal variance, variance of the animal and maternal permanent environment, as the polynomials increased in order.
The co-relationships between the intercept and the coefficient of linear regression were high and positive for the genetic effects direct additive (0.59), maternal (0.95) and permanent environment of animal (0.86). However, the co-relationship between the intercept and the coefficient of linear regression was low (0.23) for the effect of maternal permanent environment.
Employing birth weight on the 630th day of
birth for Nellore cattle, Albuquerque and Meyer (2001) reported high and positive co-relationships between the intercept and the coefficient of linear regression for all random effects. Likewise, Dias et al. (2006) also estimated positive and high co-relationships between the intercept and the coefficient of linear regression for all random effects, employing information on birth weight after 550 days of birth in Tabapuã cattle breed.
Estimates of genetic variance direct, maternal and animal and maternal permanent environment increased as the animals grew older. However, in the case of effects maternal additive and maternal permanent environment, variations were relatively low with rates close to 100 kg2 (Figure 2A) and provided important
variations throughout the age brackets. This fact indicated a good response to the selection during the period.
Dias et al. (2006) also reported increasing variances as cattle grew older. Results showed that birth ages at 550 days have a high direct additive and phenotypic genetic variation. In fact, they respond well to the selection process, in agreement with Albuquerque and Meyer (2001), Boligon et al. (2010), Sousa et al. (2008).
Since estimates of maternal hereditability had higher rates between birth and two months old, a greater participation of maternal effect could be denoted in the performance of animals during the period (Figure 2B). There was a decrease in maternal hereditability estimates from 120 days of age, with estimates close to zero around 550 days. As a rule, estimates of hereditability increased in time due to the genetic additive direct effect, with minimum and maximum respectively close to 0.20 and 0.49.
Low estimate rates of maternal hereditability denote a small contribution of maternal effect throughout the growth curve of the animal and the low selection for the same characteristic in beef Zebu cattle. Results are corroborated by research by Albuquerque and Meyer (2001); Dias et al. (2006); Silva et al. (2006).
Figure 2. Distribution of the components of additive genetic variance direct, maternal and animal and maternal permanent environment (A), and estimates of hereditability direct, maternal and total (B) with regard to random regression model M4466.
Figure 3 shows a graph representing the direct genetic co-relationship between weights at different ages. The saddle shape is the graphic configuration of the additive direct genetic co-relation matrix between weights of animals, with spaces due to the age of offspring. It has a symmetrical shape since the co-relation matrix is symmetric and quadratic too. The upper part represents the diagonal of the genetic co-relationship matrix with all values equal to 1. Decrease from the center to the edges shows that as age brackets distance themselves, the correlation estimates become smaller.
Genetic evaluation of Zebu cattle by orthogonal Legendre polynomials 207
Estimates of additive direct genetic correlation for birth weights at 550 days old denote three specific characteristics: the first stage ranges between birth and weaning. During this period there was a decrease in estimates of direct genetic correlations, especially from birth to 120 days old, which may be due to the great influence of maternal effect. It is actually the period in which the dam’s milk is exclusively the calf’s food.
The second stage occurs after age 120 days, or rather, the period in which the calf starts eating solid food by creep-feeding or pasture. Henceforth estimates of genetic correlations present increasing greatness up to around one year.
The third and last stage occurs from 365 days onwards, with estimates of genetic correlations presenting decreasing rates till 550 days old. Based on these data, greater estimates of genetic correlations may be obtained between adjacent weights, decreasing the estimates as the gap between the age increases. Results indicate that the selection for weight increase in any age will cause changes within the same direction as the other weights.
Weight as a selection criterion is crucial since breeders are paid for the live weight of the animal at finishing. However, results suggest that the selection for greater weights at a younger age produces, as a correlated response, greater weights at an older age, with higher nutritional requirements for the maintenance of the matrixes. Current estimates corroborate those given by Boligon et al. (2010), with a variation between 0.74 (PN x PS) to 0.82 (PD x PS) for Nellore.
When the animal’s phenotypic performance is analyzed throughout their ages (Figure 4), an accelerated decrease in growth rate may be observed during the first months, remaining partially constant till weaning (210 days). Later, the growth rate becomes a steep decline with the lowest rates after 400 days of age.
The association of data in Figure 2A, 3 and 4 confirms that a strong selection for body weight at younger ages has direct effects on weight during adulthood and this condition may have an influence on the economic efficiency of the system since it may increase the time of permanence of the herd on pasture, with growing production costs. However, assessment during younger ages provides gains at older ages due to the high genetic association between these characteristics and thus contributing towards an increase in the yearly genetic gain.
Figure 4. Distribution of average weight gains in Zebu cattle.
Conclusion
There is sufficient additive genetic variability to underscore satisfactory genetic gains for weight performance even in the early ages. A selection of early ages should be indicated since it may cause gains in post-weaning ages due to the high and positive association between the ages. The joint modeling effect of the animal’s age and the cow’s age at the moment offspring were weighed resulted in more exact estimates of components of co-variances and genetic parameters. In fact, the age of the cow at the weighing of the calf provides the true effect of the reproductive and physiological stage of the dam when giving milk to the calf.
Acknowledgements
The authors would like to thank ANCP for permission to retrieve data for current assay.
References
Akaike, H. (1974). A new look at the statistical model identification. Automatic Control, IEEE Transactions on Automatic Control, 19(6), 716-723.
Albuquerque, G. & Meyer, K. (2001). Estimates of direct and maternal genetic effects for weights from birth to 600 days of age in Nelore cattle. Journal of Animal Breeding and Genetics, 118(2), 83-92.
Albuquerque, L. G. & El Faro, L. (2008). Comparações entre os valores genéticos para características de crescimento de bovinos da raça Nelore preditos com modelos de dimensão finita ou infinita. Revista Brasileira de Zootecnia, 37(2), 238-246.
Biassus, I. d. O., Cobuci, J. A., Costa, C. N., Rorato, P. R. N., Braccini Neto, J. & Cardoso, L. L. (2011). Genetic parameters for production traits in primiparous Holstein cows estimated by random regression models. Revista Brasileira de Zootecnia, 40(1), 85-94. Boligon, A. A., Silva, J. A. V., Sesana, R. C., Sesana, J. C.,
Junqueira, J. B. & Albuquerque, L. G. (2010). Estimation of genetic parameters for body weights, scrotal circumference, and testicular volume measured at different ages in Nellore cattle. Journal of Animal Science, 88(4), 1215-1219.
Dias, L. T., Albuquerque, L. G., Tonhati, H. & Teixeira, R. A. (2006). Estimação de parâmetros genéticos para peso do nascimento aos 550 dias de idade para animais da raça Tabapuã utilizando-se modelos de regressão aleatória. Revista Brasileira de Zootecnia, 35(5), 1915-1925.
Ferraz, J. B. S. & Eler, J. P. (2010). Parceria público x privada no desenvolvimento de pesquisa em melhoramento genético animal. Revista Brasileira de Zootecnia, 39(4), 216-222.
Freitas, L. S., Silva, M. A., Verneque, R. S., Valente, B. D., Corrêa, G. S., Ferreira, R. F., ... Santos, G. G. (2010). Avaliação da persistência na lactação da raça Guzerá, utilizando modelos de regressão aleatória. Arquivo Brasileiro de Medicina Veterinaria e Zootecnia, 62(2), 401-408.
Meyer, K. (2004). Scope for a random regression model in genetic evaluation of beef cattle for growth. Livestock Production Science, 86(1), 69-83.
Meyer, K. (2007). WOMBAT - A tool for mixed model analyses in quantitative genetics by restricted maximum likelihood (REML). Journal of Zhejiang University Science, 8(11), 815-821.
Pelicioni, L. C., Albuquerque, L. G. & Queiroz, S. A. (2009). Estimação de componentes de co-variância
para pesos corporais do nascimento aos 365 dias de idade de bovinos Guzerá empregando-se modelos de regressão aleatória. Revista Brasileira de Zootecnia, 38(1), 50-60.
Schwarz, G. (1978). Estimating the dimension of a model.
The annals of statistics, 6(2), 461-464.
Silva, R. R., Silva, F. F., Prado, I. N., Carvalho, G. G. P., Franco, I. L. F., Mendes, F. B. L., ... Pinheiro, A. A. (2006). Metodologia para o estudo do comportamento de bezerros confinados na fase pós-aleitamento.
Archivos Latinoamericanos de Producción Animal, 42, 135-138.
Sousa, J. E. R., Silva, M. A., Sarmento, J. L. R., Sousa, W. H., Souza, M. S. M. & Fridrich, A. B. (2008). Homogeneidade e heterogeneidade de variância residual em modelos de regressão aleatória sobre o crescimento de caprinos Anglo-Nubianos. Pesquisa Agropecuária Brasileira, 43(12), 1725-1732.
Tholon, P. & Queiroz, S. A. (2008). Utilização de diferentes estruturas de variância residual em modelos de regressão aleatória para descrição da curva de crescimento de perdizes (Rhynchotus rufescens) criadas em cativeiro. Revista Caatinga, 21(2).
Valente, B. D., Silva, M. A., Silva, L. O., Bergmann, J. A., Pereira, J. C., Fridrich, A. B., ... Corrêa, G. S. (2008). Estruturas de covariância de peso em função da idade de animais Nelore das regiões Sudeste e Centro-Oeste do Brasil. Arquivo Brasileiro de Medicina Veterinaria e Zootecnia, 60(2), 389-400.
Received on October 19, 2014. Accepted on January 22, 2015.