Agrometeorology |
Article
Utilization of the cropgro-soybean model to
estimate yield loss caused by Asian rust in cultivars
with different cycle
Rafael de Ávila Rodrigues (1*); João Eduardo Pedrini (2); Clyde William Fraisse (3); José Maurício Cunha Fernandes (4); Flávio Barbosa Justino (1); Alexandre Bryan Heinemann (5); Luiz Cláudio Costa (1); Francisco Xavier Ribeiro do Vale (6)
(1) Universidade Federal de Viçosa (UFV), Departamento de Engenharia Agrícola, 36570-000 Viçosa (MG), Brasil. (2) Universidade de Passo Fundo (UPF), Departamento de Fitopatologia, 99001-970 Passo Fundo (RS), Brasil.
(3) University of Florida (UF), Agricultural & Biological Engineering Department, 32611-0570 Gainesville (FL), United States of America. (4) Embrapa Trigo, 99001-970 Passo Fundo (RS), Brasil.
(5) Embrapa Arroz e Feijão, 75375-000 Santo Antônio de Goiás (GO), Brasil. (6) UFV, Departamento de Fitopatologia, 36570-000 Viçosa (MG), Brasil. (*) Corresponding author: [email protected]
Received: Dec. 11, 2011; Accepted: June 05, 2012
Abstract
In recent years, crop models have increasingly been used to simulate agricultural features. The DSSAT (Decision Support System for Agrotechnology Transfer) is an important tool in modeling growth; however, one of its limitations is related to the
unac-counted-for effect of diseases. Therefore, the goals of this study were to calibrate and validate the CSM CROPGRO-Soybean for the soybean cultivars M-SOY 6101 and MG/BR 46 (Conquista), analyze the performance and the effect of Asian soybean rust on these cultivars under the environmental conditions of Viçosa, Minas Gerais, Brazil. The experimental data for the evaluation, testing, and adjustment of the genetic coefficients for the cultivars, M-SOY 6101 and MG/BR 46 (Conquista), were obtained during the 2006/2007, 2007/2008 and 2009/2010 growing seasons. GLUE (Generalized Likelihood Uncertainty Estimation) was used for the estimation of the genetic coefficients, and pedotransfer functions have been utilized to estimate the physical characteristics of the soil. For all of the sowing dates, the early season cultivar, M-SOY 6101, exhibited a lower variance in yield,
which represents more stability with regard to the interannual climate variability, i.e., the farmers who use this cultivar will have
in 50% of the crop years analyzed, a higher yield than a late-season cultivar. The MG/BR 46 (Conquista) cultivar demonstrated
a greater probability of obtaining higher yield in years with favorable weather conditions. However, in the presence of the Asian
soybean rust, yield is heavily affected. The early cultivar, M-SOY 6101, showed a lower risk of being affected by the rust and consequently exhibited less yield loss considering the scenario D90 (condensation on the leaf surface occurs when the relative humidity is greater than or equal to 90%), for a sowing date of November 14.
Key words: DSSAT, calibration, validation, modeling, rust epidemics.
Utilização do modelo cropgro-soybean na estimativa da perda de produtividade
causada pela ferrugem asiática utilizando cultivares de diferentes ciclos
Resumo
Nos últimos anos, tem-se observado grande aumento na utilização de modelos de simulação na agricultura. O DSSAT (Siste
-ma de Suporte à Decisão para Transferência de Agrotecnologia) é u-ma importante ferramenta na modelagem e simulação de crescimento de culturas, porém, uma das limitações é a não contabilização do efeito imposto por doenças. Assim, o trabalho teve como objetivos calibrar e validar o modelo CROPGRO-Soybean para as cultivares M-SOY 6101 e MG/BR 46 (Conquista), analisar a performance e o efeito da ferrugem asiática nessas cultivares nas condições edafoclimáticas de Viçosa, Minas Gerais, Brasil. Os dados experimentais para avaliação, teste e ajuste dos coeficientes genéticos para as duas cultivares foram obtidos durante as safras 2006/007, 2007/2008 e 2009/2010. O GLUE (do inglês, Generalized Likelihood Uncertainty Estimation) foi utilizado para a estimativa dos coeficientes genéticos e utilizaram-se as funções de pedotransferência para a estimativa dos parâmetros físicos do solo. A cultivar semiprecoce, M-SOY 6101, para todas as datas de plantio analisadas, proporcionou menor risco e variância, ou seja, o agricultor que utilizar essa cultivar terá em 50% dos anos agrícolas analisa
-dos, mais produtividade que uma cultivar de ciclo tardio. A cultivar MG/BR 46 (Conquista) proporcionou maior probabilidade em obter mais produtividade nos anos de condições meteorológicas favoráveis. Entretanto, considerando o efeito da fer
-rugem, a produtividade foi altamente afetada. Na cultivar M-SOY 6101, observou-se menor risco do efeito da ferrugem e, consequentemente, menor redução de produtividade considerando D90 (a condensação na superfície da folha ocorre quando a umidade relativa do ar é maior ou igual a 90%) para a data de semeadura em14 de novembro.
1. INTRODUCTION
Soybean [Glycine max (L.) Merr.] is one of the main crops cultivated worldwide and is used in the preparation of various products, such as oil, and is a major ingredient in livestock feed due to the high level of protein (Oliveira et al., 2005). In 2009/2010, the area sown in Brazil was 23.6 million hectares with a production of 68.7 million tons and an average yield of approximately 2941 kg per hectare (CONAB, 2010).
Despite technological achievements, the production of soybean has been affected by pests and diseases, largely rusts, caused by the fungus, Phakopsora pachyrhizi Syd. & P.Syd. Therefore, new methodologies are needed to man-age the associated crop damman-age. In 2002, the fungus was reported in Brazil and Paraguay; it has spread rapidly in these countries and is considered to be the most destruc-tive disease affecting soybeans (Yorinori et al., 2003).
Economic losses associated with this disease in Brazil have been estimated as US$ 80 million in the 2001/2002 season, increasing to over US$ 650 million in 2002/2003 and to more than US$ 1.2 billion in 2003/2004 (Yorinori et al., 2005). Recent estimates of the yield loss caused by the soybean rust were approximately 4.5% of the Brazilian soybean crop in 2006/2007, which was equivalent to 2.67 million tons of grain. Including the control operations cost, the total rust disease cost in the 2006/2007 growing season was estimated at US$ 2.19 billion (EMBRAPA, 2007) and US$ 1.74 billion in 2008/2009.
Several methods have been developed for predicting Asian soybean rust epidemics using several mathemati-cal and agrometeorologimathemati-cal models. Previous simulations have been performed using SOYRUST, which simulates the daily increase in the disease severity in different va-rieties of soybean (Yang et al., 1991a,b). The primary strategy focuses on mapping the epidemics risk areas us-ing climate models based on critical periods for infection using historical weather data and linear regression. This method is applied to examine the soybean rust severity using daily weather variables during the progression of the disease (Magarey et al., 2004; Del Ponte et al., 2006a).
As examples of studies for this pathosystem are those to evaluate the potential of damage to yield (Yang et al., 1991b); mapping areas for risk of epidemics using climate models based on critical periods for infection supported by historical climatic data (Magarey et al., 2004); estimation of areas with high inoculum of the pathogen (Pivonia et al., 2004); estimation the time of disease occurrence (Pivonia et al., 2006); estimation of areas with great availability of inoculum coming from different sources (Kim et al., 2005); and estimation of potential inoculum dispersed to long distances (Isard et al., 2005; Pan et al., 2006).
Currently, CSM-CROPGRO-Soybean is an impor-tant tool for modeling phenological crop mechanisms
(Jones et al., 2001, 2003), and such models can simu-late climate change scenarios to estimate yields in the Decision Support System for Agrotechnology Transfer (DSSAT). However, there are limitations that are related to the fact that the impact of pests and diseases on the crop characteristics is not taken into consideration.
The aim of this study was to calibrate and validate the CROPGRO-Soybean model for the performance of the M-SOY 6101 and MG/BR 46 (Conquista) soybean cultivars under favorable conditions for the occurrence of rust epidemics.
2. MATERIAL AND METHODS
Calibration and validation of the genetic coefficients of the
CSM-CROPGRO-Soybean model
Data from field experiments conducted in the experi-mental area in Viçosa, Minas Gerais State (Latitude – 20º 44’ 48.5’’S, Longitude – 42º 50’ 58.4’’W,
eleva-tion 670 m) during the 2009/2010 growing season were utilized as the input data for Decision Support System for Agrotechnology Transfer (DSSAT). The city of Viçosa is located in the Southeast part of Brazil and is characterized by a tropical climate; the onset of the rainy season occurs in October and lasts through March. Soybean cultivars of different maturity groups, M-SOY 6101 (early maturity) and MG/BR 46 (Conquista) (late maturity), were used to perform the modeling experiment.
The sowing dates were 12/26/2009 [MG/BR 46 (Conquista)] and 1/7/2010 (M-SOY 6101). The cultivars
Table 1. Chemical and physical characteristics of soil in the experimental area used
Chemical Characteristics
Attributes Values Units
pH in H2O 5,41
H + Al (1) 6,6 cmol(+) dm-3
Al2+ 0,00 cmol(+) dm-3
Calcium2+ 3,41 cmol(+) dm-3
Magnesium2+ 0,44 cmol(+) dm-3
Potassium 80 mg dm-3
Phosphorus 17 mg dm-3
Organic matter 2,94 dag/kg
Physical Characteristics
Coarse sand 18 %
Fine sand 11 %
Silt 15 %
Clay 56 %
Textural Class Clay
were sown in rows spaced 0.5 m apart. Fertilization was performed using 60 kg K2O ha-1 and 120 kg P
2O5 ha -1
in the form of potassium chloride (KCl) and simple superphosphate (SS), respectively, which correspond-ed to 400 kg ha-1 of 0-30-15 (NPK). The soil in the
experimental area is a Argissolo Vermelho-Amarelo cambissólico; the physical and chemical characteristics are shown in table 1. The following data were collected for the analysis of growth: the seedling emergence, flowering, physiological maturity, dry matter, and leaf area index.
To estimate the values of the lower limit, drained upper limit and saturation of the soil, the methodology proposed by Tomasella et al. (2000) was used. This ap-proach includes the pedotransfer functions for estimat-ing water retention curves in the soil and was developed exclusively for Brazilian soils. The physicochemical data of the soil water storage used in the simulations are de-scribed in table 2.
The model estimation of the genetic parameters re-lated to the phenological phases and yield components was performed using GLUE (Generalized Likelihood Uncertainty Estimation), as described by He et al. (2009). This tool begins the simulations based on those param-eters related to phenology followed by the paramparam-eters of crop growth and, lastly, the parameters related to yield components. This sequence was established due to the de-pendence of the growth parameters on the phenological parameters (Jones et al., 2001, 2003). In this approach, GLUE randomly generates the parameters based on a uniform distribution and compares the estimates with the observed data. The set of parameters that provides the highest probability, i.e., reducing the error difference be-tween the estimated and observed, was selected as the best set of coefficients.
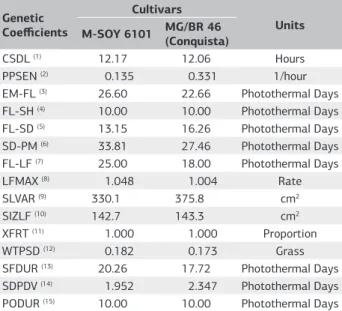
The genetic coefficients, CSDL, PPSEN, EM-FL, FL-SH, FL-SD, SD-PM, and FL-LF, are related to crop development, the LFMAX, Slaves, and SIZLF coefficients are related to the vegetative growth, and the coefficients XFRT, WTPSD, SFDUR, SDPDV and PODUR are im-portant processes that define the yield and its components (Jones, 2003). The coefficients were adjusted to calibrate the model, and the values for the two cultivars are pro-vided in table 3.
The validation of the parameters of the CSM-CROPGRO-Soybean model obtained from the calibra-tion was performed using data from the field experiments conducted in the 2006/2007 and 2007/2008 growing seasons in the cities of Uberaba, Viçosa and São Gotardo,
Minas Gerais. Details of these experiments were pre-viously described by Calvalcante et al. (2010) and Vasconcelos et al. (2010).
In the process of validation of the CROPGRO-Soybean model, we used only measured yield data and its components obtained in fields near the cities of Uberaba, Viçosa and São Gotardo, Minas Gerais.
Description of the integration of the Asian soybean rust disease module to the CSM-CROPGRO-Soybean model
Pavan (2008) developed a model for wheat leaf rust and incorporated it with the model of growth and de-velopment of wheat (CSM-CROPSIM-Wheat), basing the development of the model on the pathogen’s life cycle. Processing was accomplished by exchanging the data regarding the number of leaves produced and the available health area on each leaf and using informa-tion concerning the area of diseased plants. This model is generic, i.e., the variables of this model can be pa-rameterized to cover several diseases that occur in the canopy of a given crop.
Table 2. Physical characteristics of soil water used in the simulations for Viçosa (MG)
Depth (cm)
Saturation (cm3 cm-3)
Upper limit (cm3 cm-3)
Lower limit (cm3 cm-3)
Global density (g cm-3)
0-5 0.442 0.381 0.256 1.41
5-80 0.442 0.381 0.256 1.41
Table 3. Genetic coefficients used in the CSM-CROPGRO-Soybean, calibrated to the early and late cultivars used in this study
Genetic
Coefficients
Cultivars
Units M-SOY 6101 MG/BR 46
(Conquista)
CSDL (1) 12.17 12.06 Hours
PPSEN (2) 0.135 0.331 1/hour
EM-FL (3) 26.60 22.66 Photothermal Days FL-SH (4) 10.00 10.00 Photothermal Days FL-SD (5) 13.15 16.26 Photothermal Days SD-PM (6) 33.81 27.46 Photothermal Days FL-LF (7) 25.00 18.00 Photothermal Days
LFMAX (8) 1.048 1.004 Rate
SLVAR (9) 330.1 375.8 cm2
SIZLF (10) 142.7 143.3 cm2
XFRT (11) 1.000 1.000 Proportion
WTPSD (12) 0.182 0.173 Grass
SFDUR (13) 20.26 17.72 Photothermal Days SDPDV (14) 1.952 2.347 Photothermal Days PODUR (15) 10.00 10.00 Photothermal Days
Where: (1)CSDL: Critical Short Day Length below which reproductive development
progresses with no daylength effect (for shortday plants) (hour); (2) PPSEN: Slope
of the relative response of development to photoperiod with time (positive for
shortday plants) (1/hour); (3) EM-FL: Time between plant emergence and flower
appearance (R1) (photothermal days); (4) FL-SH: Time between first flower and
first pod (R3) (photothermal days); (5) FL-SD: Time between first flower and first
seed (R5) (photothermal days); (6) SD-PM: Time between first seed (R5) and
physiological maturity (R7) (photothermal days); (7) FL-LF: Time between first
flower (R1) and end of leaf expansion (photothermal days); (8) LFMAX: Maximum
leaf photosynthesis rate at 30oC, 350 vpm CO2, and high light (mg CO2/m2-s);
(9) SLAVR: Specific leaf area of cultivar under standard growth conditions (cm2/g);
(10) SIZLF: Maximum size of full leaf (three leaflets) (cm2); (11) XFRT: Maximum
fraction of daily growth that is partitioned to seed + shell; (12) WTPSD: Maximum
weight per seed (g); (13) SFDUR: Seed filling duration for pod cohort at standard
growth conditions (photothermal days); (14) SDPDV: Average seed per pod under
standard growing conditions; (15) PODU: Time required for cultivar to reach final
Based on the analysis of the generic disease model and on the similarities of the structure of the CSM-CROPSIM-Wheat and CSM-CROPGRO-Soybean models, the initial step was to integrate the generic mod-ule of the disease progress to the model of the growth and development of soybean to estimate the progress and the damage caused to the soybean plants.
To integrate the disease model and CSM-CROPGRO-Soybean to the simulation model of the development, growth and yield of soybean, we used the following out-put variables: DOY (day of the current simulation) in the Julian format; AREALF, the remaining healthy leaf area in cm2; and DYNAMIC, the state of the simulator, e.g., the
integration rate, final.
As part of CSM-CROPGRO-Soybean, the PEST module is identified by the variable that should serve to integrate the models (Boote et al., 1983). The factors, namely, DISLA (the variable used for the allocation of total diseased leaf area) and WLIDOT (an integration variable used to assign the damage caused by pests or cold damage to the leaf mass), were chosen.
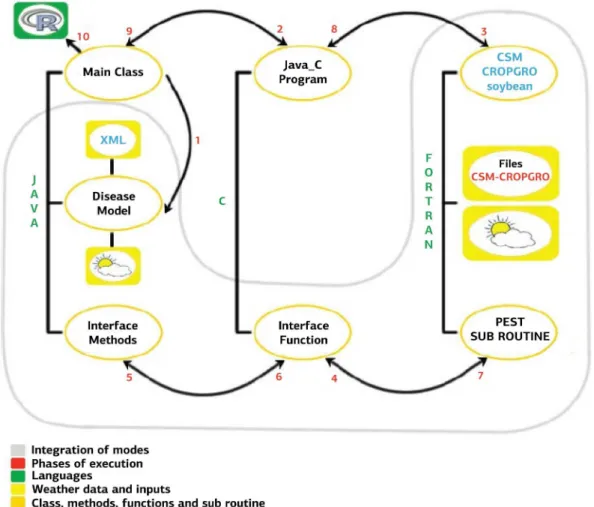
A total of ten steps were executed to execute the disease modeling. In the first step, integration, the generic model of disease integrates the data provided
by the CSM-CROPGRO-Soybean inside the Main class. According to step 2, the same Main method in-terfaces the user-supplied parameters to initialize the CSM-CROPGRO-Soybean model. In step 3, CSM Simulator-CROPGRO-Soybean is initialized by the bridge of communication with the previous parameters using the main program, CSM CROPGRO’s CSM-Soybean, which was converted into a subroutine to en-able its use in the integration (Figure 1).
With the simulators initialized and at a certain point in the simulation, CSM-CROPGRO-Soybean performs one of its subroutines, PEST, which makes a request to another intermediate function in C, INTERFACE (step 4), thereby passing three variables (DOY, AREALF and DYNAMIC). Using a JNI interface within this same function, a call to the Java INTERFACE sends the pa-rameters of the FORTRAN-C of the current step for C-JAVA (step 5) (Figure 1).
The generic model of the disease subsequently returns the calculated values of the leaf area to the senescent area us-ing the C function INTERFACE in step 6 (JNI) in which this function performs step 7, which, through the use of pointers, updates the values of these variables in CSM-CROPGRO-Soybean. The communication interface
developed in steps 4 through 7 is used several times during the simulation. In the steps 8 and 9, one can make use of the output using R language, step 10, in which the statisti-cal analysis and graphics are processed (Figure 1).
The integration of the CSM-CROPGRO-Soybean and Soybean Rust models accounted for the effects of abi-otic factors, such as soybean rust and the abiabi-otic effects related to climate. This methodology has proven to be ef-ficient to bind a template as CSM-CROPGRO-Soybean written in FORTRAN and the soybean rust model writ-ten in JAVA. The good practices of programming em-ployed by the scientists in the development of these two models favored the integration of the models.
This disease model requires the leaf wetness duration (LWD) as input data because most pathogens require the presence of water for spores germination (Vale et al., 2004, Sentelhas et al., 2004). To estimate the LWD, the daily maximum and minimum temperatures of the historical weather data for the city of Viçosa were converted into hourly
data using the algorithm proposed by Parton and Logan (1981). The empirical method proposed by Sentelhas et al. (2008), which holds that the onset of condensation on the leaf surface occurs when the relative humidity is greater than or equal to 90%, was applied for two LWD scenarios, assuming relative humidities of 90 and 95%.
Simulations of the growth, development, and yield of soybean cultivars
To simulate the performance of the M-SOY 6101and MG/BR 46 (Conquista) soybean cultivars in Viçosa, sce-narios with no disease (ND), disease and 90% relative humidity (D90), and disease and 95% relative humidity (D95) were used. The evaluation was conducted for the 1968-2009 interval of the daily data for the precipitation (mm), maximum temperature and minimum air (°C) and number of hours of sunshine (n) of the National Institute
Figure 2. Fit between the simulated data (solid line) and measured (dot) with their standard deviations for the leaf area index (LAI) and dry matter accumulated in the calibration for soybean cultivars M-SOY 6101 (a, c) and MG/BR 46 (Conquista) (b, d).
(a)
(c)
(d)
of Meteorology (INMET). We considered four sowing dates, November 14, November 28, December 5, and December 26, to perform the simulations, the onset of which was taken two months before the date of sowing to stabilize the water balance.
As a criterion to analyze the performance of the cul-tivars under different scenarios (ND, D90, and D95), we used the probability of exceeding, which is defined by equation 1, and the relationship between the simulated and the average yield of the same variance, as follows:
E (x) = 1 – F (x), F (x) = P (X ≤ x), (1)
where E (x) is the probability of exceeding (%), F (x) stands for the cumulative distribution function (%), and P (X≤x) is the probability that the variable X is less than or equal to x in which x represents the simulated yield in kg ha-1.
3. RESULTS AND DISCUSSION
Calibration and Validation of CSM-CROPGRO-Soybean
The observed and simulated leaf area index (LAI) and dry matter accumulated in the calibration demonstrate that the simulated values of the LAI and dry matter produc-tion are in accordance to the observed values (Figure 2). For the LAI, the model simulations closely followed the field observations during the majority of the life cycle of the soybean plants. It should be noted that the maximum IAF observed was 3.6 m2 m-2. For the model simulations
of CROPGRO-Soybean, the maximum simulated IAF was 3.6 m2 m-2 (M-SOY 6101), whereas the LAI values
were 2.64 m2 m-2 (simulated) and 2.46 m2 m-2 (observed)
for MG/BR 46 (Conquista) (Figure 2).
For cultivar M-SOY 6101, there was only a difference of one day in flowering prediction and flowering observa-tion. In terms of yield, there was a model overestimation of up to 10%. For the MG/BR 46 (Conquista) cultivar, there was no difference between the simulated and observed dates of flowering and maturity (Table 4). However, the simulated yield was 15% higher than the actual yield value.
According to Guillaume et al. (2011), the purpose of validation is to improve the yield prediction, and there is no need to use observed variables for the growth and development of crop. The measured and simulated data in the validation process are described in table 5.
The percentage deviation (PD) for the negative values indicates an underestimation, whereas the percentage of positive deviation indicates an overestimation. Thus, the values were 10.28 and 15.7, showing that the late cultivar exhibited a higher PD compared to the early cultivar. The yield was adequately simulated by the CSM-CROPGRO-Soybean model for both cultivars, and the model also per-forms well for predicting the flowering and physiological maturity (Table 4).
The observed lengths of time, as measured in days, from seedling emergence to flowering for the two cultivars and the simulated values were similar. The cycle for the early crop va-riety was 98 days to reach maturity and 142 days for the late variety (Table 4). The estimated date of phenological phases occurrence becomes of great importance for the planning of activities involved in agricultural management.
Table 4. Average measured and simulated with CSM-CROPGRO-Soybean cultivars for M-SOY 6101 and MG/BR 46 (Conquista) in 2009/2010 growing seasons, in Viçosa (MG)
Calibration 2009/2010
Cultivars Variables Simulated Measured Standard
Deviation PD (%)
M-SOY 6101
Flowering (days) 41 42 **** ****
Physiological maturity (days) 98 98 **** ****
Yield (kg ha-1) 3293 2986 217.1 10.28
MG/BR 46 (Conquista)
Flowering (days) 51 51 **** ****
Physiological maturity (days) 142 142 **** ****
Yield (kg ha-1) 3272 2828 314.0 15.7
Table 5. Average values of the yields measured with the CSM-CROPGRO-Soybean cultivars for M-SOY 6101 (Uberaba) and MG/BR 46 (Conquista) (Viçosa and São Gotardo) in 2006/2007 and 2007/2008 growing seasons according to Cavalcante et al. (2010) and Vasconcelos et al. (2010)
Validation 2006/2007 and 2007/2008
Variable Simulated Measured PD1 (%) Standard
Deviation EQM
(2) (%)
Uberaba Yield (kg ha-1) 2700 2245 20.2 321.3 7.7
Viçosa Yield (kg ha-1) 2266 2259 0.3 4.9 0.21
São Gotardo Yield (kg ha-1) 4835 4262 13.4 405.2 8.9
Performance of the late and early cultivars in Viçosa
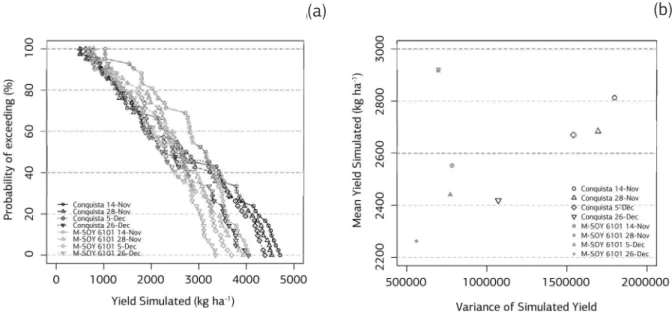
For all sowing dates analyzed, the early cultivar, M-SOY 6101, showed a lower risk, i.e., the farmer that uses an early maturity variety may have increased yield by up to 50% if more appropriate sowing data has been chosen by combining crop phenology and the distribution of climate elements (Figure 3a). For all four of the sowing dates, the early variety, M-SOY 6101, had a lower yield variance, representing more stability with regard to inter-annual climate variability (Figure 3a, b).
The behavior of cultivars in situation without rust (ND) (Figure 3) and D95 (Figure 4b) were similar in terms of fewer hours of leaf wetness duration, consider-ing the relative humidity above 95%. This provided a less effect of rust on the early cultivar as compared to the late one which resulted in great yield increases. Accordingly, the sowing dates in the best time resulted in less disease intensity due to the lower availability of inoculum.
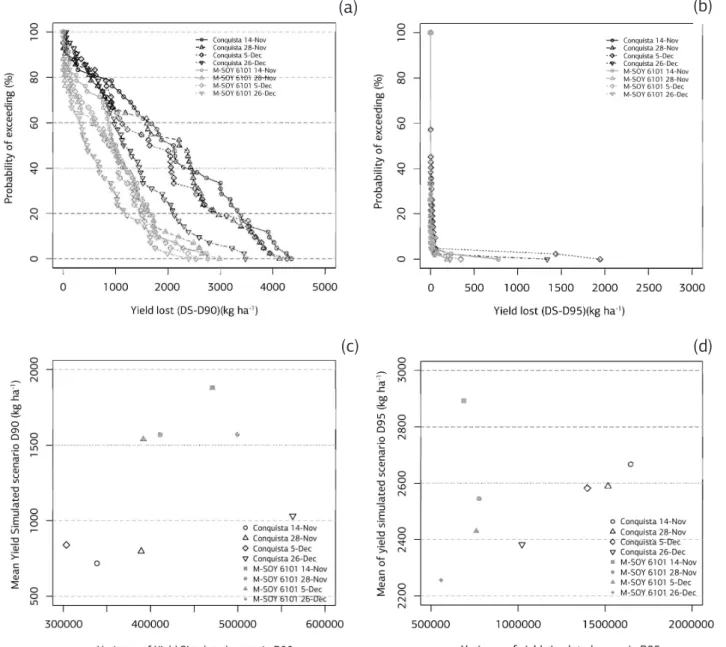
However, the use of late varieties, such as MG/BR 46 (Conquista), affords a greater probability of obtain-ing lower yield in years experiencobtain-ing weather conditions that are favorable for soybean rust epidemics (Figure 4a). Among the sowing dates studied, November 14 was no-table for both of the cultivars, being the date with the highest probability of higher yield (Figure 4a).
The flowering-physiological maturity showed varia-tions for the sowing dates, i.e., a decrease in the cycle was observed with later sowing dates. A plausible expla-nation for this is associated with the combined effect of reduced water availability in the crop years analyzed, es-pecially during the two critical periods of development of soybean, the stages of flowering and grain filling, thereby
limiting high yield. Another plausible explanation is the high availability of energy from sunlight, which directly influences soybean growth, induces flowering.
When the sowing date is in November, the soybean plants will complete their cycle in the rainy season; how-ever, when the sowing date is in December, the crop experi-ences lower water availability for growth and phenological development. This phenomenon has also been confirmed by Dallacort (2006), who reported that the crop cycle tends to decrease as the soybean sowing date is delayed.
Nakagawa (1983) points out that November has generally provided the best results in yield in those states where the crop is traditionally grown. Under Brazilian conditions, the time of sowing is dependent on the culti-var, growing region and environmental conditions of the crop year; October to December is usually recommended.
Assessment of the effects of Asian rust on the yield of the late and early cultivars in Viçosa
The yield loss due to the effects of rust is greater in the MG/BR 46 (Conquista) cultivar, with a significant loss being observed when the sowing date is November 14 (Figure 4a). In this regard, one may emphasize that the leaf wetness duration was essential for the occurrence of the rust, favoring spore germination and consequently host infection. Under high rust severity, the soybean grain formation is negatively impacted, causing a substantial re-duction in the yield and seed quality. However, by assum-ing a December 26 sowassum-ing, one may note increased yield under conditions of lower rust severity, considering the effects of rust in the D90 and D95 scenarios (Figure 4a).
Figure 3. Probability of exceeding (a) and variance (b) of simulated soybean yield (ND) for different sowing dates in Viçosa, MG. Climate data from INMET (1968-2009).
Marchetti et al. (1976) demonstrated the effect of the temperature and leaf wetness duration on the ure-dospore germination of P. Pachyrhizi and observed that germination occurred between 7 and 28 ºC, with an op-timum between 15 to 25 ºC. The infections occurred at temperatures of 20 to 25 ºC and 6 h of wetness with a
maximum of 10 to 12 h of leaf wetness.
For simulated date with scenario D90, the early culti-var, M-SOY 6101, showed a lower risk of being affected by the rust and, consequently, a reduced yield loss (Figure 4a). This phenomenon is related to the shorter phenological cycle, which affords fewer hours of leaf wetness duration (Figure 3a). By assuming the D95 condition, the soybean will be exposed to fewer hours of leaf wetness, and yield will not be affected, as shown in Figure 4b.
For the early cultivar, there was lower variance when the sowing occurred on November 14, indicating that this cultivar responds well to the effect of the rust due to the shorter cycle (Figure 4c).
Under field conditions, low values of disease pro-gression have been observed in Taiwan during epidemics under conditions of higher temperatures and low pre-cipitation (Yang et al., 1990). The interaction between the precipitation and rust epidemics was demonstrated by the observation of a high correlation between the maximum severity of rust and precipitation-related fac-tors, such as the number of days of rain and accumu-lated rainfall, for periods of up to one month during the progress of the epidemic (Tan et al. 1996; Del Ponte et al., 2006a).
Figure 4. Probability of exceeding and variance of simulated soybean yield, considering the scenarios D90 (a, c) and D95 (b, d), for different sowing date. Climate data from INMET (1968-2009).
(a)
(c)
(d)
In general, the MG/BR 46 (Conquista) cultivar deliv-ered a higher yield compared to the early cultivar during the crop years analyzed in the absence of rust. However, in the presence of the Asian soybean rust, the yield is heavily affected. In the scenario without rust (ND), the MG/BR 46 (Conquista) cultivar showed higher yield compared to the M-SOY 6101 cultivar.
4. CONCLUSION
The model demonstrated sensitivity for the genetic coeffi-cients obtained using different cultivars, the phenological development and grain yield under the soil and climate con-ditions of the city of Viçosa when considering the effects imposed by Asian rust on the yield of the soybean crop.
The MG/BR 46 (Conquista) cultivar has greater prob-ability of obtaining higher yield in years when the weather conditions are unfavorable for rust epidemics. Among the sowing dates studied, November 14 was found to be the best for both of the cultivars and resulted in the highest probability of achieving a better yield.
The MG/BR 46 (Conquista) cultivar expressed lower yield during the period simulated, considering the effect of Asian rust with the D90 scenario, as the early cultivar (M-SOY 6101) showed a smaller effect on yield due to the presence of rust.
ACKNOWLEDGMENTS
We would like to thank Prof. Willingthon Pavan for pro-viding all of the necessary tools at the Universidade de Passo Fundo, RS. We thank Coordenação de Aperfeiçoamento de Pessoal de Nível Superior – CAPES and Conselho Nacional de Desenvolvimento Científico e Tecnológico – CNPq for the Doctoral Fellowship and Doctoral Sandwich Abroad funding (Project Number: 201714/2009-4) pro-vided to Rafael A. Rodrigues. We are indebted to Fundação de Amparo à Pesquisa do Estado de Minas Gerais – FAPEMIG, Rede Brasileira de Pesquisa sobre Mudanças Climáticas Globais – Rede CLIMA (Project Number: 383601/2011-8) and REPENSA/CNPQ (Project Number: 562469/2010-9) for financial support.
REFERENCES
BOOTE, K.J.; JONES, J.W.; MISHOE, J.W.; BERGER, R.D. Coupling pests to crop growth simulators to predict yield reductions. Phytopathology, v.73, p.1581-1587, 1983.
CAVALCANTE, A.K.; SOUSA, L.B.; HAMAWAKI, O.T.; ARAÚJO, G.O.; ROMANATO, F.N. Variabilidade genética de genótipos de soja de ciclo precoce no município de Uberaba-MG. Revista Verde, v.5, p.115-119, 2010.
CONAB – Companhia Nacional de Abastecimento. Disponível em: <www.conab.gov.br>.Acesso em: 25/11/2010.
DALLACORT, R.; FREITAS, P.S.L.; FARIA, R.T.; GONÇALVES, A.C.A.; REZENDE, R.; BERTONHA, A. Utilização do modelo Cropgro-soybean na determinação de melhores épocas de semeadura da cultura da soja, na região de Palotina, Estado do Paraná. Acta Scientiarum Agronomy, v.28, p.583-589, 2006.
DEL PONTE, E.M.; GODOY, C.V.; LI, X.; YANG, X.B. Predicting severity of Asian soybean rust epidemics with empirical rainfall models. Phytopathology, v.96, p.797-803, 2006a.
EMBRAPA SOJA. Tecnologias de produção de soja, Paraná, 2007. Londrina, 2007. 220p.
GUILLAUME, S.; BERGEZ, J.E.; WALLACH, D.; JUSTES, E. Methodological comparison of calibration procedures for durum wheat parameters in the STICS model. European Journal of Agronomy, v.35, p.115-126, 2011.
HE, J.; DUKES, M.D.; JONES, J.W.; GRAHAM, W.D.; JUDGE, J. Applying Glue for estimating Ceres-Maize Genetic and soil parameters for sweet corn production. Transactions ASAE, v.52, p.1907-1921, 2009.
ISARD, S.A.; GAGE, S.H.; COMTOIS, P.; RUSSO, J. M. Principles of the atmospheric pathway for invasive species applied to soybean rust. Bioscience, v.55, p.851-861, 2005.
JONES, J.W.; KEATING, B.A.; PORTER, C.H. Approaches to modular model development. Agricultural Systems, v.70, p.421-443, 2001.
JONES, J.W.; HOOGENBOOM, G.; PORTER, C.H.; BOOTE, K.J.; BATCHELOR, W.D.; HUNT, L.A.; WILKENS, P.W.; SINGH, U.; GIJSMAN, A.J.; RITCHIE, J.T. The DSSAT cropping system model. European Journal of Agronomy, v.18, p.235-265, 2003.
KIM, K.S.; WANG, T.C.; YANG, X.B. Simulation of apparent infection rate to predict severity of soybean rust using a fuzzy logic system. Phytopathology, v.95, p.1122-1131, 2005.
MAGAREY, R.; ISARD, S.; RUSSO, J.; GAGE, S.; HARTMAN, G.; MILES, M. Survey planning for soybean rust based on aerobiological and climatological factors. Report to USDA, 2004. Disponível em: <http://www.aphis.usda.gov/plant_health/plant_ pest_info/soybean_rust/>. Acesso em: 10 /9/2010.
MARCHETTI, M.A.; MELCHING, J.S.; BROMFIELD, K.R. The effects of temperature and dew period on germination and infection by uredospores of Phakopsora pachyrhizi. Phythopatology, v.66, p.461-463, 1976.
MELCHING, J.S.; DOWLER, W.M..; KOOGLE, D.L.; ROYER, M.H. Effects of duration, frequency, and temperature of leaf wetness periods on soybean rust. Plant Disease, v.73, p.117-122, 1989.
componentes da produção. Pesquisa Agropecuária Brasileira, v.18, p.1187-1198, 1983.
OLIVEIRA, R.C.; DI MAURO, A.O.; TREVISOLINI, S.H.U.; SANTOS, J.M.; OLIVEIRA, J.A.; PERECIN, D.; ARANTES, N.E. Progênies superiores de soja resistentes ao tipo 3 do nematóide de cisto da soja. Pesquisa Agropecuária Brasileira, v.40, p.745-751, 2005.
PAN, Z.; YANG, X.B.; PIVONIA, S.; XUE, L.; PASKEN, R.; ROADS, J. Long-term prediction of soybean rust entry into the continental United States. Plant Disease, v.90, p.840-846, 2006.
PARTON, W. J.; LOGAN, J. A. A model for diurnal variation in soil and air temperature. Agricultural and Forest Meteorology, v.23, p.205-216, 1981.
PAVAN, W. Uso de orientação a objetos no desenvolvimento de modelos de simulação de doenças de plantas genéricos. Revista Brasileira de Agroinformática, v.8, p.1-16, 2008.
PIVONIA, S., YANG, X.B. Assessment of potential year round establishment of soybean rust throughout the world. Plant Disease, v.88, p.523-529, 2004.
PIVONIA, S.; YANG, X. B. Relating epidemic progress from a general disease model to seasonal appearance time of rusts in the United States: implications for soybean rust. Ecology and Phytopathology, v.96, p.400-407, 2006.
SENTELHAS, P.C.; GILLESPIE, T.J.; MONTEIRO, J.E.B.M.; ROWLANDSON, T. Estimating leaf wetness duration on a cotton crop from meteorological data. Revista Brasileira de Agrometeorologia, v.12, p.235-245, 2004.
SENTELHAS, P.C.; MARTA, A.D.; ORLANDINI, S.; SANTOS, E.A.; GILLESPIE, T.J.; GLEASON, M.L. Suitabilty of relative humidity as an estimator of leaf wetness duration. Agricultural and Forest Meteorology, v.148, p.392-400, 2008.
TAN, Y.J.; YU, Z.; YANG, C.Y. Soybean rust. Beijing: China Agricultural Press, 1996. 99p.
TOMASELLA, J.; HODNETT, M. G.; ROSSATO, L. Pedotransfer functions for the estimation of soil water retention in Brazilian soils. Soil Science Society of America Journal, v.64, p.327-338, 2000.
VALE, F.X.R.; JESUS JÚNIOR, W.C.; ZAMBOLIM, L. Epidemiologia aplicada ao manejo de doenças de plantas. Belo Horizonte: Perfil Editora, 2004. 532p.
VASCONCELOS, E.S.; REIS, M.S.; CRUZ, C.D.; SEDIYAMA, T.; SCAPIM, C.A. Adaptability and stability of semilate and late maturing soybean genotypes in Minas Gerais state. Acta Scientiarum Agronomy, v. 32, p.411-415, 2010.
YANG, X.B.; ROYER, M.H.; TSCHANZ, A.T.; TSAI, B.Y. Analysis and quantification of soybean rust epidemics from 73 sequential planting experiments. Phytopathology, v.80, p.1421-1427, 1990.
YANG, X.B.; DOWLER, W.M.; TSCHANZ, A.T. A simulation model for assessing soybean rust epidemics. Journal of Phytopathology, v.133, p.187-200, 1991a.
YANG, X. B., DOWLER, W. M.; ROYER, M. H. Assessing the risk and potential impact of an exotic plant disease. Plant Disease, v.75, p.976-982, 1991b.
YEH, C.C.; SINCLAIR, J.B.; TSCHANZ, A.T. Phakopsora pachyrhizi: Uredial development, urediospore production and factors affecting teliospore formation on soybeans. Australian Journal of Agricultural, v.33, p.25-31, 1982.
YORINORI, J.T., PAIVA, W.M., COSTAMILAN, L.M., BERTAGNOLLI, P.F. Soyabean rust (Phakopsora pachyrhizi
Sydow): Identification and control. Londrina: EMBRAPA Soja, 2003. 25p. (Documentos Embrapa Soja)