Vol.54, n. 1: pp.35-44, January-February 2011
ISSN 1516-8913 Printed in Brazil BRAZILIAN ARCHIVES OF
BIOLOGY AND TECHNOLOGY
A N I N T E R N A T I O N A L J O U R N A L
Microbial Activity in Soil Cultivated with Different Summer
Legumes in Coffee Crop
Elcio Liborio Balota
*and Julio César Dias Chaves
Instituto Agronômico do Paraná; C. P.: 481; 86001-970; Londrina – PR - Brasil
ABSTRACT
A field experiment was conducted for ten years in a sandy soil in the north part of the Paraná State, Brazil. The soil samples were collected at 0-10 cm depth, both under the coffee canopy and in the inter row space between the coffee plants, in the following treatments: Control, Leucaena leucocephala, Crotalaria spectabilis, Crotalaria breviflora,
Mucuna pruriens, Mucuna deeringiana, Arachis hypogaea and Vigna unguiculata. The legume crops influenced the microbial activity, both under the coffee canopy and in the inter row space. The cultivation of Leucaena leucocephala increased the microbial biomass C, N and P. Although L. leucocephala and Arachis hypogaea
provided higher microbial biomass, the qCO2 decreased by up to 50% under the coffee canopy and by about 25% in
the inter row space. The soil microbial biomass was enriched in N and P due to green manure residue addition.
Key words: Microbial biomass, mulching, green manure, soil fertility
*Author for correspondence: [email protected]
INTRODUCTION
Large areas of soils cultivated with coffee (Coffea arabica L.) in the Paraná State are in a degradation process due to soil acidity, soil erosion, nutrient depletion by leaching, runoff and organic matter mineralization (Pavan et al., 1999). Agricultural practices that cultivate different plant species have been implemented, aiming to enhance the soil sustainability and to increase the microbial diversity. The use of legume species that are intercropped between the rows of coffee plants is a good alternative for the management of degraded soils, because it protects the soil from erosion, inhibits the growth of weeds and promotes soil nutrient cycling through the addition of plant residues (Chaves et al., 1997). Legumes are commonly employed in this practice as these plants present some interesting characteristics
including: a high amount of biomass, robust and deep root systems and the capacity of biologically fixing N2. These characteristics are important for
the protection of the superficial soil layer and for the extraction and immobilization of nutrients from the deeper soil layers.
process plays a fundamental role in the nutrient cycle and, consequently, in plant nutrition. Additionally, microbial biomass has been utilized as a sensitive indicator of alteration patterns in soil organic matter (Powlson et al., 1987; Sparling, 1997; Balota et al., 2003).
The objective of this work was to evaluate the microbial activity alteration due to different green manures cultivated between rows of coffee plants during the summer.
MATERIALS AND METHODS
The experiment was initiated in 1988 at Miraselva, in the north part of the Paraná State (22° 58’ S, 51° 29’ W), in a sandy Oxisol soil classified as Latossolo Vermelho distrófico according Brazilian Soil Classification (Bhering and Santos, 2008). This soil is categorized as having 80% of sand, 8% of silt and 12% of clay in the surface layer (0-10 cm). The experimental design was a randomized complete block, in three repetitions. The treatments included different summer legumes used as green manure cultivated between rows of coffee plants “Catuai cultivar”, as follows: Control, Leucaena leucocephala, Crotalaria spectabilis, Crotalaria breviflora, Mucuna pruriens, Mucuna deeringiana, Arachis hypogaea
and Vigna unguiculata. The legumes were sowed in the beginning of October and cut off at the flowering stage. Their residues were left on the soil surface to cover the soil and to decompose. In the control treatment, manual weeding was conducted throughout the year whenever necessary.
During the ten-year period of the experiment, two liming acidity corrections were made in the soil surface: the first occurred before experiment installation (1988) and the second in 1996. In both corrections, two tons of dolomitic limestone was applied per hectare. Annually, from September to March, mineral fertilizers (NPK) were applied under the coffeecanopy of the coffee plants. Each plant was supplied with 400g of ammonium sulfate, 60g of triple superphosphate and 100 g of potassium chloride. The N was parceled out four times, K was applied twice and P applied in just one dose.
The soil samplings were made in four seasons: pre-planting (September), after-planting (November), at the flowering stage (February) and
after plant cut off (April) of the legume cover crop, from 1997 to 1999. Five soil sub-samples were taken at a depth of 0-10 cm under the coffee canopy and in the center of the inter row space. The fresh soil samples were sieved through a 4 mm screen to remove all large plant material and were then stored at 4oC until the analysis for microbial and chemical characteristics. Chemical analyses were done according to Pavan et al. (1992). The microbial biomass C (MBC) was determined by the fumigation-extraction method according to Vance et al. (1987) using a correction factor (kEC) of 0.33. The microbial biomass N
(MBN) was determined by the method employed by Brookes et al. (1985) using a correction factor (kEN) of 0.54. The microbial biomass P (MBP) was
determined by fumigation-extraction according to the method of Brookes et al. (1984), using a 0.4 factor (kEP). The metabolic quotient (qCO2) was
obtained by dividing the respiration of the soil by the microbial biomass C (mg CO2-C g
-1
MBC d-1). All determinations were made in triplicates and expressed on a dry weight basis. Within each treatment the data were averaged over the four seasons and over the two years. Statistical analysis by ANOVA was conducted using the SAS statistical package (SAS Inst., 1998).
RESULTS AND DISCUSSION
Chemical Properties
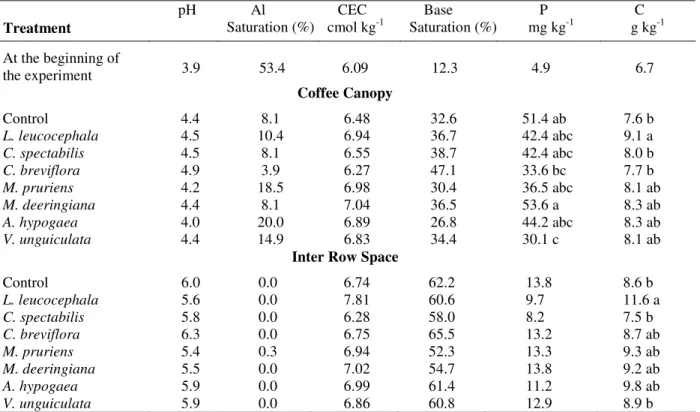
lime was applied on soil surface with high amount of plant residue serving as mulch, moved down to subsurface layers increasing pH and Ca and decreasing Al (Meda et al., 2001). The different green manure species had different effects on Al under the coffee canopy. The Al absence in the inter row space could be attributed to the pH increase, which reduces Al solubility by Al complexation with organic compounds (Miyazawa et al., 1992).
The soil P concentration presented high values under the coffee canopy, in the fertilized zone, where the P fertilizer was applied on the soil surface without mechanical incorporation. The continued application of P could cause it to accumulate with time. The increase in available P content in the control treatment was 950% under the coffee canopy and 180% in the inter row space, compared to the initial content (4.9 mg kg
-1
). The increase of the P concentration with time in the inter row space might have occurred due to the P cycle in coffee leaves as well as P redistribution into the undisturbed soil by different cover crops used as green manures (Franchini et al., 2004). All the treatments presented higher organic C content when compared with the values observed at the beginning of experiment. The increase in the control treatment (without green manure) was 13% under the coffeecanopy and 28% in the inter row space. The organic C increase might have happened due to the large number of coffee leaves (which were renewed every year), the root-coffee effect, or from the weeds that eventually grew in the inter row space. However, the cultivation of
L. leucocephala provided an increase in organic C of up to 35% under the coffee canopy and up to 73% in the inter row space, compared to initial value at the beginning of the experiment.
Table 1 - Soil chemical properties (0-10 cm depth) at the beginning of the experiment and after a 10 year period of cropping with summer legume green manures*.
Treatment
pH Al
Saturation (%)
CEC cmol kg-1
Base Saturation (%)
P mg kg-1
C g kg-1 At the beginning of
the experiment 3.9 53.4 6.09 12.3 4.9 6.7
Coffee Canopy
Control 4.4 8.1 6.48 32.6 51.4 ab 7.6 b
L. leucocephala 4.5 10.4 6.94 36.7 42.4 abc 9.1 a
C. spectabilis 4.5 8.1 6.55 38.7 42.4 abc 8.0 b
C. breviflora 4.9 3.9 6.27 47.1 33.6 bc 7.7 b
M. pruriens 4.2 18.5 6.98 30.4 36.5 abc 8.1 ab
M. deeringiana 4.4 8.1 7.04 36.5 53.6 a 8.3 ab
A. hypogaea 4.0 20.0 6.89 26.8 44.2 abc 8.3 ab
V. unguiculata 4.4 14.9 6.83 34.4 30.1 c 8.1 ab
Inter Row Space
Control 6.0 0.0 6.74 62.2 13.8 8.6 b
L. leucocephala 5.6 0.0 7.81 60.6 9.7 11.6 a
C. spectabilis 5.8 0.0 6.28 58.0 8.2 7.5 b
C. breviflora 6.3 0.0 6.75 65.5 13.2 8.7 ab
M. pruriens 5.4 0.3 6.94 52.3 13.3 9.3 ab
M. deeringiana 5.5 0.0 7.02 54.7 13.8 9.2 ab
A. hypogaea 5.9 0.0 6.99 61.4 11.2 9.8 ab
V. unguiculata 5.9 0.0 6.86 60.8 12.9 8.9 b
* pH: CaCl
2 0.01 M; CEC: Ca, Mg, Al, KCl 1.0 M; P: Mehlich; C: Organic C by Walkley-Black.
Microbial Biomass
The average values of microbial biomass obtained from the four seasons across two years showed that the cultivation of different summer green manure between the rows of coffee plants
(MBC) varied from 102 to 305 µg g-1 in the soil under the coffee canopy, and from 204 to 427 µg g-1 in the inter row space (Table 2). The cultivation of L. leucocephala provided higher MBC under both the coffee canopy and in the inter row space than did other legumes. The MBC under the coffee canopy was increased by up to 158% compared to control, and 199% compared to V.unguiculata. The MBC in the inter row space was increased up to 109% by L. leucocephala compared to the control.
The microbial biomass N (MBN) varied from 4.2 to 16.8 µg g-1 in the soil under coffee canopy and from 11.6 to 21.4 µg g-1 in the inter row space (Table 2). Under the coffee canopy, the cultivation of L. leucocephala and C. spectabilis increased the MBN by up to 89% compared to control, and by 300% compared to V. unguiculata. The MBN in the inter row space increased by up to 85% by both L. leucocephala and C. brevifora, when compared with the control.
Different from the MBC and the MBN, the microbial biomass P (MBP) presented higher values under the coffee canopy (from 3.1 to 6.3 µg g-1) than in the inter row space. The MBP varied from 2.1 to 5.0 µg g-1 in the inter row space (Table 2). The cultivation of L. leucocephala provided a higher MBP under the coffee canopy than did other legumes. The increase was up to 103% compared to the control, and by about 65% compared to C. breviflora and V.unguiculata. In the inter row space, the MBP was increased by up to 138%, due to L. leucocephala and M. deeringiana compared with the control.
The obtained microbial biomass values were consistent with other studies in many regions of the world that focused on a variety of factors, including soils, climates, and experimental conditions. Under temperate conditions, the microbial biomass ranged from 55 to 1627 g g-1 for C and from 20 to 248 g g-1 for N (Smith and Paul, 1990; Brookes et al. 1984) and from 5 to 300 g g-1 for P (Brookes et al. 1984; He et al. 1997). However, under Brazilian tropical/subtropical conditions, the microbial biomass presented a narrower range. For C, this range was 84 to 1300 g g-1 (Balota et al., 1998; D’Andréa et al., 2002), for N from 8 to 95 g g-1 (Balota et al., 2003; Duda et al., 2003), and for P from 4 to 60 g g-1 (Rheinheimer et al., 2000) under different soil management conditions.
The microbial biomass in the soil surface represents either a sink or source nutrients, depending on the soil management. In a system where the input of C is larger, a greater part of input is eventually held in the microbial biomass (Anderson and Domsch, 1986).
The higher microbial biomass of C, N and P observed under some treatments could be invariably due to the higher nutrient immobilization capacity of microbial community from the decomposing residues of the green manure. The input of organic matter into the soil creates a favorable environment for microbial activity, which increases the microbial biomass (Saffigna et al. 1989). The organic substances added to the soil are used as energy and nutrient sources for microorganisms. The large pieces of particulate detritus deposited at the soil surface protect microorganisms from adverse conditions and favor the growth of fungal. These green manures produce substantial portions of root biomass and exudates, which are left in the soil and work as important substrates for microbial growth in the soil. However, the role of the roots as a source of organic matter has not been well studied under tropical condition.
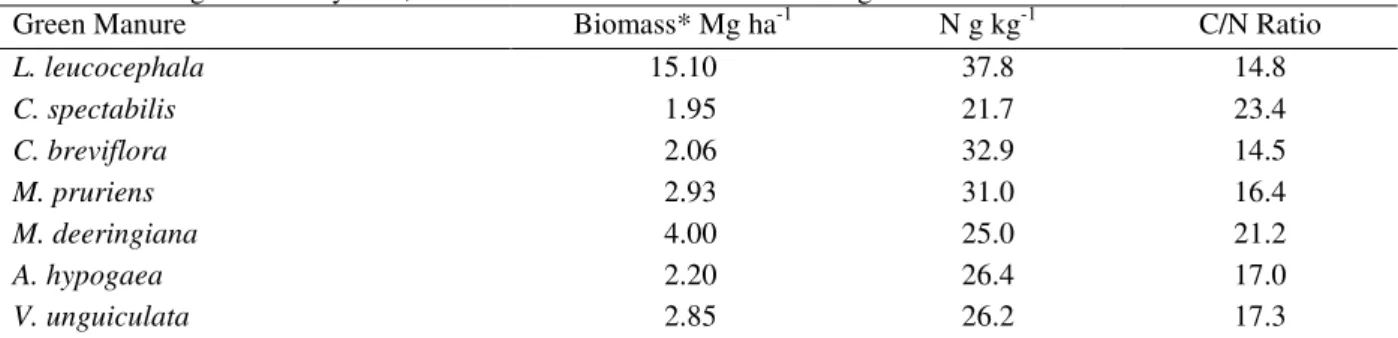
The cultivation of L. leucocephala provided higher microbial biomass C, N and P. This is likely due to the great amount of Leucaena residues input (15.1 Mg ha-1 year-1 of dry biomass) (Table 3). However, it was not only the amount of residue that influenced the microbial biomass; A. hypogaea
produced 25% less biomass yield (2.20 Mg ha-1 year-1) than M. pruriens did (2.93 Mg ha-1 year-1), even though A. hypogaea had about 40% higher MB than M. pruriens. Although the size of the soil microbial biomass is related to C input quantity and quality, other soil factors also have effects on the growth and activity of microorganisms. These factors can include the available nutrients, pH, substrate quality, water potential and soil aeration (Paul and Clark, 1996).
Table 2 - Microbial biomass C, N, and P under coffee canopy and in the inter row space as affected by different legumes green manures.
Green Manure
Microbial Biomass (µµµµg g-1 soil)
Carbon Nitrogen Phosphorus
Coffee Canopy
Control 118 bc 8.9 b 3.1 d
L. leucocephala 305 a 16.8 a 6.3 a
C. spectabilis 200 b 16.7 a 5.2 b
C. breviflora 168 b 11.1 b 3.8 c
M. pruriens 117 bc 10.7 b 4.3 bc
M. deeringiana 140 bc 11.4 b 4.2 bc
A. hypogaea 202 b 11.7 b 5.1 b
V. unguiculata 102 c 4.2 c 3.9 c
Inter Row Space
Control 204 c 11.6 c 2.1 c
L. leucocephala 427 a 21.4 a 5.0 a
C. spectabilis 257 bc 13.8 bc 2.9 bc
C. breviflora 325 b 20.4 a 3.6 b
M. pruriens 266 bc 14.3 bc 2.9 bc
M. deeringiana 323 b 19.6 ab 4.9 a
A. hypogaea 394 ab 18.6 ab 4.3 ab
V. unguiculata 231 bc 16.0 bc 3.1 bc
Means within a column of the same sampling position followed by a different lower case letter are significantly different at P≤ 0.05.
Table 3 - Average biomass yields, N content and C/N ratio of different green manure.
Green Manure Biomass* Mg ha-1 N g kg-1 C/N Ratio
L. leucocephala 15.10 37.8 14.8
C. spectabilis 1.95 21.7 23.4
C. breviflora 2.06 32.9 14.5
M. pruriens 2.93 31.0 16.4
M. deeringiana 4.00 25.0 21.2
A. hypogaea 2.20 26.4 17.0
V. unguiculata 2.85 26.2 17.3
* Dry weight of above ground plant material.
The microbial biomass has been used as an index of soil fertility. An increase in the size of soil microbial biomass is considered essential for the improvement of soil fertility (Sing et al., 2007). Due to its highly dynamic character, the microbial biomass responds more rapidly to soil changes than does the physical/chemical properties, which are relatively slow to change (Powlson et al., 1987; Anderson and Domsch, 1989; Sparling, 1997).
Microbial Biomass Ratio
The microbial biomass C:N ratio varied from 10 to 24 under coffee canopy and from 14 to 21 in the inter row space (Table 4). The cultivation of
V. unguiculata provided a higher ratio under the coffee canopy than in other treatments, which increased by 85% compared to control and by about 140% compared to M. pruriens. On the other hand, the treatment with V. unguiculata
presented a lower microbial C:N ratio in the inter row space compared to other treatments.
different C:N ratios occur as a result of changes in microbial composition during the decomposition of incorporated straw, reflecting a change in the pattern of microbial immobilization. Soil microbial biomass is composed of several groups of organisms. Each microbial group has a different C:N ratio and the predominance of one group
results in the prevalence of a particular ratio. Practices of placing straw at the soil surface stimulate the fungal population, while the incorporation of the straw into the soil shifts the food web towards bacterial dominance (Hendrix et al. 1986).
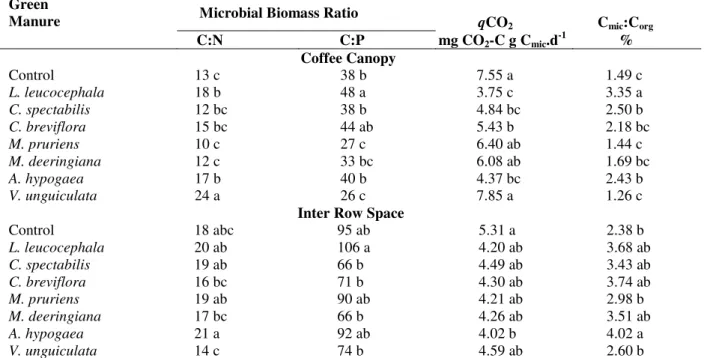
Table 4 - Microbial biomass C:N and C:P ratio, metabolic quotient (qCO2) and Cmic:Corg relationship under coffee
canopy and in the inter row space as affected by different legumes green manures.
Green
Manure Microbial Biomass Ratio qCO2 Cmic:Corg
C:N C:P mg CO2-C g Cmic.d-1 %
Coffee Canopy
Control 13 c 38 b 7.55 a 1.49 c
L. leucocephala 18 b 48 a 3.75 c 3.35 a
C. spectabilis 12 bc 38 b 4.84 bc 2.50 b
C. breviflora 15 bc 44 ab 5.43 b 2.18 bc
M. pruriens 10 c 27 c 6.40 ab 1.44 c
M. deeringiana 12 c 33 bc 6.08 ab 1.69 bc
A. hypogaea 17 b 40 b 4.37 bc 2.43 b
V. unguiculata 24 a 26 c 7.85 a 1.26 c
Inter Row Space
Control 18 abc 95 ab 5.31 a 2.38 b
L. leucocephala 20 ab 106 a 4.20 ab 3.68 ab
C. spectabilis 19 ab 66 b 4.49 ab 3.43 ab
C. breviflora 16 bc 71 b 4.30 ab 3.74 ab
M. pruriens 19 ab 90 ab 4.21 ab 2.98 b
M. deeringiana 17 bc 66 b 4.26 ab 3.51 ab
A. hypogaea 21 a 92 ab 4.02 b 4.02 a
V. unguiculata 14 c 74 b 4.59 ab 2.60 b
Means within a column of the same sample position followed by a different lower case letter are significantly different at P≤ 0.05.
The wider microbial C:N ratio under some treatments would suggest that these sites have a greater proportion of fungi compared to bacteria than others treatments. The C/N ratio of fungal biomass ranges from 4.5 to 15, while the C/N ratio of bacterial biomass typically ranges from 3 to 5 (Paul and Clark, 1996). The greater dominance of micro-fungal biomass in some treatments reflects the fact that large pieces of particulate detritus are deposited at the soil surface and this favors the growth of fungal. Reduced soil disturbance may favor the establishment and maintenance of fungal hyphae networks.
These differences in the microbial biomass ratios suggest that the composition of the soil microbial community, and the rate of immobilization and mineralization of soil nutrients may be affected by different green manures. The microbial biomass ratio (C:N and C:P) can be used to indicate the likely impact of the microbial biomass on the
availability of N and P in soil (He et al., 1997). Narrow C:N and C:P ratios show that the biomass is enriched in N and P, which has a high potential to release these nutrients by mineralization. On the other hand, wide ratios suggest the tendency for the biomass to immobilize more available nutrients from soil.
The microbial biomass C:P ratio varied from 26 to 48 under the coffee canopy and from 66 to 106 in the inter row space (Table 4). The cultivation of L. leucocephala provided a higher ratio under the coffee canopy than other treatments, which increased by 26% compared to the control and by about 85% compared to the M. pruriens and V. unguiculata treatments. In the inter row space, a higher microbial C:P ratio was also observed with
L. leucocephala cultivation.
systems and analytical procedures. However, under Brazilian tropical/subtropical conditions, the microbial biomass C:P ratio has been shown to vary from 14 to 45 (Balota et al. 2003; Duda et al,. 2003). These results have evidenced that soil management has a strong impact on microbial P incorporation. The lower microbial C:P ratio under the coffee canopy and the higher ratio in the inter row space confirmed previous observation that microbial C:P ratios depended strongly on the P status of the soil (Saffigna et al., 1989; Guerra et al. 1995; Conte et al., 2002). Under the coffee canopy, the average available P content was around 3.5 times higher than that in the inter row space. This higher P content could be providing the lower microbial C:P ratio under the coffee canopy, indicating that the microbial biomass in this position was significantly enriched in P, which had a high potential of release it by mineralization. According to He et al. (1997), where the C:P ratios are wide, there is a tendency for the biomass to immobilize more of the available P from soil. The microbial immobilization of P from P fertilizing is very important; mainly in the soils that have strong adsorption and occlusion of phosphate caused by Fe and Al oxides like in tropical and subtropical soils.
The metabolic quotient (qCO2) varied from 3.75 to
7.55 mg CO2-C g -1
MBC d-1 under the coffee canopy, and from 4.02 to 5.31 mg CO2-C g
-1
MBC d-1 in the inter row space (Table 4). The cultivation of L. leucocephala provided lower qCO2 under the
coffee canopy than in other treatments, with the
qCO2 decreasing by about 50% compared to the
control and to V. unguiculata. The inter row space
Arachis treatment showed lower qCO2 than in the
control. Although the Arachis hypogaea treatment presented higher microbial biomass, the qCO2 was
significant lower. This inverse relationship between the MBC and qCO2 was similar to that
obtained previously by Balota et al., (2004). These variations on qCO2 could be due to differences in
the accessibility of C substrates to the microorganisms, changes in the microbial metabolic rates and changes in the microbial community composition and physiological standards (Islam and Weil, 2000).
Results from the literature suggest that the qCO2
decreases in more stable systems. Therefore, an increase of MBC combined with a decrease of qCO2 suggested that the soil under L. leucocephala
and Arachis hypogaea was becoming more stable. The lower qCO2 values would suggest that these
green manures could provide a shift toward a more fungi-dominated microbial community. It has been suggested that soil management practices that allow plant residues to remain on the soil surface encourage fungal dominance (Islam and Weil, 2000). Fungi typically assimilate about 44% of readily decomposable C into biomass, while bacteria typically assimilate only about 32%. Bacterial communities are, therefore, less efficient at converting substrate C into cellular C compared to fungi (Islam and Weil, 2000).
In this context, the low value of qCO2 for some
treatments suggested that some legume green manure factors induced an increase in the efficiency of the use of C substrates by the soil microbial community. This has important implications for agriculture, because if less C is evolved from the soil, more C can be stored in soil organic matter.
The percentage of microbial biomass C to organic C (Cmic:Corg) varied from 1.26 to 3.35% in the soil
under the coffee canopy, and from 2.38 to 4.02% in inter row space (Table 4). The cultivation of L. leucocephala provided higher Cmic:Corg
relationship under the coffee canopy than in other treatments, with an increase of up to 145% compared to control and about 166% compared to
M. pruriens and V.unguiculata. Higher Cmic:Corg in
the inter row space was observed with the cropping of A. hypogaea, which increased by about 69% compared to the control.
The percentage of total C as MBC has been suggested as an indicator of whether soil organic matter is decreasing, increasing or is in a steady state (Anderson and Domsch, 1989). Changes in the Cmic:Corg relationshipmay be related to organic
matter formation and the efficiency of conversion of the recalcitrant C pools into MBC (Sparling, 1992). In general, there is a trend of increasing Cmic:Corg due to non-disturbance soil management
(Carter, 1986; Anderson and Domsch, 1989; Jenkinson and Ladd, 1981; Balota et al., 2004). However, the values have shown a wide range of variation from 0.3 to 5.4 (Anderson and Domsch, 1989). The wide range for this relationship suggests its high sensitivity to soil management, the sampling season of and analytical methods. According to Jenkinson and Ladd (1981), 2.2% is a threshold value for soil that is in equilibrium. Some treatments (Control, M. pruriens,
V. unguiculata) presented a percentage of Cmic:Corg
treatments presented an increase of organic C up to 21% over the initial content. The present results suggested that the percentage of Cmic:Corg under
tropical/subtropical conditions could have a different threshold as an indicator of C accumulation than in temperate regions.
Relationships between microbial biomass
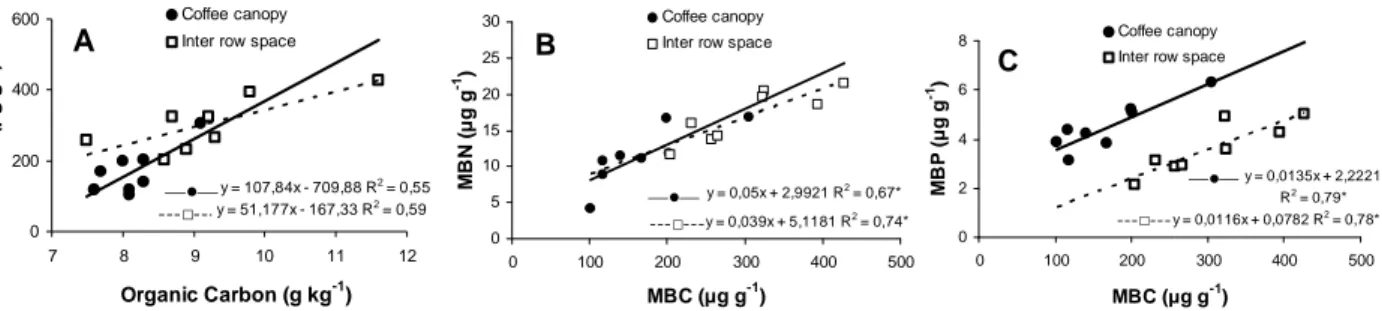
There were strong relationships between the microbial biomass C and soil organic C, as well as between the MBC with MBN and MBP (Figure 1). These results were similar to those obtained by
various authors (Brookes et al., 1984; Anderson and Domsch, 1989; Balota et al., 1998). Anderson and Domsch (1989), who studied 134 different agricultural soils under various long-term cropping systems, observed strong linear relationships between microbial and soil organic C. However, the regression lines differed in slope, being higher for soils that had received organic matter. According to Anderson and Domsch (1989), the higher relationship may be evidence that there is a higher level of labile organic matter.
y = 107,84x - 709,88 R2 = 0,55
y = 51,177x - 167,33 R2 = 0,59
0 200 400 600
7 8 9 10 11 12
Organic Carbon (g kg-1)
M
B
C
(
g
g
-1)
Coffee canopy Inter row space
A
---□ ---—●—
y = 0,039x + 5,1181 R2 = 0,74*
y = 0,05x + 2,9921 R2 = 0,67*
0 5 10 15 20 25 30
0 100 200 300 400 500
MBC ( g g-1)
M
B
N
(
g
g
-1 )
Coffee canopy Inter row space
B
---□---—●—
y = 0,0116x + 0,0782 R2 = 0,78*
y = 0,0135x + 2,2221
R2 = 0,79*
0 2 4 6 8
0 100 200 300 400 500
MBC ( g g-1)
M
B
P
(
g
g
-1)
Coffee canopy
Inter row space
C
---□---—●—
Figure 1 - Relationship between soil organic carbon and microbial biomass C (A), and microbial biomass C with microbial biomass N (B) and with microbial biomass P (C) under coffee canopy and inter row space. * Significative at 5% of probability.
The significant relationship between the microbial biomass with organic C is likely due to higher organic matter levels that support higher microbial biomass that has more activity. This suggests that microbial biomass compartments are interconnected with soil C cycling.
There was no correlation between the microbial biomass P and the available P. This lack of correlation confirmed the view of Brookes et al. (1984) that this fraction was not determined by the size of the microbial P pool. However, under Brazilian tropical conditions, increases of MBP due to addition of P into the soil have been observed (Guerra et al., 1995; Conte et al., 2002). Conte et al. (2002) suggested that this increase in MBP could be due to the combination of a recent addition of phosphate fertilizer with a great addition of C from the previous crop residues. Also, there was neither relationship between the microbial biomass and the quantity of the green manure biomass nor the N and P concentration.
These results showed that green manures affected the soil, not only due to the quantity of residues and nutrient content, but also due to other organic compounds released by the shoot and root system. It has to be pointed out that these organic compounds released by the root system are easily degraded to be used as an energy source in microbial growth.
CONCLUSION
ACKNOWLEDGEMENTS
The authors thank the Brazilian Consortium for Coffee Research (CBP&D Café) for financial support.
REFERENCES
Anderson, T.-H.; Domsch, K.H. (1989), Ratios of microbial biomass carbon to total organic carbon in arable soils. Soil Biol. Biochem. 21, 471-479. Balota, E.L.; Colozzi-Filho, A.; Andrade, D.A.; Dick,
R.P. (2003), Microbial biomass in soils under different tillage and crop rotation systems. Biol Fertil Soils, 38: 15-20.
Balota, E.L.; Colozzi-Filho, A.; Andrade, D.A.; Dick, R.P. (2004), Long-term tillage and crop rotation effects on microbial biomass and C and N mineralization in a Brazilian Oxisol. Soil Tillage Research, 77: 137-145.
Balota, E.L.; Colozzi-Filho, A.; Andrade, D.S.; Hungria, M. (1998), Biomassa microbiana e sua atividade em solos sob diferentes sistemas de preparo e sucessão de culturas. R. Bras. Ci. Solo, 22, 641-649. Bhering, S.B.; Santos, H.G. (2008), Mapa de solos do
estado do Paraná: Legenda atualizada. Rio de Janeiro: Embrapa Florestas: Embrapa Solos: Instituto Agronômico do Paraná, 2008. 74p.
Brookes, P.C.; Powlson, D.S.; Jenkinson, D.S. (1984), Phosphorus in the soil microbial biomass. Soil Biol. Biochem, 16(2): 169-175.
Brookes, P.C.; Landman, A.; Pruden, G.; Jenkinson, D.S. (1985), Chloroform fumigation and the realease of soil nitrogen: a rapid direct extraction method to measure microbial biomass nitrogen in soil. Soil Biol Biochem, 17:837–842.
Carter, M.R. (1986). Microbial biomass as an index for tillage-induced changes in soil biological properties.
Soil Till. Res., 7, 29-40.
Chaves, J.C.D.; Pavan, M.A.; Calegari, A. (1997), Adição de matéria seca e nutrientes através da utilização de plantas para cobertura em culturas perenes e seus efeitos sobre a reação do solo. Arq. Biol. Tecnol., 40: 47-44.
Conte, E.; Anghinoni, I.; Rheinheimer, D.S. (2002), Fósforo da biomassa microbiana e atividade de fosfatase ácida após aplicação de fosfato em solo no sistema plantio direto. R. Bras. Ci. Solo, 26:925-930. D’Andréa, A.F.; Silva, M.L.N.; Curi, N.; Siqueira, J.O.;
Carneiro, M.A.C. (2002), Atributos biológicos indicadores da qualidade do solo em sistemas de manejo na região do cerrado no sul do Estado de Goiás. R. Bras. Ci. Solo, 26: 913-923.
Duda, G.P.; Guerra, J.MG.; Monteiro, M.T.; De-Polli, H.; Teixeira, M.G. (2003), Perennial herbaceous legumes as live soil mulches and their effects on C, N and P of the microbial biomass. Sci. Agric., 60: 139-147.
Franchini, J.C.; Pavan, M.A.; Miyazawa, M. (2004), redistribution of phosphorus in soil through cover crop roots. Braz. Arch. Biol. Technol., 47: 381-386. Guerra, J.G.M.; Fonseca, M.C.C.; Almeida, D.L.;
De-Polli, H.; Fernandes, M.S. (1995), Conteúdo de fósforo da biomassa microbiana de um solo cultivado com Brachiaria decumbens Stapf. Pesq. Agropec. Bras., 30:543-551.
He, Z.L Wu, J.; O´Donnel, A.G.; Syers, J.K. (1997), Seasonal responses in microbial biomass carbon, phosphorus and sulphur in soils under pasture. Biol. Fertil. Soils, 24: 421-428.
Hendrix, P.F.; Parmellee, R.W.; Crossley, D.A.Jr.; Coleman, D.C.; Odum, E.P.; Groffman, P.M. (1986), Detritus food webs and conventional and no-tillage agroecosystems. BioScience, 21: 211-390.
Islam, K.R.; Weil, R.R. (2000), Soil quality indicator properties in mid-Atlantic soils as influenced by conservation management. J. Soil Water Conserv., First Quarter: 69-78.
Jenkinson, D.S.; Ladd, J.N. (1981), Microbial biomass in soil: Measurement and turnover. In: Paul, E.A., Ladd, J.M. (Eds.) Soil Biochemistry, 5. NewYork, Marcel Decker, pp. 415-471.
Joergensen, R.G.; Kübler, H.; Meyer, B.; Wolters, V. (1995), Microbial biomass phosphorus in soils of beech (Fagus sylvatica) forests. Biol. Fertil Soils,
19:215-219.
Meda, A.R.; Cassiolato, M.E.; Pavan. M.A.; Miyazawa, M. (2001), Alleviating soil acidity through plant organic compounds. Braz. Arch. Biol. Technol., 44: 185-189.
Miyazawa, M.; Chierice, G.O.; Pavan, M.A. (1992), Amenização da toxidade de alumínio às raízes do trigo pela complexação com ácidos orgânicos. R. Bras. Ci. Solo,15: 209-215.
Miyazawa, M.; Pavan M.A.; Franchini, J.C. (2002), Evaluation of plant residues on the mobility of surface applied lime. Braz. Arch. Biol. Technol., 45: 251-256.
Paul, E.A.; Clark, F.E. (1996), Soil Microbiology and Biochemistry. Academic Press, San Diego, p.340. Pavan, M.A.; Bloch, M.de F.; Zempulski, H. da C.;
Miyazawa, M.; Zocoler, D.C. (1992), Manual de análise química de solo e controle de qualidade. Londrina, IAPAR, 40p. (Circular Técnica, 76). Pavan M.A.; Chaves, J.C.D.; Siqueira, R.; Andocioli
Powlson, D.S.; Brookes, P.C.; Christensen, B.T. (1987), Measurement of soil microbial biomass provides an early indication of changes in the total soil organic matter due to straw incorporation. Soil Biol. Biochem., 19, 159-164.
Rheinheimer, R.S.; Anghinoni, I.; Conte, E. (2000), Fósforo da biomassa microbiana em solos sob diferentes sistemas de manejo. R. Bras. Ci. Solo,
24:589-597.
Rovira, A.D.; Elliott, L.F.; Cook, R.J. (1990), The impact of cropping systems on rhizosphere organisms affecting plant health. In: Lynch, J.M. (Ed.) The Rhizosphere, Wiley Series in Ecological and Applied Microbiology, New York. p.389-436.
Saffigna, P.G.; Powlson, D.S.; Brookes, P.C.; Thomas, G.A. (1989), Influence of sorghum residues and tillage on soil organic matter and soil microbial biomass in an Australian Vertisol. Soil Biol. Biochem., 21, 759-765.
Sing, S.; Ghoshal, N.; Singh, K.P. (2007), Variations in soil microbial biomass and crop roots due to to differing resource quality in a tropical dryland agroecosystem. Soil Biol. Biochem., 39: 76-86.
Smith, J.L.; Paul, E.A. (1990), The significance of microbial biomass estimations. In: Bollag, J.M., Stozky, G. (Eds.) Soil Biochemistry. New York, Marcel Decker. pp. 357-396.
Sparling, G.P. (1992), Ratio of microbial biomass carbon to soil organic carbon as a sensitive indicator of changes in soil organic matter. Aust. J. Soil Res.
30, 195-207.
Sparling, G.P. (1997), Soil microbial biomass, activity and nutrient cycling as indicators of soil health. In: Pankhurst, C., Doube, B.M., Gupta, V.V.S.R. (Eds) Biological Indicators of Soil Health. CAB International. pp. 97-119.
Vance, E.D.; Brookes, P.C.; Jenkinson, D.S. (1987), An extraction method for measuring soil microbial biomass carbon. Soil Biol. Biochem., 19, 703-707.