Extraction yield, antioxidant activity andphenolics from grape,
mango and peanut agro-industrial by-products
Rendimento de extração, atividade antioxidante e compostos fenólicos dos subprodutos agro industriais de uva, manga e amendoim
Gilberto Costa BragaI Priscilla Siqueira MeloII Keityane Boone BergamaschiII Ana Paula TiveronII Adna Prado MassarioliII Severino Matias de AlencarII ISSN 1678-4596
ABSTRACT
The objective of this study was to determine and correlate the extraction yields, antioxidant activity, total phenolics
and total flavonoids from grape, mango and peanut agro-industrial by-products. The β-carotene/linoleic acid autoxidation system and scavenging capacity for DPPH and ABTS free radicals assays were used. The results were expressed in terms of lyophilized sample or dry extract. Mango bagasse exhibited the highest extraction yield (37.07%) followed by peanut skin (15.17%) and grape marc (7.92%). In terms of lyophilized sample, total phenolics did not vary significantly among the residues evaluated (average of 60.33mg EAG g-1); however, when they were expressed as dry extract grape
marc exhibited the highest total phenolic (768.56±116.35mg GAE g-1), followed by peanut skin (404.40±13.22mg GAE g-1)
and mango bagasse (160.25±4.52mg GAE g-1), Peanut skin
exhibited the highest content of total flavonoids (2.44mg QE g-1),
while grape marc (1.76mg QE g-1) and mango bagasse (1.70 mg
QE g-1) showed no significant differences. The extraction yield
showed strong negative linear correlation with total phenolic and total flavonoid. This study showed that peanut skin was the sample with the highest antioxidant activity and it was strongly influenced by total flavonoids. All extracts of byproducts showed antioxidant activity comparable to α-tocopherol, and they can be
a source of natural compounds with potential to replace synthetic
antioxidants such as BHT.
Key words: total phenolics, total flavonoids, ethanolic extraction.
RESUMO
O objetivo deste estudo foi determinar e correlacionar os rendimentos de extração, atividade antioxidante, compostos
fenólicos totais e flavonoides de subprodutos agroindustriais de uva, manga e amendoim. A autoxidação do sistema β-caroteno/ ácido linoleico e a capacidade de sequestro dos radicais DPPH
e ABTS foram os ensaios antioxidantes utilizados. Os resultados foram expressos com base na amostra liofilizada ou no extrato seco. O bagaço de manga apresentou o maior rendimento de extração (37,07%) seguido da película de amendoim (15,17%) e bagaço de uva (7,92%). Em termos de amostra liofilizada, o teor de fenólicos totais não variou significativamente entre os resíduos avaliados (média de 60,33mg EAG g-1), entretanto, quando foi expresso
com base no extrato seco, o bagaço de uva exibiu o maior teor de fenólicos totais (768,56±116,35mg EAG g-1), seguido da película
de amendoim (404,40±13,22mg EAG g-1) e bagaço de manga
(160,25±4,52 mg EAG g-1). Apelícula de amendoim apresentou o
maior conteúdo de flavonoides totais (2,44mg EQ g-1), enquanto
os bagaços de uva (1,76mg EQ g-1) e de manga (1,70mg EQ
g-1) não mostraram diferenças significativas. O rendimento de
extração mostrou fortes correlações lineares negativas como teor de fenólicos totais e flavonoides totais. Este estudo mostrou que a películade amendoim foi o material que apresentou a maior atividade antioxidante e isso foi fortemente influenciado por flavonoides totais. Os extratos avaliados mostraram atividade antioxidante comparável à do α-tocoferol, com potencial para substituir antioxidantes sintéticos, tais como o BHT.
Palavras-chave: fenólicos totais, flavonoides, extração etanólica.
INTRODUCTION
The agro-industrial activities have generated large quantities of waste, by-products or residual biomasses which are considered potential sources of antioxidants, including phenolic compounds (SÓJKA et al., 2013). This is especially
significant in Brazil, since our economy is strongly
ICentro de Ciências Agrárias, Universidade Estadual do Oeste do Paraná (Unioeste), Campus de Marechal Cândido Rondon, 1777, 85960-000,
Marechal Cândido Rondon, PR, Brasil. E-mail: gcb1506@gmail.com. Corresponding author.
IILaboratório de Bioquímica e Análise Instrumental, Departamento de Agroindústria, Alimentos e Nutrição (LAN), Escola Superior de
Agricultura “Luiz de Queiroz” (ESALQ), Universidade de São Paulo (USP), Piracicaba, SP, Brasil.
based on agribusiness, representing around 25% of
the Gross Domestic Product (GDP). According to
FAO (2013), the world’s production of mangoes, grapes and peanuts is about 43, 77 and 35 million tonnes annually, respectively. For mangoes, by-products represent 35-60% of the total weight of the fruit, while 16% represent grapes and 3%
peanuts. Based on these percentages, a large
amount of waste is produced in the world annually.
MIRABELLA et al. (2014) reported that 81% of
food waste is produced by households and food manufacturing industry.
The use of residual biomasses as a source of antioxidant compounds can be a viable economic alternative because it reduces disposal costs and adds value to the by-product. Phenolic compounds are secondary metabolites derived from plants and are present in several parts, such as barks, seeds and pulps of fruits, and can be an alternative antioxidant agent against oxidative deterioration of foods. They also play an important functional role in human
body, minimizing oxidative damage at the cellular level (BABBAR et al., 2011).
Synthetic antioxidants such as
butyl-hydroxytoluene (BHT) are added in foods, but its
use has been questioned because of its toxicity
(BABBAR et al., 2011). For this reason, studies
on alternative natural antioxidants have been the subject of several studies. Recent studies have been conducted on the potential recovery of phenolic compounds and antioxidant activity in agro-industrial by-products of kinnow mandarin, litchi,
peanut, grape and banana (BABBAR et al., 2011; MELO et al., 2015; OLDONI et al., 2016), guava (MELO et al., 2011) and mango (DORTA et al., 2012). By-products of the fruits-processing industry
consist of non-used parts of raw materials, such as bark and seed of fruits, and it has been shown that they generally contain high amounts of phenolic compounds (MELO et al., 2011).
Studies have shown that different vegetables usually exhibited different extraction
yields (SPIGNO & DE FAVERI, 2007; BABBAR
et al., 2011). Extraction yield and purity of the extracts can be greatly influenced by processing
and plant species. However, the relationship
between extraction yield, phenolic content and antioxidant activity may reveal the true biological value of plant extracts. The objective of this study was to determine and correlate extraction yield, total phenolics, total flavonoids and antioxidant activity from grape, mango and peanut agro-industrial by-products.
MATERIALS AND METHODS
The agro-industrial by-products grape marc, mango bagasse and peanut skin were used
in this study. Grape marc (bark and stems) ‘Pinot
Noir’(Vitis vinifera) was obtained from wine
processing, mango bagasse (bark and seed) ‘Tommy
Atkins’ (Mangifera indica) was obtained from juice processing and peanut skin (Arachis hypogaea) was obtained from blanching process. All by-products
were obtained in Brazilian agro-industries in 2012. All samples were immediately frozen upon arrival in the laboratory and then lyophilized (Liotop L
101) and stored at -24°C.
The lyophilized samples were ground
in a bench-top mill (IKA A11) and extracted with 80% ethanol (80:20v/vin water) in a sample: solvent ratio of 1:10 (w/v) according to MELO et al. (2011). The extraction was conducted in an ultrasonic bath (Ultracleaner 1400A, 180 Watts) at room temperature for 15 minutes. The extract was centrifuged (Eppendorf 5810R) at 5000 x g for 15 minutes and the supernatant collected. The residue from each sample was extracted twice more. Three replicates were conducted for each sample.
The extraction yield (mg of dry extract
per g of lyophilized sample) was determined. A
portion of each ethanolic extract were evaporated
(Buchi R-215) under vacuum at 40°C and then dried in an air oven at 105ºC for 3 hours. The final
dry weight was used to calculate extraction yield. For other parts of the extracts, the total phenolic contents (mg g-1) were analyzed using Folin-Ciocalteu colorimetric method (SINGLETON
et al., 1998) and values were expressed as gallic
acid equivalents (GAE). Total flavonoid content
was determined by using a colorimetric method
described by CHANG et al. (2002) and the values
were expressed as mean (mg g-1) in quercetin equivalents (QE). The ABTS [2,2’-azino-bis-(3-ethylbenz-thiazoline-6-sulfonic acid)] antioxidant
activity assay was performed according to RE et
al. (1999) and values expressed as mean (μg g-1)
in terms of Trolox equivalents (TE).The DPPH
(2,2-diphenyl-1-picrylhydrazyl-hydrate) radical
scavenging ability was determined according to MENSOR et al. (2001) and expressed as the
efficient concentration at 50% (EC50), i.e., the
concentration (mg mL-1) of the test solution required
to give a 50% decrease in the absorbance of the test solution compared to that of a blank solution
at 517nm (Shimadzu, UVmini-1240). The DPPH
expressed as Trolox equivalents (μg TE g-1). The β-carotene/linoleic acid model system assay was
performed as described by EMMONS et al. (1999).
Oxidation of β-carotene/linoleic acid emulsion was
monitored at 470nm and the antioxidant activity was expressed as percent inhibition relative to the control after 120min of incubation. Sample extracts were evaluated at a concentration of
100μg mL-1. BHT and α-tocopherol (100μg mL-1)
were used as standards.
One-way analysis of variance (ANOVA) was used to analyze significant differences between by-products. When a significant difference was
found, the Tukey’s test was used to identify the
categories that differed from one another. Differences between means at the 95% (P<0.05) confidence level were considered statistically significant.
Correlations were obtained by Pearson’s correlation
coefficient (r). All results were expressed as mean
±SD (standard deviation) for three replications. Statistical analysis was conducted using SAEG version 9.1 (Viçosa, Brazil).
RESULTS AND DISCUSSION
Extraction yields of by-product samples
were expressed as mg of dry extract per g of lyophilized sample and are presented in figure 1. Results showed
that grape marc, peanut skin and mango bagasse showed different amounts of extractable soluble compounds, and it was an expected result. The highest extraction yield was exhibited by mango bagasse (370.65mg g-1)and it was approximately 2.5 times
higher than peanut skin (151.70mg g-1) and 4.5 times
higher than grape marc (79.15mg g-1). BABBAR et al. (2011) evaluated the influence of different plant
residues on extraction yield and observed that the
type of residue was more influential than the solvent
system on extraction yield.
Contents of total phenolic compounds and
total flavonoids were expressed in mg g-1 (in terms of
lyophilized sample and dried extract) and the results
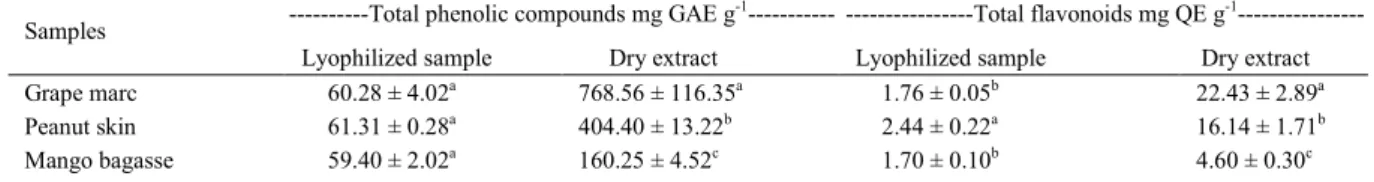
are presented in table 1. Total phenolic compounds
extracted from lyophilized samples did not vary significantly (P<0.05) among residues evaluated,
showing an average content of 60.33mg EAG g-1. However, when measured in terms of dry extract, grape
marc exhibited the highest content of total phenolic
compounds (768.56±116.35mg GAE g-1) followed by
peanut skin and mango bagasse (404.40±13.22 and
160.25±4.52mg GAE g-1, respectively). According
to SANT’ANNA et al. (2012), these results refer to soluble or extractable polyphenols, which are low or intermediate molecular mass phenolics, since they were extracted with aqueous ethanol. This result showed that the dry extract of grape marc is the purest
between the by-products tested. SPIGNO & DE FAVERI (2007) evaluated agro-industrial residues and also reported different extraction yields. During
grape fermentation process for wine production, different soluble compounds, such as sugars, are degraded or converted to other substances (LÓPEZ et al., 2008), but for processing of mango and peanut just the blanching process is done and their residues (bagasse and skin, respectively) are not fermented or extracted with solvents, and it may explains the lower content of non-phenolic soluble compounds reported in grape marc sample. Other non-phenolics soluble compounds, such as sugars, organic acids and proteins can also be present in plant extracts, and it can affect the extraction yield and the purity of the extract. MARTIN et al. (2012) reported contents of
total phenolic compounds of 229.2 mg GAE g-1 (dry
sample) in grape marc ‘Pinot Noir’, and this value was
higher than the reported in this research (Table 1). In other reseaches, contents of total phenolics of 58mg
GAE g-1 in mango bagasse ‘Uba’ (VIEIRA et al., 2008)
and 79.36mg GAE g-1 in peanut skin (CAMARGO et
al., 2012) have also been reported, and they are close to the values reported in this research. In terms of dry
extract, THIMOTHE et al. (2007) reported in grape marc ‘Pinot Noir’ a total phenolic compounds of
618.0 mg GAE g-1 in ethanolic dry extract, a result
close to that observed in this research.
According to table 1, the content of total
flavonoids (in terms of lyophilized sample) of the
peanut skin (2.44±0.22mg QE g-1) was significantly
higher than the grape marc (1.76±0.05mg QE g-1)
and mango bagasse (1.70±0.10mg QE g-1) and these
results were not correlated with total phenolics.
However, in terms of dry extract, grape marc showed the highest content of total flavonoids (22.43±2.89 mg QE g-1) followed by peanut skin and mango bagasse
(16.14±1.71 and 4.60±0.30mg QE g-1, respectively).
A strong linear correlation (r=0.96, P<0.01) was reported between total flavonoids and total phenolic
compounds, suggesting that 96% of the variation of
total flavonoids may be explains by variation of total
phenolics compounds.
Negative Pearson’s linear correlations between
extraction yield and total phenolics (r=-0.91, P<0.01) and between extraction yield and total flavonoids (r=-0.98,
P<0.01) were reported. Therefore, the highest extraction yields showed high levels of non-phenolics groups in the extract samples, rather than phenolic groups. In fact, the extraction of phenolic compounds from vegetable matrices is very dependent on chemical
composition of the sample, as well as of the affinity
between chemical compounds present in the sample and the solvent used (MELO et al., 2011).
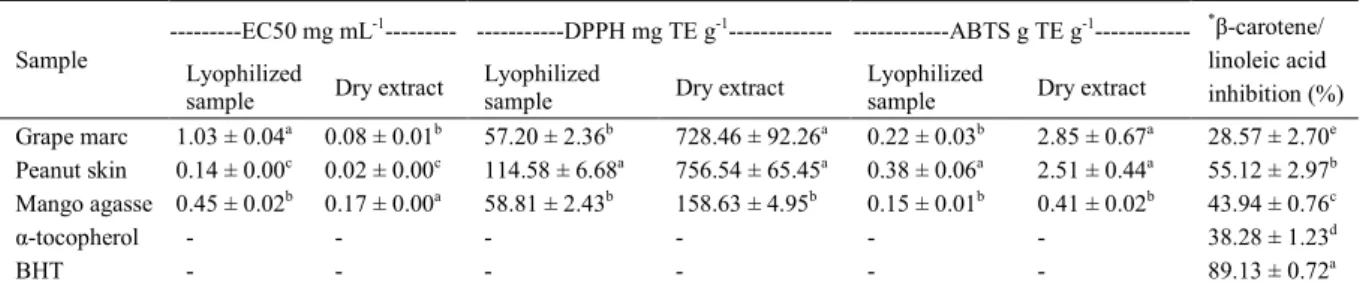
According to table 2, peanut skin showed an antioxidant activity higher than the mango bagasse for all tested assays, but in terms of dry extract
peanut skin and grape marc showed no significant differences, except for DPPH (728.46±92.26 and
756.54±65.45mg TE g-1, respectively) and ABTS
(2.85±0.67 and 2.51±0.44g TE g-1, respectively) antioxidant assays. In terms of lyophilized
extract, linear correlations between antioxidant activities and total phenolics were not reported, and it suggested that the sum of free phenolic compounds of by-products did not explain their
antioxidant activity. However, there was a positive
Table 1 - Total phenolic compounds and total flavonoids of the agro-industrial by-products expressed in terms of dry extract and lyophilized sample.
---Total phenolic compounds mg GAE g-1--- ---Total flavonoids mg QE g-1
---Samples
Lyophilized sample Dry extract Lyophilized sample Dry extract Grape marc 60.28 ± 4.02a 768.56 ± 116.35a 1.76 ± 0.05b 22.43 ± 2.89a
Peanut skin 61.31 ± 0.28a 404.40 ± 13.22b 2.44 ± 0.22a 16.14 ± 1.71b
Mango bagasse 59.40 ± 2.02a 160.25 ± 4.52c 1.70 ± 0.10b 4.60 ± 0.30c
Means followed by the same letter in a column are not significantly different at P<0.05. Means ± SD (n=3). GAE: Gallic acid equivalent.
correlation between total flavonoids and DPPH
(r2=0.93, P<0.01) and between total flavonoids and
ABTS (r2=0.92, P<0.01) and there was a negative
correlation between total flavonoids and EC50 (r2=
-0.68, P<0.05) for all by-products. This suggested that the highest antioxidant activity of the peanut
skin lyophilized sample (Table 2) can be explained by their higher total flavonoids content (Table 1). In this case, there is evidence that species of flavonoids
present in peanut skin has higher antioxidant activity than other classes of phenolic compounds. Conversely, a positive association between total phenolics and antioxidant activity of vegetables
has been reported (MELO et al., 2011). SPIGNO & DE FAVERI (2007) reported that the degree of
correlation depends on the class of compounds and it is generally higher for total phenolic contents than
for anthocyanins and flavonoids.
When evaluated in terms of dry extract,
the linear correlations between total flavonoids and
EC50 (r2=-0.71, P<0.05). DPPH (r2=0.92, P<0.01)
and ABTS (r2=0.95, P<0.01) were higher than
the correlations between the total phenolics and EC50 (r2=-0.49, P<0.05). DPPH (r2=0.78, P<0.01)
and ABTS (r2=0.87, P<0.01), and it showed that
the discrepancy between the antioxidant activity and the phenol contents can be attributed to the differences in phenol species, i.e., both phenolic species and concentration can interfere with the biological activity of plant extracts (SAITO et al., 2008). The antioxidant activity of plant extracts is attributed to their different chemical compositions (SAITO et al., 2008), but cannot be just predicted in terms of their total phenolic contents because the synergism between phenolics and other substances present in the extract may contribute to global
antioxidant activity of the sample. GONZÁLEZ & GONZÁLEZ (2010) reported that the presence
of large amount of non-phenolic substances can interfere in both phenolic concentration and antioxidant activity analysis. In fact, different plant matrices can exhibit different antioxidant activities according to the antioxidant vitamins and phenolics. According to table 2, the inhibitory capacity of the peanut skin (55.12±2.97%) was higher than the mango bagasse (43.94%±0.76%),
grape marc (28.57±2.70%) and α-tocopherol (38.28%±1.23%), but was lower than the BHT
(89.13%±0.72%). Toxicological parameters
applied to the synthetic antioxidants; therefore,
phenolics may be used in higher concentrations, and
this can enhance their antioxidant efficacy. Thus,
due to the large amount of by-products generated from agro-industries, peanut skin, mango bagasse and grape marc may be a very inexpensive source of extracts rich in natural bioactive compounds.
In fact, this can ensure a similar effect to BHT, besides promoting beneficial effects on health. The β-carotene oxidation inhibitory capacity from grape marc extract was reported by NEGRO et al.
(2003) and they reported increasing of inhibition with the increasing of extract concentration.
CONCLUSION
This study showed that the dry extract of grape marc was the purest in terms of total phenolics. A negative correlation between extraction yield and total phenolics of the extract was reported. Peanut skin showed the highest antioxidant activity and this was strongly correlated with total flavonoids.
Table 2 - Antioxidant activity of the agro-industrial by-products expressed in terms of dry extract and lyophilized sample.
---EC50 mg mL-1--- ---DPPH mg TE g-1--- ---ABTS g TE g-1
---Sample Lyophilized
sample Dry extract
Lyophilized
sample Dry extract
Lyophilized
sample Dry extract
*β-carotene/
linoleic acid inhibition (%) Grape marc 1.03 ± 0.04a 0.08 ± 0.01b 57.20 ± 2.36b 728.46 ± 92.26a 0.22 ± 0.03b 2.85 ± 0.67a 28.57 ± 2.70e
Peanut skin 0.14 ± 0.00c 0.02 ± 0.00c 114.58 ± 6.68a 756.54 ± 65.45a 0.38 ± 0.06a 2.51 ± 0.44a 55.12 ± 2.97b
Mango agasse 0.45 ± 0.02b 0.17 ± 0.00a 58.81 ± 2.43b 158.63 ± 4.95b 0.15 ± 0.01b 0.41 ± 0.02b 43.94 ± 0.76c
α-tocopherol - - - 38.28 ± 1.23d
BHT - - - 89.13 ± 0.72a
Means followed by the same letter in a column are not significantly different at P<0.05. Means ± SD (n=3). TE: Trolox equivalent.
[α-tocopherol], [BHT] and [*extract] = 100µg mL-1
ACKNOWLEDGMENTS
The authors acknowledge to the Departament of Agri-Food Industry. Food and Nutrition/ESALQ/USP for the research infrastructure provided and Fundação de Amparo à Pesquisa do Estado de São Paulo (FAPESP, Grants #2008/55492-7 and 2011/12640-9) for the financial support.
REFERENCES
BABBAR, N. et al. Total phenolic content and antioxidant capacity of extracts obtained from six important fruit residues. Food Research International, v.44, n.1, p.391-396, 2011. Available from: <http://www.sciencedirect.com/science/article/pii/ S0963996910003625>. Accessed: Sept. 09, 2014. doi: 10.1016/j. foodres.2010.10.001.
CAMARGO, A.C. de et al. Gamma radiation effects on peanut skin antioxidants. International Journal of Molecular Sciences, v.13, n.3, p.3073-3084, 2012. Available from: <http://www.mdpi. com/1422-0067/13/3/3073/htm>. Accessed: Oct. 14, 2014. doi: 10.3390/ijms13033073.
CHANG, C.et al. Estimation of total flavonoid content in propolis by two complementary colorimetric methods. Journal of Food and Drug Analysis, v.10, n.3, p.178-182, 2002. Available from: <http://www.fda.gov.tw/files/publish_periodical/10-3-9.pdf>. Accessed: Oct. 14, 2014.
DORTA, E. et al. Reutilization of mango byproducts: study of the effect of extraction solvent and temperature on their antioxidant properties. Journal of Food Science, v.77, n.1, p.C80-C88, 2012. Available from: <http://www.ncbi.nlm. nih.gov/pubmed/22132766>. Accessed: Sept. 30, 2014. doi: 10.1111/j.1750-3841.2011.02477.x.
EMMONS, C.L. et al. Antioxidant capacity of oat (Avena sativa
L.) extracts. 2. In vitro antioxidant activity and contents of phenolic and tocol antioxidants. Journal of Agricultural and Food Chemistry, v.47, n.12, p.4894-4898, 1999. Available from: <http://dx.doi.org/10.1021/jf990530i>. Accessed: Oct. 14, 2014. doi: 10.1021/jf990530i.
FAO STAT. FAO statistical database, 2013. Available from: <http:// faostat3.fao.org/download/Q/QC/E>. Accessed: Ago. 17, 2015.
GONZÁLEZ, M.; GONZÁLEZ, V. Sample preparation of tropical and subtropical fruit biowastes to determine antioxidant phytochemicals. Analytical Methods, v.2, n.12, p.1842-1966, 2010. Available from: <http://pubs.rsc.org/en/Content/ ArticleHTML/2010/AY/C0AY00361A>. Accessed: Oct. 14, 2014. doi: 10.1039/c0ay00361a.
LÓPEZ, N. et al. Effects of pulsed electric fields on the extraction of phenolic compounds during the fermentation of must of Tempranillo grapes. Innovative Food Science & Emerging Technologies, v.9, n.4, p.477-482, 2008. Available from: <http://www.sciencedirect. com/science/article/pii/S146685640700166X>. Accessed: Oct. 14, 2014. doi: 10.1016/j.ifset.2007.11.001.
MARTIN, J.G.P. et al. Antimicrobial potential and chemical composition of agro-industrial wastes. Journal of Natural Products, v.5, p.27-36, 2012. Available from: <http:// journalofnaturalproducts.com/Volume5/5_Res_paper-4.pdf>. Accessed: Ago. 11, 2014.
MELO, P.S. et al. Phenolic composition and antioxidant activity of agroindustrial residues. Ciência Rural, v.41, n.6, p.1088-1093, 2011. Available from: <http://www.scielo.br/scielo. php?script=sci_arttext&pid=S0103-84782011000600027&lng= en&nrm=iso&tlng=pt>. Accessed: Oct. 14, 2014. doi: 10.1590/ S0103-84782011000600027.
MELO, P.S. et al. Winery by-products: extraction optimization, phenolic composition and cytotoxic evaluation to act as a new source of scavenging of reactive oxygen species. Food Chemistry, v.18, p.160-169, 2015. Available from: <http://www.sciencedirect.com/science/article/pii/ S0308814615002770#>. Accessed: Ago. 22, 2015. doi: 10.1016/j.foodchem.2015.02.087
MENSOR, L.L. et al. Screening of Brazilian plant extracts for antioxidant activity by the use of DPPH free radical method. Phytotherapy Research, v.15, n.2, p.127-130, 2001.Available from: <http://www.ncbi.nlm.nih.gov/pubmed/11268111>. Accessed: Mar. 11, 2015. doi: 10.1002/ptr.687.
MIRABELLA, N. et al. Current options for the valorization of food manufacturing waste: a review. Journal of Cleaner Production, v.65, p.28-41, 2014. Available from: <http://www.sciencedirect. com/science/article/pii/S0959652613007440#>. Accessed: Ago. 17, 2015. doi: 10.1016/j.jclepro.2013.10.051.
NEGRO, C. et al. Phenolic compounds and antioxidant activity from red grape marc extracts. Bioresource Technology, v.87, n.1, p.41-44, 2003. Available from: <http://www.sciencedirect.com/ science/article/pii/S096085240200202X>. Accessed: Oct. 14, 2014. doi: 10.1016/S0960-8524(02)00202-X.
OLDONI, T.L.C. et al. Bioassay-guided isolation of proanthocyanidins with antioxidant activity from peanut
(Arachishypogaea) skin by combination of chromatography
techniques. Food Chemistry, v.192, p.306-312, 2016. Available from: <http://www.sciencedirect.com/science/article/pii/ S0308814615010092>. Accessed: Ago. 22, 2015. doi: 10.1016/j. foodchem.2015.07.004.
RE, R. et al. Antioxidant activity applying an improved ABTS radical cation decolorization assay. Free Radical Biology and Medicine, v.26, n.9-10, p.1231-1237, 1999. Available from: <http:// www.sciencedirect.com/science/article/pii/S0891584998003153>. Accessed: Ago. 11, 2014.
SAITO, K. et al. Extensive screening for edible herbal extracts with potent scavenging activity against superoxide anions. Plant Foods for Human Nutrition, v.63, n.2, p.65-70, 2008. Available from: <http://www.ncbi.nlm.nih.gov/pubmed/18236159>. Accessed: Oct. 10, 2014. doi: 10.1007/s11130-008-0071-2.
SANT’ANNA, V. et al. Kinetic modeling of total polyphenol extraction from grape marc and characterization of the extracts. Separation and Purification Technology, v.100, p.82-87, 2012. Available from: <http://www.sciencedirect.com/science/ article/pii/S1383586612004686>. Accessed: Ago. 22, 2015. doi:10.1016/j.seppur.2012.09.004.
SÓJKA, M. et al. Polyphenolic and basic chemical composition of black chokeberry industrial by-products. Industrial Crops and Products, v.51, p.77-86, 2013. Available from: <http://www.sciencedirect.com/science/ article/pii/S0926669013004688>. Accessed: Oct. 14, 2014. doi: 10.1016/j.indcrop.2013.08.051.
SPIGNO, G.; FAVERI, D.M. de. Antioxidants from grape stalks and marc: influence of extraction procedure on yield, purity and antioxidant power of the extracts. Journal of Food Engineering, v.78, n.3, p.793-801, 2007. Available from: <http://www.sciencedirect.com/science/article/ pii/S026087740500779X>. Accessed: Oct. 13, 2014. doi: 10.1016/j.jfoodeng.2005.11.020.
THIMOTHE, J. et al. Chemical characterization of red wine grape (Vitis vinifera and Vitis interspecific hybrids) and
pomace phenolic extracts and their biological activity against Streptococcus mutans. Journal of Agricultural and Food Chemistry, v.55, n.25, p.10200-10207, 2007. Available from: <http://dx.doi.org/10.1021/jf0722405>. Accessed: Nov. 14, 2014. doi: 10.1021/jf0722405.