M
ETHODOLOGICALA
RTICLE Revista Brasileira de FisioterapiaPain
Locus
of control scale: adaptation and
reliability for elderly
Escala de
Locus
de controle da dor: adaptação e confiabilidade para idosos
Louise G. Araújo1, Débora M. F. Lima2, Rosana F. Sampaio3, Leani S. M. Pereira3
Abstract
Background: Pain is considered a multidimensional experience and is very common in the elderly. The pain locus of control has become essential to understand how the perceptions, expectations and beliefs are related to individual behavior, attitudes, coping and adherence of the elderly with regards to the health conditions and with the proposed treatment. Studies focused on adaptation and reliability of instruments are necessary for health professionals. Objectives: The present study performed the cross-cultural adaptation of the Pain Locus of Control Scale (C form of Multidimensional Health Locus of Control) for Brazil and assessed its intra and inter-examiner reliability among a sample of 68 elderly individuals with non-oncological pain living in the community. Methods: The cross-cultural adaptation of the scale was performed using the methodology standardized by Beaton et al. (2000)*. Pearson’s correlation coefficient (PCC) and the intraclass correlation coefficient (ICC) were used for the statistical analysis (p≤0.05). Results: Average age of the subjects was 69.6 ± 5.5 years; most were women, with low levels of income and education. The average pain duration was 10.2 years and the main clinical diagnosis was osteoarthritis. The reliability of the scale was adequate, with a regular to very strong correlations (PCC = 0.60 to 0.93) and a moderate to nearly perfect ICC (0.60 to 0.93), in mainly the chance locus of control and medical and healthcare professionals locus of control subscales. Conclusion: An adequate reliability and applicability was observed in our sample after adjustments and adaptations of the scale for use in elderly
Key words: pain control; reliability; cross-cultural adaptation; elderly.
* Beaton DE, Bombardier C, Guillemin F, Ferraz MB. Guidelines for the process of cross-cultural adaptation of self-report measures. Spine (Phila Pa 1976). 2000;25(24):3186-91.
Resumo
Contextualização: A dor é considerada uma experiência multidimensional e muito prevalente em idosos. O locus de controle da dor tem se tornado fundamental para entender como percepções, expectativas e crenças individuais se relacionam a comportamentos, atitudes, enfrentamento e aderência dos idosos frente às condições de saúde e propostas de tratamento. Estudos focados na adaptação e confiabilidade de instrumentos são necessários para os profissionais de saúde. Objetivos: Realizar a adaptação transcultural, para o Brasil, do instrumento Pain Locus of Control Scale (forma C da Multidimensional Health Locus of Control ) e avaliar sua confiabilidade intra e interexaminadores em uma amostra de 68 idosos comunitários, com dor crônica não oncológica. Métodos: A adaptação transcultural da escala foi feita conforme metodologia padronizada por Beaton et al. (2000)*. Para análise estatística, foram usados os coeficientes de correlação de Pearson (CCP) e de correlação intraclasse (CCI) (p≤0.05). Resultados: A média de idade dos idosos foi de 69,6±5,5 anos, predominando mulheres, de baixa renda e escolaridade. O tempo médio de evolução da dor foi de 10,2 anos, e o principal diagnóstico clínico foi a osteoartrite. A confiabilidade da escala mostrou-se adequada com correlação de regular a muito forte (CCP=0,60 a 0,93) e de moderada a quase perfeita (CCI =0,60 a 0,93), principalmente nas subescalas de controle ao acaso e de profissionais médicos e de saúde. Conclusão: Após as adaptações e as adequações da escala para aplicação em idosos, verificou-se sua aplicabilidade e confiabilidade adequadas na amostra estudada.
Palavras-chave: controle da dor; confiabilidade; adaptação transcultural; idosos.
* Beaton DE, Bombardier C, Guillemin F, Ferraz MB. Guidelines for the process of cross-cultural adaptation of self-report measures. Spine (Phila Pa 1976). 2000;25(24):3186-91.
Received: 18/09/2009 – Revised: 02/02/2010 – Accepted: 30/04/2010
1 Department of Physical Therapy, Centro Universitário de Belo Horizonte (UniBH), Belo Horizonte (MG), Brazil 2 Physical Therapist
3 Department of Physical Therapy, School of Physical Education, Physical Therapy and Occupational Therapy, Universidade Federal de Minas Gerais (UFMG), Belo Horizonte (MG), Brazil
Correspondence to: Louise Guimarães de Araújo, Rua Perdigão, 67, Apto 404, Fernão Dias, CEP 31910-190, Belo Horizonte (MG), Brasil, email: [email protected]
Introduction
Estimates indicate that 80% of elderly have health prob-lems that predispose them to the development of chronic pain. Brazilian population data showed that over 60% of elderly re-ported chronic diseases which cause pain1. In American
physi-cal therapy clinics, 50% of patients were elderly who reported pain as the main complaint2.
Impacts of chronic pain on quality of life of the elderly are associated with depression, disability and mortality3. he high
prevalence of chronic pain requires the use of greater inancial and health resources, which relects negatively on health sys-tems, on the individual and on the society4.
he most used approach for the treatment of chronic pain is medication. In the elderly, some limitations of this therapy deserve consideration: the high cost, the frequent side efects and lower eiciency in improving symptoms. hese limitations stimulate the search for other approaches, such as physical therapy, psychotherapy and behavioral therapy5,6.
Pain is considered as a multidimensional experiencel4.
Studies related to the experience of persistent pain point to the need of considering a biopsychosocial perspective for evalu-ation and treatment. In this model, the psychosocial factors interact with the biological ones5,7.
Among the most widely used instruments to assess pain, there are the Visual Analogue Scale (VAS) and McGill Pain Questionnaire. he VAS is a unidimensional measure of pain intensity8. he McGill Pain Questionnaire, although
multidi-mensional (assessing properties, quality, spatial distribution and pain intensity), does not address the individual’s expecta-tions and beliefs regarding pain. Instruments focused on these factors are necessary when considering their interference on individual’s attitudes toward the proposed treatment9.
Evidence show that psychological factors seem to inter-fere more strongly than social, demographic and physical factors on the painful experiences and they show to be im-portant mediators in the treatment of chronic pain. Previous studies, with multivariate statistical analysis in adults and el-derly with chronic pain, concluded that psychological factors (perception of pain control, feeling of incapacity in dealing with pain and passive coping strategies) are associated with depression, poorer quality of life, with functional disability and pain intensity10-12.
According to the factors related to pain, stands the percep-tion of pain control, the locus of control (LC), based on social learning theory13. he theory argues that, based on personal
previous experiences, people acquire a perception of pain control that can be inluenced by new experiences14. he pain
LC has become critical to understand how the perceptions, ex-pectations and beliefs relate to individual behavior, attitudes,
coping and adherence of older people facing their health con-ditions and proposed treatment14.
here are two forms which the individuals may experi-ence predominantly who or what has control of the events of their life: internally (the individuals realize that life events are controlled by themselves) or externally15. External factors are
divided into chance control (the individual realizes that life events are controlled by factors such as chance, luck or fate) or powerful people (the individual realizes that whoever controls the events are health professionals, family and others)14,15.
Based in this theory, Wallston, Wallston and De Vellis15
for-mulated the Multidimensional Heath Locus of Control (MHCL) scale (A and B forms), developed to evaluate LC of general states of health. hese forms have been translated and adapted for Brazil and its psychometric properties have already been tested in the Brazilian population16,17. he A and B forms are
more appropriate to observe the perception of LC of general states of health, limiting their observation to speciic health conditions, such as cancer and pain18-20.
Due to the need for adaptation of the A and B forms to assess pain, the author of the original scale proposed the development of a C form20. his scale aims to classify the location in which
individuals realize predominantly who or what stops the control of their pain. Factor analysis of the main components of this new scale revealed four dimensions: internal LC, chance LC, other people LC ( friends and family), doctor and health professional LC20. here were no other published studies that have
cross-culturally adapted and evaluated the psychometric properties of this new speciic scale for pain and/or elderly in Brazil. Studies indicate that individuals who perceive pain control externally have greater functional disability, exhibit more psychological changes, use more health services and more often use coping strategies, such as catastrophic thoughts, prayers, and reduced activities17,21. In contrast, individuals who have a sense of internal
LC describe pain with less frequency and intensity, have higher pain threshold, better functionality and use coping strategies fo-cused on the problem. hey also show less psychological altera-tions, greater social integration, more adherence to orientation treatments and better health conditions22,23.
Although the LC is identiied as relevant and widely studied19,21 in Brazil, in the literature review carried out for the
present study, few studies that use the construct of health and pain LC16,17 were found. No published study, methodologically
standardized, of translation and cross-cultural adaptation and about the reliability analysis about the C form scale for the as-sessment of pain LC in the Brazilian elderly was found.
Behavioral therapy is based on teaching individuals cogni-tive and behavioral strategies to control pain; inform about the efect of speciic strategies (thoughts, beliefs and attitudes), emotions ( fear of pain) and behaviors (avoiding activities due
to fear of pain) and emphasize the primary role that they have to control pain and their adaptation against pain2.
Behavior therapy may be comparable with physical therapy performance because both promote adoption of strategies of self-management for the treatment of pain24. Knowing the pain
LC of patients allow the physical therapist and other health professionals to motivate the modiication of inadequate be-haviors and the use of speciic coping skills, which inluences in the improvement of adherence to exercises and of the func-tional capacity9.
he aim of this study was to perform the translation and cross-cultural adaptation of the Pain Locus of Control Scale (C form)for Brazilian elderly with chronic pain, living in the com-munity, and to assess its intra and inter-examiner reliability.
Methods
his study was approved by the Ethics in Research Commit-tee of he Universidade Federal de Minas Gerais (UFMG), Belo Horizonte (MG), Brazil (ETIC 110/06). Sixty eight community Brazilian seniors with chronic nonmalignant pain, persistent for more than three months and aged over 60 years partici-pated: 30 seniors in the pilot phase to observe the applicability of the scale and 38 during the reliability analysis. Participants were recruited from outpatient services Clinics School of Belo Horizonte (MG), Brazil.
Individuals with acute pain, with visual and/or hearing deicits and those with cognitive impairment assessed by Mini-mental State Examination (Brazilian version)25 were excluded.
Instruments
For sample characterization, a structured questionnaire developed by the authors, containing sociodemographic and clinical data was applied.
he scale translated and adapted for the Brazilian elderly population used in this study was the C form of the Multidi-mensional Heath Locus of Control (MHCL)scale, which showed acceptable psychometric properties in the original study in a American sample (n=588) composed by adults: internal con-sistence with Cronbach’s alpha greater than 0.7 in all subscales. he test-retest reliability, with an interval of six weeks, through the Pearson’s Correlation Coeicient (PCC), showed correla-tions from regular (r=0.40) to strong (r=0.80)20.
Following the recommendation of the author the applica-tion of the scale was performed by replacing the word health with the word pain. he scale has 18 items divided into four subscales, which correspond to the factors measured by the instrument: internal LC perception (6 items), chance LC (6
items), doctors and health professionals LC: (3 items) and oth-ers LC (3 items)20. Considering the low education level of the
Brazilian elderly, after authorization by the author of the origi-nal scale, it was applied as an interview, and were used only four options of answers: “strongly disagree” (1 point), “slightly dis-agree“ (2 points), “slightly agree” (3 points) and “strongly agree” (4 points), unlike the original scale which includes six options. Each subscale receives an independent score, ranging from 6 to 24 (internal and chance LC subscales) and from 3 to 12 (health professionals and others LC subscales). Each subscale can be applied separately and the higher its score, the higher is the LC dimension. he predominant perceptions of pain control were analyzed considering the subscales with higher scores.
Procedures
After the author’s authorization for the cross-cultural adap-tation of the scale and the informed consent form was signed by the participants, the study was divided into two phases. he irst phase took place the process of translation and cross-cultural adaptation of the scale, following the methodology proposed by Beaton et al.26, which comprises the following
steps: translation, synthesis of translations, back translation, discussion with a committee of specialists and application of the pre-inal version of the scale (pilot phase). In the pilot phase, the pre-inal version was applied to 30 seniors. On that oppor-tunity, some expressions were found diicult to understand by the participants. hey were again submitted for analysis of the expert committee.
he interdisciplinary discussion with the participants of the committee, two doctors (anesthesiologists and geriatricians), a psychologist, a physiotherapist, a methodologist of the scien-tiic research, a translator and back translator, helped in solving the semantic, idiomatic, cultural and conceptual discrepancies between the original and adapted version of the scale. After this second discussion, the inal version was established to col-lect data for reliability analysis (Appendix 1). Discussion with the expert committee culminated in suggestions to facilitate understanding of the scale by the elderly: initial explanation on how to complete the scale, permission for the spontaneous speech of the elderly after reading each item and use of a visual scale with the four options of answers.
he explanation on how to complete the scale was per-formed as following: prior to the application, it was explained to the participants that there was no right or wrong answers and that, agreeing or not, would depend on their individual experi-ences related to pain. he permission of the seniors’ spontane-ous speech, after reading each item by the examiner, facilitated the understanding. At that moment, the elderly, through previ-ously experienced situations and repeating phrases with other
words, they understood better the item and chose answers more safely. For example, during the completion of item 6: “I am directly responsible for my pain getting better or worse”, af-ter reading the sentence, the examiner asked the participants: “Do you think that you can improve or worsen your pain? Give me an example.
When using the visual scale with the response options for the score of each item, after reading the sentence, the partici-pants were asked whether they agreed or not with the item. From that irst answer, the visual scale with four options (writ-ten in letter size 18 and diferent colors) were read and shown to the participant to select the inal answer.
he evaluations were performed at oice with only the presence of the examiner and the participant. Two examiners, previously trained, were responsible for data collection.
In the second phase of the study concerning the analysis of intra and inter-reliability, the scale was applied indepen-dently and blinded to the previous result. For the analysis of inter-examiner reliability, the participant attended on the irst day of evaluation, and the two examiners applied the scale at diferent moments.
For the analysis of intra examiner reliability, the participant returned in a second day of evaluation, in a maximum interval of ive days and answered the scale to the same examiner. No additional treatment could be initiated during the period be-tween the two evaluations. he maximum interval of ive days was adopted based on the availability of the participant and in order to avoid changes on the perception of the pain LC.
Statistical analysis
Data on the sample characteristics were analyzed using measures of central tendency and dispersion and frequency distribution based on the distribution of each variable.
Pearson’s correlation coeicient (PCC) and the intraclass correlation coeicient (ICC) were used for the reliability analy-sis. For the PCC analysis, the sample size calculation indicated the need for 22 seniors and for the ICC analysis, the need of 28 seniors. he calculations considered correlation (PCC) and reli-ability (ICC) coeicients equal or higher than 0.5, using two re-peated measures, a power of 80% and a signiicance level of 5%. he interpretation of the results obtained for the ICC was based on the cutofs suggested by Landis and Koch27:
below 0 = poor; 0 to 0.20 = weak; 0.21 to 0.40 = regular; 0.41 to 0.60 = moderate; 0.61 to 0.80 good and 0.81 to 1 = nearly perfect27. For the interpretation of the PCC results, the criteria
adopted was the one suggested by Tiboni28: r=0.0 (no
correla-tion); 0.1 to 0.3 (weak); 0.31 to 0.6 (regular); 0.61 to 0.9 (strong), 0.91 to 0.99 (very strong) and 1.0 (perfect)28.
Results
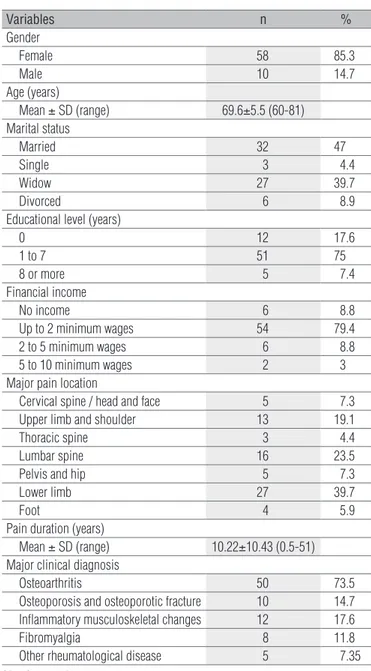
he mean age was 69.6±5.5 (range from 60 to 81) years. he clinical and social-demographic data can be observed in the Table 1.
he results show higher levels of reliability on the subscales of chance LC and doctors and health professionals LC. he subscale that showed lower reliability was others LC as family and friends.
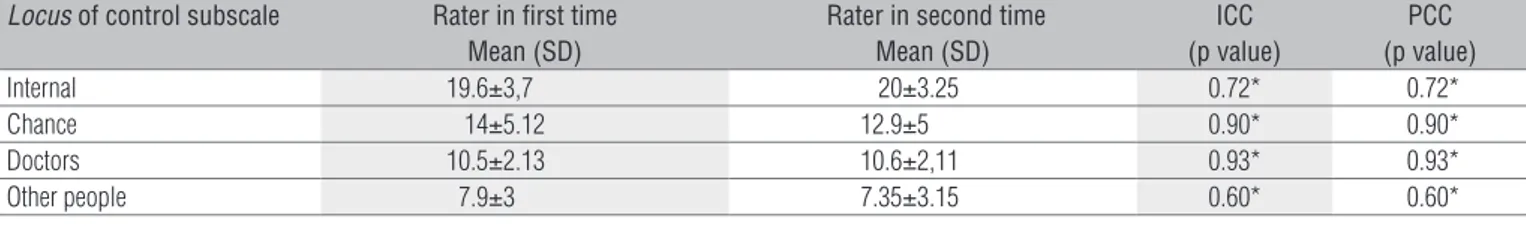
he mean values for each subscale in both evaluations to demonstrate the intra and inter reliability with the PCC and the ICC can be observed in Tables 2 and 3.
In implementing the irst version of the scale, 53.4% re-ported reasonable diiculty and 20%, a lot of diiculty in
Variables n %
Gender
Female 58 85.3
Male 10 14.7
Age (years)
Mean ± SD (range) 69.6±5.5 (60-81) Marital status
Married 32 47
Single 3 4.4
Widow 27 39.7 Divorced 6 8.9 Educational level (years)
0 12 17.6
1 to 7 51 75
8 or more 5 7.4 Financial income
No income 6 8.8 Up to 2 minimum wages 54 79.4 2 to 5 minimum wages 6 8.8 5 to 10 minimum wages 2 3 Major pain location
Cervical spine / head and face 5 7.3 Upper limb and shoulder 13 19.1 Thoracic spine 3 4.4 Lumbar spine 16 23.5 Pelvis and hip 5 7.3 Lower limb 27 39.7
Foot 4 5.9
Pain duration (years)
Mean ± SD (range) 10.22±10.43 (0.5-51) Major clinical diagnosis
Osteoarthritis 50 73.5 Osteoporosis and osteoporotic fracture 10 14.7 Inflammatory musculoskeletal changes 12 17.6 Fibromyalgia 8 11.8 Other rheumatological disease 5 7.35
Table 1. Clinical and social-demographic characteristics of the studied sample (n=68).
SD = Standard Deviation.
Locus of control subscale Rater in first time
Mean (SD)
Rater in second time Mean (SD)
ICC (p value)
PCC (p value)
Internal 19.6±3,7 20±3.25 0.72* 0.72* Chance 14±5.12 12.9±5 0.90* 0.90* Doctors 10.5±2.13 10.6±2,11 0.93* 0.93* Other people 7.9±3 7.35±3.15 0.60* 0.60*
Table 2. Results from the intra rater reliability analysis through the Pearson’s Correlation Coefficients (PCC) and Intraclass Correlation Coefficients (ICC).
* p<0.0001. SD = Standard Deviation.
completing the scale. After the adjustments suggested by the expert committee, the results indicated that 42% reported no diiculty; 31.6%, reasonable, 26.4%, little diiculty and no el-derly reported lot of diiculty.
Discussion
During the translation and back translation process, a dii-culty observed, already reported in the literature, was the choice of synonyms for terms that were adjectives or described feelings, as the terms: a big role and plays a big part29.Considering that
some terms have no equivalents in Portuguese, it was necessary a translation based on the context. Faced with the diiculty of literal translation, the subjectivity of the construct assessed by the scale and characteristics of the sample, Brazilian elderly, in which emotional and cognitive peculiarities rules are inherent to the aging process, it became indispensable an adaptation in the application of the scale. his allowed spontaneous speech and examples by the elderly for the choice of answers. his form of application facilitated the understanding of items for this spe-ciic population.
he accomplishment of a pilot phase (application of the scale in 30 seniors), before establishing the inal version, has strengthened the importance of this stage as well as the dis-cussion with the expert committee in the translation process and adaptation of instruments. It is recommended that the application of the scale in the elderly do the following steps: explanation about on how to complete the scale, permission of spontaneous speech and use of a visual scale by the elderly for the choice of answers. In this sense, Scherest, Fay and Zaidi30
Locus of control subscale Rater 1
Mean (SD)
Rater 2 Mean (SD)
ICC (p value)
PCC (p value)
Internal 20±3.8 19.7±4,5 0.77* 0.79* Chance 13.5±5.4 14.1±5.26 0.90* 0.90* Doctors 10.9±2.8 11±1.88 0.80* 0.81* Other people 7.9±3.15 6.9±3.11 0.72* 0.72*
Table 3. Results from the inter-rater reliability analysis through the Pearson’s Correlation Coefficients (PCC) and Intraclass Correlation Coefficients (ICC).
* p<0.0001. SD = Standard Deviation.
point that, often, it is more important to explain the meaning of an expression than to try pair synonymous words30.
he reliability of the subscales measured by the instrument shown to be adequate with intra and inter reliability in at least moderate for ICC and regular to very strong for the PCC. he comparison of the observed results with the one of other stud-ies was limited due to the diferent forms of reliability analysis suggested by the literature. Most of them evaluated the reliabil-ity of the scale using only an internal consistency of the A or B forms of the MHLC scale16, 21. Wallston, Stein and Smith20 used
the C form of the scale, as in this study for analysis of test-retest reliability in a population of young well-educated, with various types of chronic nonmalignant pain. hese authors observed a PCC ranging from regular to strong in the subscales in an interval of six weeks: r=0.80 in internal LC subscale, r=0.72 in chance LC, r=0.58 in doctors and health professionals LC and r=0.40 in others LC20.
In the present study, there were observed higher correla-tions in the PCC when compared to the study of Wallston, Stein and Smith20. hese diferences may be related to the
interval between the administrations of the scale that, in the present study, was a maximum of ive days and, in the earlier study, six weeks. Wallston, Stein and Smith20 justify that the
interval of six weeks among the applications might have inlu-enced the perceptions of control sources by the participants, interfering in the reliability20. hese indings strengthen the
evidence, already reported by other authors, that the pain LC is a subjective construct that can therefore be inluenced by new experiences21, 22.
In this study, there was a greater reliability of answers in subscales chance and doctors and health professionals LC and
a lower reliability on the subscales of internal and others LC. Although no studies that discuss these diferences was found, these indings may be related to events, lived daily experiences and experiences reported by the elderly that seem to inluence the perceptions of pain control.
During the second administration of the scale for the in-tra examiner reliability analysis, which allowed an interval of until ive days among the applications, objective situations were consciously reported: three elderly noticed the diference in choice of answers provided to the examiner and justiied with happened events. One of them reported to carry exces-sive weight and have done a lot of cleaning at home, another reported to have a pleasurable social contact with a neighbor, and the other reported to have an argument with family mem-bers. hese facts even trivial may have inluenced the choice of answers and relected in a lower reliability of the subscales that assess the pain perception of internal and other LC.
he number of items contained in the others LC subscale (three items) may have inluenced the lower reliability in the answers, as has already been pointed in another study20.
How-ever, this justiication must be interpreted cautiously because lower reliability was not observed in the subscale doctors and health professionals, which also has three items.
With regards to the factors that seem to inluence the belief of chance and doctors and health professionals LC, it was not allowed to start new treatments or medical consultations in the interval between applications. No participant reported dif-ferent facts from those of the irst assessment that might have inluenced their beliefs.
Although the literature indicates that the intra examiner reliability is, in most studies, better than the inter examiner reli-ability, in the present study, this result was diferent. his result may have been inluenced by the interval between applications
to reliability analysis: applications were on the same day for analysis of inter examiners, with an interval of approximately 60 minutes and it was allowed a maximum of ive days between applications for analyzing the intra examiner. he interval of ive days may have provided the occurrence of events in the participants’ lives that inluenced the reliability estimates of the subscales. It is emphasized that this is a multidimensional scale in which daily situations that relect on the emotional response possibly impact on the elderly answers. In this study, even with diferent scores on the subscales between the two evaluations, the elderly continued to be classiied with the same preferential belief with regards to pain control.
In this study, it was observed that the form of application of the scale, allowing the elderly report and using the visual scale for the choice of answers, contributed to the observed consis-tency and the reliability indexes.
Some limitations of this study deserve consideration. he sample was recruited by convenience and there was clinical het-erogeneity of the elderly, which may have afected the results.
Conclusions
he study showed the applicability of the pain LC scale in a community sample of elderly with chronic pain. he use of this scale will increase the knowledge of pain LC of elderly allow-ing thus a more appropriate approach to chronic pain among this population. his study should be viewed as an initial mark towards the development the version of the instrument Pain Locus of Control (PLOC-C) to Brazilian Portuguese, since larger sample and with diferent characteristics should be evaluated, besides the accomplishment of studies that investigate other psychometric properties.
1. Dellarozza MSG, Pimenta CAM, Matsuo T. Prevalência e caracterização da dor crônica em idosos não institucionalizados. Cad Saúde Pública. 2007;23(5):1151-60.
2. Beissner K, Henderson CR Jr, Papaleontioul M, Olkhovskaya Y, Wigglesworth J, Reid MC. Physical Therapists use of cognitive-behavioral therapy for older adults with chronic pain: a nationwide survey. Phys Ther. 2009;89(5):456-69.
3. Harris T, Cook DG, Victor C, DeWilde S, Beighton C. Onset and persistence of depression in older people-results from a 2-year community follow-up study. Age Ageing. 2006;35(1):25-32.
4. Geertzen JH, Van Wilgen CP, Schrier E, Dijkstrap PU. Chronic pain in rehabilitation medicine. Disabil Rehabil. 2006;28(6):363-7.
5. Barry LC, Gill TM, Kerns RD, Reid MC. Identification of pain-reduction strategies used by community-dwelling older persons. J Gerontol A Biol Sci Med Sci. 2005;60(12):1569-75. 6. Blumstein H, Gorevic PD. Rheumatologic illnesses: treatment strategies for older adults.
Geriatrics. 2005;60(6):28-35.
7. Perez RS. Defining pain. Disabil Rehabil. 2006;28(6):339-41.
8. Santos CC, Pereira LSM, Resende MA, Magno F, Aguiar V. Aplicação da versão brasileira do questionário de dor Mcgill em idosos com dor crônica. Acta Fisiatrica. 2006;13(2):75-82. 9. Salvetti MG, Pimenta CAM. Validação da chronic pain self-efficacy scale para a língua
portuguesa. Rev Psiquiatr Clín. 2005;32(4):202-10.
10. Tsai YF. Gender differences in pain and depressive tendency among Chinese elders with knee osteoarthritis. Pain. 2007;130(1-2):188-94.
11. Monsivais D, McNeill J. Multicultural influences on pain medication attitudes and beliefs in patients with nonmalignant chronic pain syndromes. Pain Manag Nurs. 2007;8(2):64-71. 12. Samwel HJA, Evers AW, Crul BJ, Kraaimaat FW. The role of helplessness, fear of pain, and
passive pain-coping in chronic pain patients. Clin J Pain. 2006;22(3):245-51.
13. Rotter J. A teoria da personalidade social. In: Schultz DP, Schultz SE (editores). Teorias da personalidade. São Paulo: Thomson Learning; 2006. p. 414-31.
14. Dela Coleta MF. Locus de controle da saúde. In: Dela Coleta MF (editor). Modelos para pesquisa e modificação de comportamentos de saúde: teorias, estudos e instrumentos. São Paulo: Cabral Editora e Livraria Universitária; 2004. p. 199-238.
15. Wallston KA, Wallston BS, De Vellis R. Development of the multidimensional health locus of control (MHCL) scales. Health Education & Behavior. 1978;6(1):160-70.
16. Paine P, Pasquali L, Paulo Ede S, Bianchi AL, Solha AC. Psychometric properties of the brazilian health locus of control scale. Psychol Rep. 1994;75(1 Pt 1):91-4.
17. Rosero JER, Ferriani MGC, Dela Coleta MF. Escala de locus de controle da saúde-MHCL: estudo de validação. Rev Latinoam Enferm. 2002;10(2):179-84.
18. Luszczynska A, Schwarzer R. Multidimensional health locus of control: comments on the construct and its measurement. J Health Psychol. 2005;10(5):633-42.
19. Wallston KA. The validity of the multidimensional health locus of control scales. J Health Psycol. 2005;10(4):623-31.
20. Wallston KA, Stein MJ, Smith CA. Form C of the MHLC scale: a condition-specific measure of locus of control. J Pers Assess. 1994;63(3):534-53.
21. Gibson SJ, Helme RD. Cognitive factors and the experience of pain and suffering in older persons. Pain. 2000;85(3):375-83.
22. Coughlin AM, Badura AS, Fleisher TD, Guck TP. Multidisciplinary treatment of chronic pain patients: it´s efficacy in changing patient locus of control. Arch Phys Med Rehabil. 2000;81(6):739-40.
23. Cross MJ, March LM, Lapsey HM, Byrne E, Brooks PM. Patients self-efficacy and health locus of control: relationships with health status and arthritis-related expenditure. Rheumatology (Oxford). 2006;45(1):92-6.
24. Herning MM, Cook JH, Schneider JK. Cognitive behavioral therapy to promote exercise behavior in older adults: implications for physical therapists. J Geriatr Phys Ther. 2005;28(2):34-8. 25. Bertolucci PHF, Brucki SMD, Campacci SR, Juliano Y. O mini-exame do estado mental em uma
população geral – impacto da escolaridade. Arq Neuropsiquiatr. 1994;52(1):1-7.
26. Beaton DE, Bombardier C, Guillemin F, Ferraz MB. Guidelines for the process of cross-cultural adaptation of self-report measures. Spine (Phila Pa 1976). 2000;25(24):3186-91.
27. Landis JR, Koch GG. The measurement of observer agreement for categorical data. Biometrics. 1977;33(1):159-74.
28. Tiboni CGR. Estatística básica para o curso de turismo. 2ª Ed. São Paulo: Atlas; 2003. 29. Andrade M, Shirakawa I. Versão brasileira do defense style questionnaire (DSQ) de Michael
Bond: problemas e soluções. Rev Psiquiatr Rio Gd Sul. 2006;28(2):144-60.
30. Scherest L, Fay TL, Zaidi SMH. Problems of translation in cross-cultural research. J Cross Cult Psychol.1972;3(1):41-56.
ITEM and that you circle ONLY ONE number per item. There are no right or wrong answers.
Scoring instructions for the scale (used by the examiner): The score on each subscale is the sum of the values circled for each item on the subscale (where 1 = strongly disagree and 4 = strongly agree). All of the subscales are independent of one another. There is no such thing as a “total” score. The score is observed in each subscale so that the subscale with the highest score reflects the prevailing belief of the individual in the control of pain.
Appendix 1. - Pain locus of control scale- C Form / Pain Locus of Control Scale – C Form (PLOC-C).
Subscale Possible range Items
Internal locus of control 6-24 1,6,8,12,13,17 Chance locus of control 6-24 2,4,9,11,15,16 Doctors and health care professionals locus of control 3-12 3,5,14 Other people locus of control 3-12 7,10,18
Strongly disagree Slightly disagree Slightly agree Strongly agree
1 If my pain worsens, it is my own behavior which determines how soon I will feel better again.
1 2 3 4
2 As to my pain, what will be will be. 1 2 3 4 3 If I see my doctor regularly, I am less likely to have problems
with my pain.
1 2 3 4
4 Most things that affect my pain happen to me by chance. 1 2 3 4 5 Whenever my pain worsens, I should consult a medically trained
professional.
1 2 3 4
6 I am directly responsible for my pain getting better or worse. 1 2 3 4 7 Other people play a big role in whether my pain improves, stays
the same, or gets worse.
1 2 3 4
8 Whatever goes wrong with my pain is my own fault. 1 2 3 4 9 Luck plays a big part in determining how my pain improves. 1 2 3 4 10 In order for my pain to improve, it is up to other people to see
that the right things happen.
1 2 3 4
11 Whatever improvement occurs with my pain is largely a matter of good fortune.
1 2 3 4
12 The main thing which affects my pain is what I myself do. 1 2 3 4 13 I deserve the credit when my pain improves and the blame when
it gets worse.
1 2 3 4
14 Following doctor’s orders to the letter is the best way to keep my pain from getting any worse.
1 2 3 4
15 If my pain worsens, it’s a matter of fate. 1 2 3 4 16 If I am lucky, my pain will get better. 1 2 3 4 17 If my pain takes a turn for the worse, it is because I have not
been taking proper care of myself.
1 2 3 4
18 The type of help I receive from other people determines how soon my pain improves.
1 2 3 4
Instructions for completing the scale (to be read to the patient, if applied as an interview): each item below is a belief statement about your pain that you may agree or disagree. Beside each statement is a scale that ranges from strongly disagree (1) to strongly agree (4). For each item we would like you to circle the number that represents the extent to which you agree or disagree with that statement. The more you agree with a statement, the higher will be the number you circle. The more you disagree with a statement, the lower will be the number you circle. Please make sure that you answer EVERY