3 7 2 3 7 23 7 2 3 7 2
3 7 2 Rev Saúde Pública 2003;37(3):372-8
www.fsp.usp.br/rsp
Outpatient health service utilization and
associated factors: a population-based study
Fatores associados à utilização de serviços
ambulatoriais: estudo de base populacional
Raúl Mendoza-Sassia, Jorge U Bériab and Aluísio J D Barrosc
aDepartamento de Medicina Interna, Fundação Universidade Federal do Rio Grande. Rio Grande, RS,
Brazil. bCurso de Pós-graduação em Medicina e Saúde Coletiva, Universidade Luterana do Brasil.
Canoas, RS, Brazil. cDepartamento de Medicina Social, Universidade Federal de Pelotas. Pelotas, RS,
Brazil
Correspondence to:
Raúl Mendoza-Sassi
Rua Dr. Pedro Armando Gatti, 99 96216-080 Rio Grande, RS, Brasil E-mail: [email protected]
*Based on doctoral thesis presented to Universidade Federal de Pelotas, RS, Brasil, Curso de Pós-graduação em Epidemiologia, 2002.
Received on 26/6/2002. Reviewed on 9/12/2002. Approved on 21/1/2003.
Keywords
Health services, utilization. Health services accessibility. Equity in access. Socioeconomic factors.
Descritores
Serviços de saúde, utilização. Acesso aos serviços de saúde. Eqüidade no acesso. Fatores socioeconômicos.
Abstract
Objective
To identify factors that lead people to visit a doctor in Brazil and assess differences between socioeconomic groups.
Methods
A cross-sectional study comprising 1,260 subjects aged 15 or more was carried out in southern Brazil. Demographic, socioeconomic, health needs and regular source of care data were analyzed concerning visits to a doctor within two months from the interview. Adjusted prevalence ratios and 95% confidence intervals were calculated using Poisson regression.
Results
Adjusted PR showed that women having stressful life events, health insurance, and a regular doctor increased the outcome. A dose-related response was found with self-reported health, and the probability of visiting a doctor increased with health needs. Analysis in the chronic disease group revealed that uneducated lower income subjects had a 62% reduction in the chance of visiting a doctor compared to uneducated higher income ones. However, as it was seen a significant interaction between income and education, years of schooling increased utilization in this group.
Conclusions
Results suggest the existence of health inequity in the poorest group that could be overcome with education. Specific measures reinforcing the importance of having a regular doctor may also improve access in the underserved group.
Resumo
Objetivo
Identificar os fatores que levam uma pessoa a consultar o médico no Brasil e avaliar as diferenças entre grupos socioeconômicos.
Métodos
3 7 3 3 7 3 3 7 3 3 7 3 3 7 3 Rev Saúde Pública 2003;37(3):372-8
www.fsp.usp.br/rsp
Out-patient health service utilization
Mendoza-Sassi R et al
Resultados
As RP ajustadas mostraram que mulher, eventos estressantes, seguro de saúde e médico de referência aumentaram a probabilidade do desfecho. Foi encontrada uma relação de tipo dose-resposta com auto-avaliação do estado de saúde, e a probabilidade de consultar aumentou a medida que a necessidade em saúde também aumentou. A análise no grupo com doença crônica evidenciou que o grupo de menor renda e sem escolaridade teve uma redução de 62% na probabilidade de visitar o médico em comparação com o grupo de maior renda e sem estudo. Contudo, como ocorreu interação significativa entre renda e educação, o tempo de estudo melhorou a utilização nesse grupo.
Conclusões
Os resultados sugerem a existência de iniqüidade no grupo mais pobre que pode ser modificada pela educação. Medidas específicas reforçando a importância de ter um médico de referência podem também melhorar o acesso dos mais pobres.
INTRODUCTION
The reasons that lead people to visit a doctor come from a complex interaction of different factors such as demographic, socioeconomic, and psychological aspects, morbidity profiles, and health services avail-ability.2,5 The effect and relative importance of each factor are affected by cultural background, health policies and health care system available.
As lower socioeconomic groups have a higher bur-den of disease and therefore need more health serv-ices, equity is at the heart of the entire health care issue. In Brazil, a universal decentralized and free of charge health care system was created, the Unified Health System (SUS), following the promulgation of the 1988 Federal Constitution. Reforms have oc-curred since then, but there is evidence that, despite intended universal provision, health services utiliza-tion among social groups remains unequal.1 Further-more, there is limited information about how demo-graphic, socioeconomic, health needs and other fac-tors affect health service utilization in the country.
The present study focused on these issues, and ex-amined the characteristics of people who had visited a doctor within two months from the interview, and assessed the system’s equity by examining prevalence ratios of visit to a doctor across socioeconomic groups in the highest level of health needs, defined as those patients with chronic diseases.
METHODS
Study design and sample
A cross-sectional study was carried out from January through May 2000 on a probabilistic sample drawn from a population aged 15 years and over, living in the municipality of Rio Grande, state of Rio Grande do
Sul, southern Brazil. Rio Grande has a population of 200,000 people, and only 5% live in the rural area. Most of the health services used by the population are part of the Unified Health System (SUS).
The sampling process included a cluster sampling where 45 out 242 census tracts were selected, fol-lowed by a random sampling where one block was identified in each cluster. Every third household was visited until it made 12 houses. A total of 1,348 per-sons were visited.
Trained interviewers using a previously pre-coded and pre-tested questionnaire interviewed the subjects. Independent operators entered the information into an Epi-Info 6.04b database. The investigators checked for consistency and amplitude errors, and corrected them. The database was then converted to Stata 6.014 for statistical analysis.
Variables
3 7 4 3 7 43 7 4 3 7 4
3 7 4 Rev Saúde Pública 2003;37(3):372-8
www.fsp.usp.br/rsp
Out-patient health service utilization
Mendoza-Sassi R et al
doctor, is there any physician you often see?” and b) “What is your doctor’s name?” It was considered posi-tive if the subject answered yes to the first question, and remembered the doctor’s name. Regular care site was assessed similarly. Health insurance was consid-ered positive if the subject had any other health in-surance besides the SUS one. Health needs were as-sessed by asking subjects about: a) having at least one potential serious symptom within the last two months (the list included breathlessness, chest pain, blood in urine or stools, and excessive vaginal bleed-ing) b) having a chronic health condition c) inactiv-ity days, defined as impossibilinactiv-ity of carrying out his/ her usual activities for at least one day during the previous two months because of a health condition d) self-reported health, addressed by the question “How was your health in the last two months prior the interview: excellent, good, regular or poor?” e) mi-nor psychiatric disorders, assessed by SRQ-20,11 us-ing a five/six cut-off point for men and a seven/eight for women.
Socioeconomic differences in health services utili-zation was measured by assessing visit rates to a doc-tor among different income groups with the highest level of need, defined as those with chronic health conditions. Two models were created. The first one comprised socioeconomic factors adjusted for demo-graphic variables. The second one included the first model plus regular source of care (doctor or site), a variable that can improve health access as showed in other studies.6
A conceptual framework was used for analysis based upon the hierarchical level of determination.15 The first level is represented by socioeconomic and de-mographic factors, which determine all other factors. Immediately below are family stress, social support and stressful life events, which can affect some vari-ables on the next level. In the third level are placed regular source of care, health insurance and health needs variables, which are closer to the outcome.
Statistical analysis
All statistical analyses were performed using Stata version 6.0 for Windows. A cut-off point for p was previously fixed at 0.05. In the bivariate analysis, prevalence ratios (PR) and 95% confidence intervals (CI) were calculated and Chi-square test was used to assess their significance. Linear trends were explored for ordinal categorical data.
A Poisson model was applied in the multivariate analysis. The choice of this method of regression is justified because of the high frequency of visits to a
doctor in the time period of two months . Under such circumstances, OR would overestimate RR, and would yield an inaccurate measure of the utilization rates and ratios. As the study focuses on utilization of health services, a PR would be more helpful and useful. It has been suggested the use of models such as Cox regression in order to directly estimate the PR.7 The problem with this approach is that CIs are excessively large. If the observational periods are the same for every case, the Poisson regression is equivalent to the Cox model with the advantage that it is possible to correct the CI by using a robust estimation of the variance, based in sandwich estimators.9 Therefore, and according to what was suggested by Hirakata,4 a Poisson regression with robust estimation of variance was used in order to obtain a direct estimation of the PR with corrected CI. Combined with this procedure, and performed during the analysis, the option “clus-ter”, available in Stata, was used since it takes into account the possibility of non-independent observa-tions in each census tracts.
A Wald test was carried out to assess the variables significance. If ordinal, a linear hypothesis test was performed. The variables were entered using a hierar-chical approach, as mentioned before. At each level of the model, all the corresponding variables were intro-duced and a backward regression technique was per-formed. Variables with a p=0.2 and/or a PR=1.5 were kept for the next level to avoid negative confusion. Interaction terms were introduced for income and edu-cation, and regular doctor and health insurance, and their significance tested with a heterogeneity test.
RESULTS
Factors associated to visiting a doctor
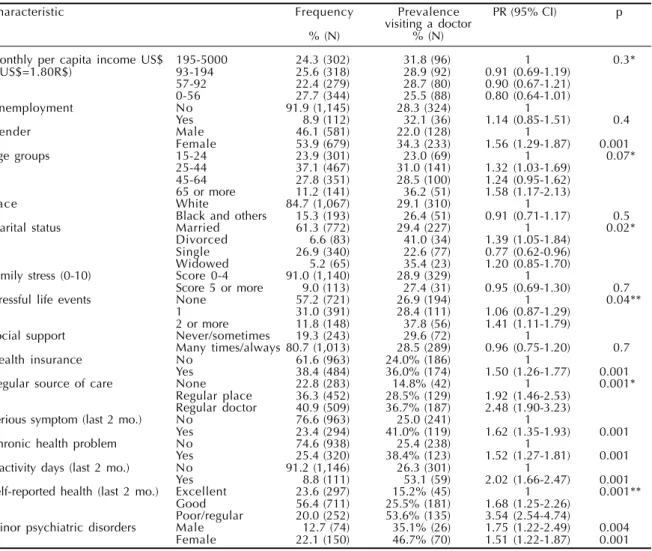
Of the 1,348 subjects visited in 540 households, 1,260 answered the questionnaire (93%). Monthly per capita mean income for the study sample was US$ 168.30 (SD 225.00). The mean age was 40.3 yrs (SD 17.71). There was 7% of illiteracy and the mean years of schooling was 6.62 (SD 3.65). Two-thirds had vis-ited the doctor in the last year (66%) and almost one-third (28.7%) did so in the last two months prior to the interview. Other characteristics of the studied sam-ple can be seen in Table 1.
3 7 5 3 7 5 3 7 5 3 7 5 3 7 5 Rev Saúde Pública 2003;37(3):372-8
www.fsp.usp.br/rsp
Out-patient health service utilization
Mendoza-Sassi R et al
associated with visiting a doctor. A significant dose-response relationship was found between stressful life events and the outcome. Other factors associated with visiting a doctor were regular source of care (with a dose-response relationship ), and health insurance. Every one of the health needs variables showed a significant association with visiting a doctor, and in the case of self-reported health a dose-response rela-tionship was established.
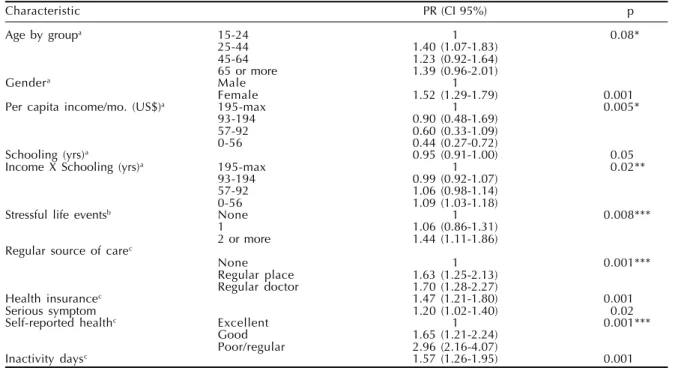
The results of the multivariate analysis can be seen in Table 2. After adjusting for other variables of the first level, women continue to have a higher prob-ability of visiting a doctor. For income, the lowest income group with no education had a 56% reduc-tion in the probability of visiting a doctor. However, this difference was reduced if this group had any years of schooling by means of an interaction be-tween education and income. For the other groups, as PRs were very near to one and education was
inversely associated with outcome, more years of schooling determined a reduction in the probabil-ity of visiting a doctor.
In the second level, after adjusting for remaining factors from the previous level, the dose-response re-lationship observed for stressful life events, remained significant with little changes in the PR’s.
In the last level, and after adjusting for all other factors that remained in the model, regular source of care persisted associated with the outcome keeping a dose-response relationship, although in practice with very similar PR’s. Health insurance remained associ-ated with the outcome. An interaction between regu-lar doctor and health insurance was explored without any significant result. Among health need variables, self reported-health, with a dose-response relation-ship, inactivity days, and potential serious symptom, remained significantly associated with the outcome.
Table 1 - Sample characteristics, prevalence and crude prevalence ratios for visiting according to tudied variables. Rio Grande, Brazil, 2000. (N=1,260).
Characteristic Frequency Prevalence PR (95% CI) p
visiting a doctor
% (N) % (N)
Monthly per capita income US$ 195-5000 24.3 (302) 31.8 (96) 1 0.3*
(1US$=1.80R$) 93-194 25.6 (318) 28.9 (92) 0.91 (0.69-1.19)
57-92 22.4 (279) 28.7 (80) 0.90 (0.67-1.21)
0-56 27.7 (344) 25.5 (88) 0.80 (0.64-1.01)
Unemployment No 91.9 (1,145) 28.3 (324) 1
Yes 8.9 (112) 32.1 (36) 1.14 (0.85-1.51) 0.4
Gender Male 46.1 (581) 22.0 (128) 1
Female 53.9 (679) 34.3 (233) 1.56 (1.29-1.87) 0.001
Age groups 15-24 23.9 (301) 23.0 (69) 1 0.07*
25-44 37.1 (467) 31.0 (141) 1.32 (1.03-1.69)
45-64 27.8 (351) 28.5 (100) 1.24 (0.95-1.62)
65 or more 11.2 (141) 36.2 (51) 1.58 (1.17-2.13)
Race White 84.7 (1,067) 29.1 (310) 1
Black and others 15.3 (193) 26.4 (51) 0.91 (0.71-1.17) 0.5
Marital status Married 61.3 (772) 29.4 (227) 1 0.02*
Divorced 6.6 (83) 41.0 (34) 1.39 (1.05-1.84)
Single 26.9 (340) 22.6 (77) 0.77 (0.62-0.96)
Widowed 5.2 (65) 35.4 (23) 1.20 (0.85-1.70)
Family stress (0-10) Score 0-4 91.0 (1,140) 28.9 (329) 1
Score 5 or more 9.0 (113) 27.4 (31) 0.95 (0.69-1.30) 0.7
Stressful life events None 57.2 (721) 26.9 (194) 1 0.04**
1 31.0 (391) 28.4 (111) 1.06 (0.87-1.29)
2 or more 11.8 (148) 37.8 (56) 1.41 (1.11-1.79)
Social support Never/sometimes 19.3 (243) 29.6 (72) 1
Many times/always 80.7 (1,013) 28.5 (289) 0.96 (0.75-1.20) 0.7
Health insurance No 61.6 (963) 24.0% (186) 1
Yes 38.4 (484) 36.0% (174) 1.50 (1.26-1.77) 0.001
Regular source of care None 22.8 (283) 14.8% (42) 1 0.001*
Regular place 36.3 (452) 28.5% (129) 1.92 (1.46-2.53) Regular doctor 40.9 (509) 36.7% (187) 2.48 (1.90-3.23)
Serious symptom (last 2 mo.) No 76.6 (963) 25.0 (241) 1
Yes 23.4 (294) 41.0% (119) 1.62 (1.35-1.93) 0.001
Chronic health problem No 74.6 (938) 25.4 (238) 1
Yes 25.4 (320) 38.4% (123) 1.52 (1.27-1.81) 0.001
Inactivity days (last 2 mo.) No 91.2 (1,146) 26.3 (301) 1
Yes 8.8 (111) 53.1 (59) 2.02 (1.66-2.47) 0.001
Self-reported health (last 2 mo.) Excellent 23.6 (297) 15.2% (45) 1 0.001**
Good 56.4 (711) 25.5% (181) 1.68 (1.25-2.26)
Poor/regular 20.0 (252) 53.6% (135) 3.54 (2.54-4.74)
Minor psychiatric disorders Male 12.7 (74) 35.1% (26) 1.75 (1.22-2.49) 0.004
Female 22.1 (150) 46.7% (70) 1.51 (1.22-1.87) 0.001
PR: prevalence ratio. *P for at least one PR ≠1.
3 7 6 3 7 63 7 6 3 7 6
3 7 6 Rev Saúde Pública 2003;37(3):372-8
www.fsp.usp.br/rsp
Out-patient health service utilization
Mendoza-Sassi R et al
Social differences in utilization
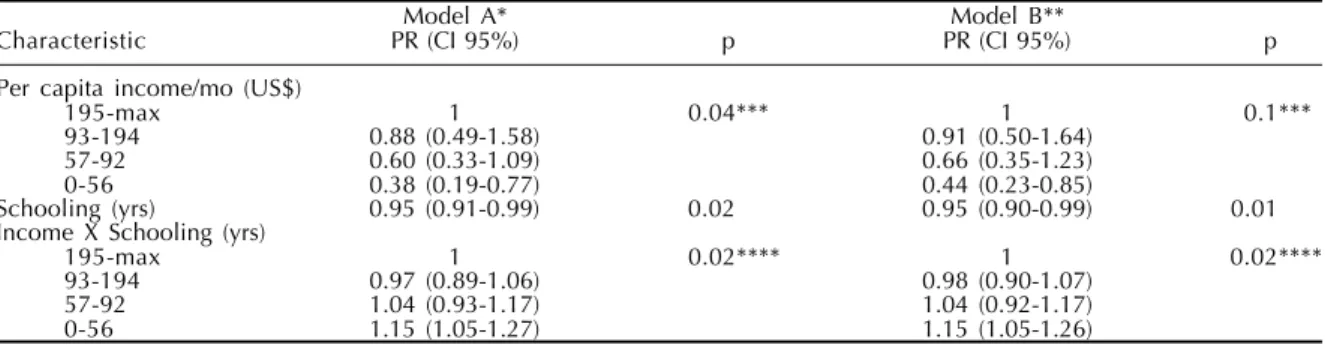
Table 3 presents the results of socioeconomic vari-ables analyzed in the group with higher level of needs, here represented by those with chronic health condi-tions. After adjusting for demographic factors (age and sex), the lowest income group without a single year of education had a 62% reduction in the prob-ability of using health services when compared to those belonging to the highest income group with-out any year of schooling (model A).
Because of the interaction between income and
school-ing, as years of education in the lower income group increased, so did the probability of visiting a doctor. The other groups had interaction terms very close to one, and as schooling had an inverse association, the effect was a reduction in the PR for visiting a doctor.
In Figure 1 it can be observed the effect of school-ing for the four income groups. The lowest income group showed an increase of PR as years of education also increased. For the two higher income groups, due to reasons mentioned before, more years of educa-tion meant a reduceduca-tion in the probability of visiting a doctor. For the income group 57-92, the modifier ef-fect of schooling is quite smooth. The values were obtained using the formula:
PR of income x PR of schooling yrs of school x (PR income x schooling) yrs of school
After controlling for the variable “regular source of care” (doctor or site), which can affect the probability of utilization among social groups, there was an im-provement in PRs (model B). The gap for the lowest income group was further reduced if this group had some education and a regular source of care (Figure 2).
DISCUSSION
There are some constraints that could have af-fected the results. First, it is impossible to discard a
Table 2 - Adjusted prevalence ratios for visiting a doctor, and socioeconomic, demographic, social, health services and health need variables. Rio Grande, Brazil, 2000.
Characteristic PR (CI 95%) p
Age by groupa 15-24 1 0.08*
25-44 1.40 (1.07-1.83)
45-64 1.23 (0.92-1.64)
65 or more 1.39 (0.96-2.01)
Gendera Male 1
Female 1.52 (1.29-1.79) 0.001
Per capita income/mo. (US$)a 195-max 1 0.005*
93-194 0.90 (0.48-1.69)
57-92 0.60 (0.33-1.09)
0-56 0.44 (0.27-0.72)
Schooling (yrs)a 0.95 (0.91-1.00) 0.05
Income X Schooling (yrs)a 195-max 1 0.02**
93-194 0.99 (0.92-1.07)
57-92 1.06 (0.98-1.14)
0-56 1.09 (1.03-1.18)
Stressful life eventsb None 1 0.008***
1 1.06 (0.86-1.31)
2 or more 1.44 (1.11-1.86)
Regular source of carec
None 1 0.001***
Regular place 1.63 (1.25-2.13)
Regular doctor 1.70 (1.28-2.27)
Health insurancec 1.47 (1.21-1.80) 0.001
Serious symptom 1.20 (1.02-1.40) 0.02
Self-reported healthc Excellent 1 0.001***
Good 1.65 (1.21-2.24)
Poor/regular 2.96 (2.16-4.07)
Inactivity daysc 1.57 (1.26-1.95) 0.001
*probability of one or more PR=1. **heterogeneity test.
***linear trend test.
aFirst level: Age, sex, income, education, income x education (N=1,242). bSecond level: First level and stressful life events (N=1,236).
cThird level: Second level and regular doctor, regular place, health insurance, self-reported health, inactivity days (N=1,226).
1,20
1,00
0,80
0,60
0,40
0,20
0,00
0 1 3 5 8
PR
Years of school *PR - Prevalernce ratio adjusted for gender and age 195 - 5,000
93 - 194
57 - 92
0 - 56
3 7 7 3 7 7 3 7 7 3 7 7 3 7 7 Rev Saúde Pública 2003;37(3):372-8
www.fsp.usp.br/rsp
Out-patient health service utilization
Mendoza-Sassi R et al
recall bias. However, as the outcome was measured in a dichotomous way and for a time period of two months, it was easier to recall whether there was a visit to the doctor or not. Moreover, recent studies have showed that self-reported use reasonably esti-mates registered utilization information in different socioeconomic groups.12
Second, as for the study design, none of the estab-lished associations can be inferred as a cause-effect relation because temporal criteria between outcome and independent variables were not sufficiently es-tablished. It cannot be discarded also reverse causal-ity between the outcome and some independent vari-ables. This is the case for regular source of care and health services utilization. It could be argued that if a subject made more doctor visits, they would be more likely to have a regular doctor. However, evidence from longitudinal studies has shown that the direc-tion of causality can be in the manner suggested here.10
Finally, as data losses were an acceptable seven percent, it can be assumed that selection bias was not an actual problem. Available data from losses (56 out of 88) show that the mean age was not different from the sample mean (losses: 42.06 yrs, SD 17.86; sam-ple: 40.3 yrs, SD 17.71; p=0.4). However, the
propor-tion of men in the losses was higher than in the sam-ple (69% vs. 46%, p=0.01). If men who did not an-swer the questionnaire were more likely to visit a doctor, the PR observed in women could have been overestimated. However, another study in Brazil found a comparable effect.3
It was expected a higher use in the 65 yrs or more age group. Although this was verified the results were not significant. However, when the outcome was meas-ured for the last 12 months (where a higher propor-tion of subjects with this profile visited the doctor), the variable was significant even after adjustment for other factors.
Individual’s social and psychological characteris-tics can affect health services utilization, as showed by the dose-response relationship for stressful events. But neither social support nor family dysfunction was associated to the outcome.
Regular source of care (doctor or site) showed, as other studies, a dose-response relationship with out-come.6 However, after adjustment, although the trend persisted, the effects of both categories became very similar. Health insurance maintained the same PR, even after adjusting for potential confounders.
Variables related to health needs were the most important, confirming other studies, and self-reported health showed a dose-response relationship with out-come. Chronic health conditions lost its effect after adjustment, but with the outcome measured for 12 months, it remained associated even after adjustment. This could indicate that a period of two months could be too short for observing a difference in utilization rates among people with a chronic health conditions, at least for a dichotomous outcome.
Analysis of social differences in visiting a doctor for the higher level of needs showed the existence
Table 3 - Prevalence ratios for visiting a doctor in persons with chronic health problems, and socioeconomic factors. Rio Grande, Brazil, 2000.
Model A* Model B**
Characteristic PR (CI 95%) p PR (CI 95%) p
Per capita income/mo (US$)
195-max 1 0.04*** 1 0.1***
93-194 0.88 (0.49-1.58) 0.91 (0.50-1.64)
57-92 0.60 (0.33-1.09) 0.66 (0.35-1.23)
0-56 0.38 (0.19-0.77) 0.44 (0.23-0.85)
Schooling (yrs) 0.95 (0.91-0.99) 0.02 0.95 (0.90-0.99) 0.01
Income X Schooling (yrs)
195-max 1 0.02**** 1 0.02****
93-194 0.97 (0.89-1.06) 0.98 (0.90-1.07)
57-92 1.04 (0.93-1.17) 1.04 (0.92-1.17)
0-56 1.15 (1.05-1.27) 1.15 (1.05-1.26)
*adjusted to age and gender (N=316).
**adjusted to age, gender, and regular source of care (N=315). ***probability of one or more PR=1.
****heterogeneity test.
0,77
0,59
0,5
0,42 0,38
0,89
0,68
0,58
0,48 0,44 1
0,9
0,8
0,7
0,6
0,5
0,4
0,3
0,2
0,1
0
0 1 3 5 8
PR
Years of school
Model A. Adjusted for demographic factors
Model B. Adjusted to A and regular source of care
3 7 8 3 7 83 7 8 3 7 8
3 7 8 Rev Saúde Pública 2003;37(3):372-8
www.fsp.usp.br/rsp
Out-patient health service utilization
Mendoza-Sassi R et al
of inequity for the lowest income group. But this situation could be modified by means of an interac-tion between educainterac-tion and income. If the poorest group had any schooling, the chance of visiting a doctor increased. In addition, after adjustment with “regular source of care”, the gap between this group and the wealthier ones was reduced even more. The modifier effect of schooling in the two highest in-come groups was opposite, reducing the chance of visiting a doctor.
The variable distance to health facility, an impor-tant factor of health services utilization, was not analyzed in this occasion because the study included all the potential users, even those that did not visit the doctor in the last two months but may have had health needs, and to whom this variable would not apply.
Finally, as recommendations, Brazilian health policymakers need to be aware that despite universal provision and free access of the new system, there is still
some degree of inequity; the poorest and least educated group still uses the health services to a lesser extent. As more education can improve access and diminish the inequity in this underserved group, it may be that the problem is a lack of knowledge about accessing and gaining entry into the health system. Therefore, in con-junction with obvious structural changes necessary to improve education in the population, other specific policies and measures can be effective for improving health services utilization in the underserved group. For example, educational campaigns on when and how to get access to the health system. Furthermore, having a regular source of care (doctor or site) has to be encour-aged especially among the poorest groups, as this can reduce health services utilization gap, and improve qual-ity of health attention.
ACKNOWLEDGMENTS
To Inès Périn, MD, (Takemi fellow – Harvard School of Public Health) for her significant input.
REFERENCES
1. Almeida C, Travassos C, Porto S, Labra M. Health sector reform in Brazil: a case study of inequity. Int J Health Serv 2000;30:129-62.
2. Campbell SM, Roland MO. Why people consult a doctor? Fam Pract 1996;13:75-83.
3. Costa JD, Facchini LA. Utilização de serviços ambulatoriais em Pelotas: onde a população consulta e com que freqüência. Rev Saúde Pública
1997;31:360-9.
4. Hirakata VM. Alternatives for logistic regression in cross-sectional studies: an empircal comparison fo models that directly estimates the prevalence ratio [Thesis]. Pelotas: Univesidade Federal de Pelotas; 2000.
5. Hulka BS, Wheat JR. Patterns of utilization, the patient perspective. Med Care 1985;23:438-60.
6. Lambrew JM, DeFriese GH, Carey TS, Ricketts TC, Biddle AK. The effects of having a regular doctor on access to primary care. Med Care 1996;34:138-51.
7. Lee J, Chia KS. Use of the prevalence ratio v the prevalence odds ratio as a measure of risk in cross sectional studies [letter; comment]. Occup Environ Med 1994;51:841.
8. Lima MS, Béria JU, Tomasi E, Conceição AT, Mari JJ. Stressful life events and minor psychiatric disorders: an estimate of the population attributable fraction in a Brazilian community-based study. Int J Psychiatry Med 1996;26:211-22.
9. Lin D, Wei L. The robust inference for the Cox proportional hazards model. J Am Stat Assoc 1989;84:1074-8.
10. Mainous AG, Gill JM. The importance of continuity of care in the likelihood of future hospitalization: is site of care equivalent to a primary clinician? Am J Public Health 1998;88:1539-41.
11. Mari J, Williams P. A validity study of a psychiatric screening questionnaire (SRQ-20) in primary care in the city of Sao Paulo. Br J Psychiatry
1986;148:23-6.
12. Reijneveld SA, Stronks K. The validity of self-reported use of health care across socioeconomic strata: a comparison of survey and registration data. Int J Epidemiol 2001;30:1407-14.
13. Smilkstein G. The family APGAR: a proposal for family function test and its use by physicians. J Fam Pract 1979;6:1231-9.
14. Stata Corporation: version 6.0. Texas: College Station; 1999.
15. Victora CH, Fuchs S, Olinto SMT. The role of conceptual frameworks in epidemiological analysis: a hierarchical approach. Int J Epidemiol