Respiratory evaluation through volumetric capnography
among grade III obese and eutrophic individuals:
a comparative study
Débora Aparecida Oliveira Modena
I, Marcos Mello Moreira
II, Ilma Aparecida Paschoal
III, Mônica Corso Pereira
III, Luiz Cláudio
Martins
III, Everton Cazzo
VI, Elinton Adami Chaim
VHospital de Clínicas, Universidade Estadual de Campinas (UNICAMP), Campinas (SP), Brazil
INTRODUCTION
Severely obese subjects develop various respiratory functional abnormalities, which may occur while awake, during sleep or while performing physical efort.1,2 here are obese individuals
who hypoventilate during wakefulness, and this hypoventilation may cause hypoxemia and hypercapnia. hese events characterize the diagnosis of alveolar hypoventilation in obese peo-ple. Not all severely obese individuals hypoventilate when awake, and the factors that favor this situation are not entirely clear.3-5 Among the respiratory abnormalities in obese patients that
appear during sleep, the most common of these is obstructive sleep apnea caused by obstruction of the air inlet in the upper airway during inspiration.4,5
Obese subjects may also have difficulty performing physical effort because the accu-mulation of fat in the chest and abdomen may hinder the increased ventilation required by physical exertion.4 Besides alveolar hypoventilation, obese patients can show
abnor-malities of respiratory patterns even when they are not exercising, and little is known about such patterns.4,5
Pulse oximetry and measurement of arterial blood gases during wakefulness make it pos-sible to diagnose situations of obesity hypoventilation syndrome.4,5 Polysomnography properly
detects respiratory functional disorders that occur during sleep (obstructive apnea, central apnea and desaturation).4 However, spirometry requires physical efort and can show restrictive defects
that are not necessarily related to involvement of the lungs. hese restrictions may be caused by excessive accumulation of fat in the chest and abdomen that precludes proper spirometry maneu-vers, which require physical efort.6-9
IPT, MSc. Doctoral Student, Universidade
Estadual de Campinas (UNICAMP), Campinas (SP), Brazil. orcid.org/0000-0002-2800-3620
IIPT, PhD. Professor, Universidade Estadual de
Campinas (UNICAMP), Campinas (SP), Brazil.
IIIMD, PhD. Pneumologist and Professor,
Universidade Estadual de Campinas (UNICAMP), Campinas (SP), Brazil.
IVMD, PhD. Attending Physician and Assistant
Lecturer, Universidade Estadual de Campinas (UNICAMP), Campinas (SP), Brazil.
VMD, PhD. General Surgeon and Professor,
Universidade Estadual de Campinas (UNICAMP), Campinas (SP), Brazil.
KEY WORDS:
Obesity.
Respiratory function tests. Carbon dioxide. Capnography. Leptin.
ABSTRACT
BACKGROUND: Excess trunk body fat in obese individuals inluences respiratory physiological function. The aims of this study were to compare volumetric capnography indings (VCap) between severely obese patients and normal-weight subjects and to assess whether there is any association between neck circum-ference (NC), waist-hip ratio (WHR) and VCap among grade III obese individuals.
DESIGN AND SETTING: Analytical observational case-matched cross-sectional study, University of Campinas.
METHODS: This cross-sectional study compared VCap variables between 60 stage III obese patients and 60 normal-weight individuals.
RESULTS: In comparison with the normal-weight group, obese patients presented higher alveolar min-ute volume (8.92 ± 4.94 versus 6.09 ± 2.2; P = < 0.0001), CO2 production (278 ± 91.0 versus 209 ± 60.23; P < 0.0001), expiratory tidal volume (807 ± 365 versus 624 ± 202; P = 0.005), CO2 production per breath (21.1 ± 9.7 versus 16.7 ± 6.16; P = 0.010) and peak expiratory low (30.9 ± 11.9 versus 25.5 ± 9.13; P = 0.004). The end-expiratory CO2 (PetCO2) concentration (33.5 ± 4.88 versus 35.9 ± 3.79; P = 0.013) and the phase 3 slope were normalized according to expired tidal volume (0.02 ± 0.05 versus 0.03 ± 0.01; P = 0.049) were lower in the obese group.
Volumetric capnography (VCap), which consists of plotting the expired CO2 concentration against expired volume, is a bed-side-validated method for measuring airway and alveolar dead-space volumes, and ascertaining the pulmonary ventilation-per-fusion relationships.6-10 In addition to its application in surgical
and anesthetic settings, this method may be used among outpa-tients with chronic respiratory diseases.11,12 he examination is
performed during spontaneous breathing, and breath-to-breath measurements are collected, including tidal volume, minute vol-ume and end tidal CO2. Besides these variables, each breath cycle produces a curve called a capnogram that has a shape similar to that of N2 washout.
Our hypothesis was that VCap might help in understanding abnormalities in respiratory patterns and lung function during rest among obese individuals.11-14
he aims of this study were to compare the VCap variables between severely obese patients and normal-weight subjects and to evaluate the existence of any correlation between neck circum-ference (NC), waist/hip ratio (WHR) and VCap variables among obese patients.
METHODS
his was an analytical observational case-matched cross-sectional study in which the subjects enrolled were grade III obese (body mass index, BMI ≥ 40 kg/m2) candidates for bariatric surgery at
Hospital de Clínicas, University of Campinas (UNICAMP) and normal-weight controls (BMI 18.6-24.9) who were selected from the data bank of the Pulmonary Function Laboratory, UNICAMP. he subjects and controls were aged between 18 and 65 years old and were evaluated between August 2014 and July 2015. he study was approved by the local Research Ethics Committee.
he following potential participants were excluded: active smokers or former smokers who had quit less than one year pre-viously; individuals with chronic respiratory diseases unrelated to obesity; vulnerable groups (individuals who were mentally ill, insti-tutionalized or aged below 18 years); and individuals who opted not to take part in the study. Both the obese and the non-obese participants reported that they did not have any respiratory dis-eases (current or past) and were not on any respiratory medication. he individuals selected were matched according to age, gen-der and height and were divided into two groups: obese (group 1) and non-obese (group 2). In both groups, the variables initially collected and analyzed were age, gender and anthropometric mea-surements (weight, height and BMI) (Table 1).
In the obese group, the variables of NC and WHR were also col-lected and analyzed. he obese patients also answered the Berlin ques-tionnaire (BQ), which evaluates the risk of development of obstructive sleep apnea syndrome (OSAS). Occurrences of hypertension were assessed in accordance with the Eighth National Joint Committee
(JNC 8) criteria, i.e. individuals were considered to present hyper-tension if at least three diferent blood pressure measurements were higher than 140/90 mmHg.15 he presence of type 2 diabetes mellitus
(T2DM) was assessed in accordance with the criteria deined by the current guidelines of the International Diabetes Federation (IDF). he presence of T2DM was deined as the presence of any of the following abnormalities: fasting plasma glucose ≥ 126 mg/dl; 75 g
oral glucose tolerance test with fasting plasma glucose ≥ 126 mg/dl
and/or two-hour plasma glucose ≥ 200 mg/dl; glycated
hemoglo-bin (HbA1c) ≥ 6.5%; or random plasma glucose ≥ 200 mg/dl in the presence of classical diabetes symptoms.16
All the participants underwent VCap in the mornings at the Pulmonary Function Laboratory of UNICAMP. he device used was the oxy-capnograph and respiratory proile monitor (CO2SMOS Plus 8100 Dixtal/Novametrix; Respironics, Murrisville, PA, USA).
VCap is a technique that analyzes the pattern of CO2 elimination as a function of expired volume. It produces a curve called a capno-gram, which represents the total amount of CO2 eliminated by the lungs during each breath. As would be expected, capnograms have the same shape as other gas elimination curves, with the advan-tage that they are obtained using a gas that is produced normally by the body and is eliminated by the lungs.15
he VCap examinations took about 10 minutes each and were always performed by the same technician. Firstly, the participant was asked to sit in a comfortable position and rest for ive min-utes while instructions for the examination were provided. Before the examination, the patient was encouraged to drink water to prevent the discomfort that could be caused by mouth breathing
Obese (n = 60) Non-obese
(n = 60) P-value
Women 45 45 1.0
Men 15 15 1.0
Age (years)* 36 ± 10 36 ± 11 0.92 Weight (kg)* 141 ± 27 67.3 ± 11 < 0.0001 Height (m)* 1.66 ± 0.09 1.66 ± 0.08 0.74 BMI (kg/m2)* 50.9 ± 7 20.8 ± 3 < 0.0001
NC* 44.1 (4.43)
WHR* 0.91 (0.11)
Arterial hypertension 27(55%) Diabetes 49 (81%)
BQ results High risk Low risk
45 15
Table 1. Comparison of anthropometric variables
between obese patients (group 1) and non-obese subjects (group 2), and data on frequencies of comorbidities, Berlin questionnaire (BQ) results, neck circumference and waist-hip ratio in group 1
(e.g. dry throat, coughing, etc.). Ater this, a nose clip was put in place to avoid air escape through the nostrils and the subject was asked to breathe room air regularly through a mouthpiece that he or she held with his or her dominant hand, which was connected to the capnograph sensors. he participant was asked to breathe normally for some seconds to adapt to this situation.
Online digital recording of respiratory cycles was then started (Analysis Plus sotware), and this continued for ive minutes. A pulse oximetry sensor was installed on the index inger. At the end of data collection, an oline sequence of the subjects’ respiratory cycles was selected to accommodate variation of < 15% for expira-tory tidal volume and < 5% for partial pressure of CO2 concentra-tion (PetCO2). Furthermore, sequences that showed phases 2 and 3 slopes equal to zero were eliminated, along with outlier values.
Phases 2 and 3 slopes equal to zero can occur because, from time to time, the apparatus used removes the humidity from the sensor and, through this, the parameters are cleared. Outlier values occur because patients who are breathing spontaneously may make dif-ferent respiratory eforts (e.g. sighing, coughing or speaking, etc.). he patients were weighed using a digital scale that was appro-priate for their size, with a maximum capacity of 300 kg and a resolu-tion of 100 g, and height was ascertained using a wall-mounted sta-diometer. From these measurements, BMI in kg/m2 was calculated.
Waist circumference was determined using a measuring tape around the individual at the natural waist line, i.e. in the narrow-est area between the chnarrow-est and hip, at the midpoint between the last rib and the iliac crest. he readings were made at the end of expiration. Hip circumference was determined in the horizon-tal plane at the level of the greatest posterior protuberance of the buttocks. he waist/hip ratio (WHR) was calculated using the for-mula: WHR = waist circumference (cm)/hip circumference (cm). Both of these measurements were made with the patient standing, using a lexible measuring tape. Neck circumference was also mea-sured using a lexible tape at the level of the laryngeal prominence.
Statistical analysis
he baseline characteristics of the sample were presented in fre-quency tables encompassing the categorical variables, as absolute (n) and percentage (%) frequencies. Continuous variables were presented as mean values with their respective standard devia-tions (SD). Bivariate analyses on categorical variables were car-ried out through the chi-square and Fisher’s exact tests. For com-parisons of continuous measurements, the Mann-Whitney test was used. To study the relationship between the capnography measurements and, respectively, the neck circumference and the waist-to-hip ratio of the obese individuals, Spearman’s cor-relation coeicient was used. he signiicance level used was 5% (P < 0.05). A Bonferroni adjustment was used for pair-wise comparisons, to identify the signiicance within mean
diferences between correlations for each outcome (Bonferroni adjusted α = 0.0015625 for Mann-Whitney comparisons and
α = 0.0045 for Spearman’s correlations). To perform the
analy-ses, the Statistical Analysis System (SAS) sotware for Windows, version 9.2, was used.
Sample size estimation was performed through a single-pro-portion formula with a 95% conidence interval. Precision was set at 10% and the calculated sample size was determined to be 60.
RESULTS
In the obese group, there were 45 women (75%) and 15 men (25%). heir mean age was 36 years, mean weight 141 kg, mean height 1.66 m, mean BMI 50.9 kg/m2, NC 44 cm and WHR 0.91.
hese two last anthropometric parameters were only measured in the group of obese individuals.
In this group, 27 (55%) had hypertension and 49 (81.7%) were diabetic. In the Berlin Questionnaire, 45 individuals (75%) presented a high risk of having OSAS and 15 (25%) presented a low risk.
In the non-obese group, 45 (75%) were women and 15 (25%) were men, with a mean age of 36 years, mean weight 67.3 kg, mean height 1.66 m and mean BMI 20.8 kg/m2. Table 1 summarizes the
baseline characteristics of all the patients.
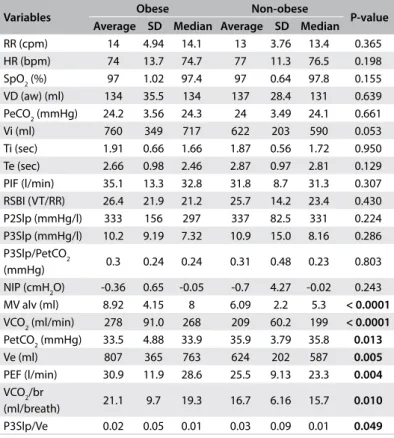
he obese patients presented alveolar minute volume (MV alv) (ml), production of CO2 per minute (VCO2)(ml/min), par-tial pressure of end-tidal carbon dioxide (PetCO2)(mmHg), expi-ratory volume (Ve) (ml), peak expiexpi-ratory low (PEF) (l/min), pro-duction of CO2 per breath (VCO2/br) (ml/breath) and phase 3 slope normalized according to end-tidal partial pressure of CO2 (P3Slp/Ve) that were statistically diferent (P < 0.05) from those of the normal-weight controls. Ater applying the Holm-Bonferroni correction, MV alv (ml) and VCO2 (ml/min) remained signiicantly higher in the obese group (P < 0.0015625). he capnography vari-ables are shown in Table 2.
DISCUSSION
he obese patients in this study had signiicantly greater alveo-lar minute volume (MV alv) and expired volume of CO2 (average per minute) or VCO2. hese results (greater MV alv with equal respiratory rate) suggest that obese patients possibly have more eicient ventilation during tidal breathing, since the VCap mea-surements are made during several minutes of quiet breathing. hese measurements do not require forced expiration, as spirom-etry does. Tidal volume and alveolar minute ventilation may be higher in order to match the higher needs of a greater body mass. Nevertheless, the low mean PetCO2 and P3Slp/Ve may indicate that the obese group presented a larger alveolated area. he com-parison between the two groups (obese versus non-obese sub-jects) revealed that there were no statistical diferences regarding
age and height. he respiratory rate and the dead volume of the airways were similar in the two groups.
he reductions in forced vital capacity that are detected in obese patients through spirometry may, at least in part, be related to the diiculties in using expiratory abdominal muscles due to fat accu-mulation in this area. he obese patients in the present study did not perform spirometry because this was not part of the study protocol. Wei et al. found that the lungs of obese patients had higher capacity to difuse carbon monoxide and attributed this result to the higher blood low to the lungs that obese subjects may have.14
However, our results may suggest that their greater capacity for difusion may be due to a real increase in alveolar surface area.
he peripheral airspaces have been termed the silent lung zone because conventional lung function tests are unable to detect their involvement in disease processes. Inert gases such as helium (He), nitrogen (N2) and sulfur hexaluoride (SF6) have been used to study these areas and the elimination curves that they produce during each expiration depict concentrations of the gas at dif-ferent volumes until all the expiratory volume has been expired. Irrespective of the gas used, all curves have the same shape and, on each of them, three phases can be identiied: phase 1, with very low concentrations of the gas, corresponds to the elimination of the air from the anatomical dead space; phase 2, which is gener-ally a steep upward line, represents the growing concentration of the gas that is eliminated from proximal alveolated air spaces; and phase 3, which is almost a plateau line, represents the elimination
Variables Obese Non-obese P-value
Average SD Median Average SD Median RR (cpm) 14 4.94 14.1 13 3.76 13.4 0.365 HR (bpm) 74 13.7 74.7 77 11.3 76.5 0.198 SpO2 (%) 97 1.02 97.4 97 0.64 97.8 0.155 VD (aw) (ml) 134 35.5 134 137 28.4 131 0.639 PeCO2 (mmHg) 24.2 3.56 24.3 24 3.49 24.1 0.661 Vi (ml) 760 349 717 622 203 590 0.053 Ti (sec) 1.91 0.66 1.66 1.87 0.56 1.72 0.950 Te (sec) 2.66 0.98 2.46 2.87 0.97 2.81 0.129 PIF (l/min) 35.1 13.3 32.8 31.8 8.7 31.3 0.307 RSBI (VT/RR) 26.4 21.9 21.2 25.7 14.2 23.4 0.430 P2Slp (mmHg/l) 333 156 297 337 82.5 331 0.224 P3Slp (mmHg/l) 10.2 9.19 7.32 10.9 15.0 8.16 0.286 P3Slp/PetCO2
(mmHg) 0.3 0.24 0.24 0.31 0.48 0.23 0.803 NIP (cmH2O) -0.36 0.65 -0.05 -0.7 4.27 -0.02 0.243 MV alv (ml) 8.92 4.15 8 6.09 2.2 5.3 < 0.0001 VCO2 (ml/min) 278 91.0 268 209 60.2 199 < 0.0001 PetCO2 (mmHg) 33.5 4.88 33.9 35.9 3.79 35.8 0.013 Ve (ml) 807 365 763 624 202 587 0.005 PEF (l/min) 30.9 11.9 28.6 25.5 9.13 23.3 0.004 VCO2/br
(ml/breath) 21.1 9.7 19.3 16.7 6.16 15.7 0.010 P3Slp/Ve 0.02 0.05 0.01 0.03 0.09 0.01 0.049 Table 2. Distribution of the variables of age, anthropometry and
volumetric capnography (VCap) among patients with and without obesity
RR = respiratory rate; HR = heart rate; SpO2 = oxygen saturation; VD
(aw) = anatomical dead space; PeCO2 = mean end-tidal partial pressure of CO2; Vi = inspiratory tidal volume; Ti = inspiratory time; Te = expiratory time; PIF = peak inspiratory low; RSBI = Tobin index; VT = tidal volume; P2Slp = phase 2 slope; P3Slp = phase 3 slope; P3Slp/PetCO2 = phase 3 slope normalized according to end-tidal partial pressure of CO2; NIP = negative inspiratory pressure; MV alv = alveolar minute volume; VCO2 = CO2 production; PetCO2 = end-tidal partial pressure of CO2; Ve = expiratory tidal volume; PEF = peak expiratory low; VCO2/br = CO2 production per breath; P3Slp/Ve = phase 3 slope normalized according to expired tidal volume. Results are presented as means, medians and standard deviations. P-value for the Mann-Whitney test comparing group 1 (obese) with group 2 (non-obese) after the Bonferroni adjustment; P < 0.0015625.
VCap variables r P
MV alv (l) 0.43 0.0006
VD (aw) (ml) 0.45 0.0003
VCO2 (ml/min) 0.48 < 0.0001
Vi (ml) 0.36 0.0045
Ve (ml) 0.36 0.0041
PEF (l/min) 0.40 0.0017
VCO2/br (ml/breath) 0.34 0.0082
P2Slp (mmHg/l) -0.38 0.0027
P3Slp /Ve -0.29 0.0242
PIF (l/min) 0.47 < 0.0001
NIP (cmH2O) -0.33 0.0100
Table 3. Analysis on correlations between neck circumference (NC) and volumetric capnography (VCap) variables among obese individuals (Group 1)
of the gas from most of the alveoli in the lungs. he phase 3 slope (mmHg/l) is an important feature of gas washout curves and con-tains information about gas transportation in the alveolated air-ways of the lung periphery. It varies in many pathological condi-tions of the lungs.14-21
Phase 3 (mmHg/l) of the VCap represents the elimination of CO2 from most of the alveoli and, in normal individuals, it is almost a plateau, with a slight upward slope. he phase 3 slope (P3Slp) should therefore be small.
Because of the very small convective velocities in the lung periphery, gas transportation through difusion is the dominant mechanism in acinar air spaces. Steepened phase 3 slopes may represent increased difusional resistance in the peripheral lung. hese steepened slopes occur when breathing involves a small-er-than-normal maximum interfacial area between the tidal vol-ume and the functional residual capacity (FRC) during a breathing interval. Small tidal volumes produce steeper slopes because the inhaled air penetrates to shallower-than-normal depths in the lung and therefore encounters smaller-than-normal maximum interfa-cial areas and longer gas-phase difusion paths.22-24 Hence, there is
a need to normalize phase 3 slopes when comparing subjects with signiicantly diferent expired volumes.11,12
In a paper on VCap in children, Ream et al.25 postulated that
the observed decrease in normalized phase 3 slopes of CO2 wash-out curves with increasing age was due to an increase in the inter-face between functional residual capacity (FRC) and tidal volume (VT), with lung growth in children.
It seems that, taking into account the signiicantly smaller normalized values of phase 3 slopes in obese patients, a hypoth-esis can be put forward: obese patients may have larger or more eicient alveolated airspaces than do non-obese subjects. he cor-relations between NC values and capnography variables that were found to be signiicant are in agreement with the hypothesis put forward here, i.e. that the greater the body mass was (relected in this analysis by greater NC), the larger were the lungs of the obese subjects who participated in this study.
Human leptin is a 16-kDa protein of 167 amino acids and was the irst fat cell-derived hormone to be discovered.26,27 Leptin is
produced primarily in the adipocytes of white adipose tissue. In the fetal lungs, leptin is induced in a special phenotype of alveolar inter-stitial ibroblasts, called lipoibroblasts, through the action of the parathyroid hormone-related protein (PTHrP), which is secreted by the alveolar epithelium under moderate stretching. he leptin from the mesenchyme, in turn, acts back on the epithelium at the leptin receptor carried in the alveolar type II pneumocytes and induces surfactant expression, which is of paramount importance for lung function.28-30 Leptin-deicient mice show altered
postna-tal lung development. hey have reduced lung volume and alveo-lar surface area and the alveoalveo-lar size does not increase with age.31
Leptin levels are paradoxically increased in situations of obe-sity.32 Although, as a circulating signal, leptin reduces appetite,
obese individuals generally exhibit higher circulating concentra-tions of leptin than do normal-weight individuals, because of their higher percentage of body fat. he expected responses to high levels of leptin are decreased calorie intake and increased energy expenditure. Most obese humans are probably insensitive to this action by leptin, and behave similarly to type 2 diabetic patients who show resistance to the action of insulin.
he excess leptin present in obese subjects may at least partly explain the apparently larger lungs detected through VCap in these patients. Fat deposits in the neck and abdomen may display a mechanical efect on the chest and may hinder chest mobility during forced expiration and possibly also during spontaneous ven-tilation, with consequences for lung function. his has also been observed in other studies,33-37 such as the increased risk of
devel-oping lung-base atelectasis in obese individuals due to mechani-cal compression exerted by the abdomen in the region.38 Greater
NC can cause increased airlow resistance, especially when NC is greater than 40 cm, and this can result in hypoventilation.
None of the obese patients in the present study, whose BMI was greater than 52, had obesity hypoventilation syndrome (OHS), although 45 of them showed a high-risk result from the Berlin questionnaire for obstructive sleep apnea syndrome (OSAS).39
he scores in the Berlin questionnaire were positively correlated with neck circumference. No sleep studies were available for these individuals.
he hypothesis that these individuals may have had a larger alveolar-capillary membrane might serve as a possible reason for the absence of CO2 retention. Recent reports have shown that alve-olar growth continues from childhood into adolescence in humans and other mammals.33-35 he lungs of obese patients who were
obese children may have been exposed to higher levels of leptin during a period when the alveoli were actively growing. Obesity hypoventilation syndrome might perhaps be more commonly found among obese subjects whose weight gain occurred later in life, a hypothesis that awaits further investigation.
Ferreira et al.40 analyzed obese and normal-weight children
without asthma and reported that the obese children had greater lung volumes, shown through volumetric capnography, and lower values for the ratio between the phase 3 slope of the volumetric cap-nogram and the expired volume (P3Slp/Ve). hese indings were consistent with the results obtained by Ream et al.25 who evaluated
Limitations and strength
his study has some limitations. Carbon monoxide difusion was not performed on the patients of the present study because we did not have the equipment to do this. his measurement could have helped to rule out alterations in carbon monoxide difusion as the cause of our indings. he NC and WHR data relating to the controls were not available because the data were collected from a database. Spirometry data were not available because the obese patients were in the process of losing weight and would undergo spirometry ater achieving a predetermined goal. It was not possible to evaluate whether exposure to toxic agents such as tobacco might have inluenced respiratory function in the two groups, since we did not have this information in the database relating to the non-obese group.
Our indings may contribute towards understanding the com-plex range of alterations to respiratory function that are seen in very obese patients. hey also raise the intriguing possibility that some obese individuals may undergo changes to the alveolar-cap-illary membrane that enable greater eiciency of CO2 elimination. Knowing the leptin levels in these patients might have contributed towards investigating this hypothesis.
CONCLUSION
Volumetric capnography was capable of detecting particular characteristics of lung structure and function in morbidly obese patients, among which some had not previously been shown. It identiied changes to various respiratory parameters, in com-parison with a normal-weight control group. he greater the NC was, the larger were the alveolar minute volume, anatomical dead space, CO2 production per minute and per breath and expira-tory volume; whereas the smaller were the phase 2 slope (P2Slp), phase 3 slope (P3Slp) and pressure drop in the mouth during inspiration. Some of these changes were related to possibly larger lungs in obese patients and others to their larger NC. he com-bination of larger lungs and absence of hypoventilation makes us speculate that these two occurrences may be linked.
REFERENCES
1. Koenig SM. Pulmonary complications of obesity. Am J Med Sci. 2001;321(4):249-79.
2. Rabec C, de Lucas Ramos P, Veale D. Respiratory complications of obesity. Arch Bronconeumol. 2011;47(5):252-61.
3. Laaban JP. [Respiratory function in massive obesity]. Rev Prat. 1993;43(15):1911-7.
4. Olson AL, Zwillich C. The obesity hypoventilation syndrome. Am J Med. 2005;118(9):948-56.
5. Silva GA. Síndrome obesidade-hipoventilação alveolar [Obesity hypoventilation syndrome]. Medicina (Ribeirão Preto). 2006;39(2):195-204.
6. Fletcher R, Jonson B, Cumming G, Brew J. The concept of deadspace with special reference to the single breath test for carbon dioxide. Br J Anaesth. 1981;53(1):77-88.
7. Littleton SW. Impact of obesity on respiratory function. Respirology. 2012;17(1):43-9.
8. Steier J, Lunt A, Hart N, Polkey MI, Moxham J. Observational study of the efect of obesity on lung volumes. Thorax. 2014;69(8):752-9. 9. Arena R, Cahalin LP. Evaluation of cardiorespiratory fitness and
respiratory muscle function in the obese population. Progr Cardiov Dis. 2014;56(4):457-64.
10. Lucangelo U, Blanch L. Dead space. Intensive Care Med. 2004;30(4):576-9. 11. Veronez L, Moreira MM, Soares ST, et al. Volumetric capnography for the evaluation of pulmonary disease in adult patients with cystic ibrosis and noncystic ibrosis bronchiectasis. Lung. 2010;188(3):263-8. 12. Veronez L, Pereira MC, da Silva SM, et al. Volumetric capnography for
the evaluation of chronic airways diseases. Int J Chron Obstruct Pulmon Dis. 2014;9:983-9.
13. Smallwood CD, Martinez EE, Mehta NM. A Comparison of Carbon Dioxide Elimination Measurements Between a Portable Indirect Calorimeter and Volumetric Capnography Monitor: An In Vitro Simulation. Respir Care. 2016;61(3):354-8.
14. Wei YF, Wu HD, Chang CY, et al. The impact of various anthropometric measurements of obesity on pulmonary function in candidates for surgery. Obes Surg. 2010;20(5):589-94.
15. James PA, Oparil S, Carter BL, et al. 2014 evidence-based guideline for the management of high blood pressure in adults: report from the panel members appointed to the Eighth Joint National Committee (JNC 8). JAMA. 2014;311(5):507-20.
16. International Diabetes Federation. Global guideline for type 2 diabetes. Brussels: International Diabetes Federation; 2012.
17. Moreira MM, Terzi RGG, Pereira MC, Grangeia TAG, Paschoal AI. Capnograia volumétrica como auxílio diagnóstico não-invasivo no tromboembolismo pulmonar agudo [Volumetric capnography as a noninvasive diagnostic procedure in acute pulmonary thromboembolism]. J Bras Pneumol. 2008;34(5):328-32.
18. Moreira MM, Terzi RG, Carvalho CH, et al. Alveolar dead space and capnographic variables before and after thrombolysis in patients with acute pulmonary embolism. Vasc Health Risk Manag. 2009;5(1):9-12. 19. Moreira MM, Terzi RGG, Paschoal IA, et al. Trombólise na embolia
pulmonar maciça com base na capnograia volumétrica [Thrombolysis in massive pulmonary embolism based on the volumetric capnography]. Arq Bras Cardiol. 2010;95(4):e97-e100.
21. Ribeiro MÂGO, Silva MTN, Ribeiro JD, et al. Capnograia volumétrica como meio de detectar obstrução pulmonar periférica precoce em pacientes com ibrose cística [Volumetric capnography as a tool to detect early peripheric lung obstruction in cystic ibrosis patients]. J Pediatr (Rio J). 2012;88(6):509-17.
22. Schwardt JD, Gobran SR, Neufeld GR, Aukburg SJ, Scherer PW. Sensitivity of CO2 washout to changes in acinar structure in a single-path model of lung airways. Ann Biomed Eng. 1991;19(6):679-97.
23. Schreiner MS, Leksell LG, Gobran SR, et al. Microemboli reduce phase III slopes of CO2 and invert phase III slopes of infused SF6. Respir Physiol. 1993;91(2-3):137-54.
24. West JB. Respiratory Physiology. The Essentials. Baltimore: Williams and Wilkins; 1985.
25. Ream RS, Schreiner MS, Nef JD, et al. Volumetric capnography in children. Inluence of growth on the alveolar plateau slope. Anesthesiology. 1995;82(1):64-73.
26. Conde J, Scotece M, Gómez R, et al. Adipokines: biofactors from white adipose tissue. A complex hub among inlammation, metabolism, and immunity. Biofactors. 2011;37(6):413-20.
27. Margetic S, Gazzola C, Pegg GG, Hill RA. Leptin: a review of its peripheral actions and interactions. Int J Obes Relat Metab Disord. 2002;26(11):1407-33.
28. Bado A, Levasseur S, Attoub S, et al. The stomach is a source of leptin. Nature. 1998;394(6695):790-3.
29. Vernooy JH, Drummen NE, van Suylen RJ, et al. Enhanced pulmonary leptin expression in patients with severe COPD and asymptomatic smokers. Thorax. 2009;64(1):26-32.
30. Hamrick MW, Ferrari SL. Leptin and the sympathetic connection of fat to bone. Osteoporos Int. 2008;19(7):905-12.
31. Torday JS, Rehan VK. On the evolution of the pulmonary alveolar lipoibroblast. Exp Cell Res. 2016;340(2):215-9.
32. Huang K, Rabold R, Abston E, et al. Efects of leptin deiciency on postnatal lung development in mice. J Appl Physiol (1985). 2008;105(1):249-59. 33. ad hoc Statement Committee, American Thoracic Society. Mechanisms and limits of induced postnatal lung growth. Am J Respir Crit Care Med. 2004;170(3):319-43.
34. Hyde DM, Blozis SA, Avdalovic MV, et al. Alveoli increase in number but not size from birth to adulthood in rhesus monkeys. Am J Physiol Lung Cell Mol Physiol. 2007;293(3):L570-9.
35. Narayanan M, Owers-Bradley J, Beardsmore CS, et al. Alveolarization continues during childhood and adolescence: new evidence from helium-3 magnetic resonance. Am J Respir Crit Care Med. 2012;185(2):186-91.
36. Shah N, Roux F. The relationship of obesity and obstructive sleep apnea. Clin Chest Med. 2009;30(3):455-65, vii.
37. Chau EH, Lam D, Wong J, Mokhlesi B, Chung F. Obesity hypoventilation syndrome: a review of epidemiology, pathophysiology, and perioperative considerations. Anesthesiology. 2012;117(1):188-205.
38. Baltieri L, Peixoto-Souza FS, Rasera-Junior I, et al. Análise da prevalência de atelectasia em pacientes submetidos à cirurgia bariátrica [Analysis of the prevalence of atelectasis in patients undergoing bariatric surgery]. Rev Bras Anestesiol. 2016;66(6):577-82.
39. Vaz AP, Drummond M, Mota PC, et al. Translation of Berlin Questionnaire to Portuguese language and its application in OSA identiication in a sleep disordered breathing clinic. Rev Port Pneum. 2011;17(2):59-65. 40. Ferreira MS, Mendes RT, Marson FAL, et al. Espirometria e capnograia
volumétrica na avaliação da função pulmonar de indivíduos obesos e eutróicos sem asma [Spirometry and volumetric capnography in lung function assessment of obese and normal-weight individuals without asthma]. J Pediatr (Rio J). 2017;93(4):398-405.
Sources of funding: This work was supported by CAPES (Coordenação de Aperfeiçoamento de Pessoal de Nível Superior) – grant number 01-P-4354-15
Conlict of interest: None
Date of irst submission: March 24, 2017
Last received: September 22, 2017
Accepted: October 1, 2017
Address for correspondence:
Débora Aparecida Oliveira Modena
Departamento de Cirurgia, Faculdade de Ciências Médicas da Universidade Estadual de Campinas (FCM/UNICAMP) Rua Alexander Fleming, s/no