www.drink-water-eng-sci.net/3/53/2010/
©Author(s) 2010. This work is distributed under the Creative Commons Attribution 3.0 License.
Engineering and Science
Open Access
NOM characterization and removal at six Southern
African water treatment plants
J. Haarhoff1, M. Kubare1, B. Mamba2, R. Krause2, T. Nkambule2, B. Matsebula2, and J. Menge3
1Department of Civil Engineering Science, University of Johannesburg,
P.O. Box 524, Auckland Park 2006, South Africa
2Department of Chemical Technology, University of Johannesburg,
P.O. Box 524, Auckland Park 2006, South Africa
3City of Windhoek, P.O. Box 59, Windhoek, Namibia
Received: 17 August 2009 – Published in Drink. Water Eng. Sci. Discuss.: 10 November 2009 Revised: 8 April 2010 – Accepted: 8 April 2010 – Published: 15 April 2010
Abstract. Organic pollution is a major concern during drinking water treatment. Major challenges attributed to organic pollution include the proliferation of pathogenic micro-organisms, prevalence of toxic and physio-logically disruptive organic micro-pollutants, and quality deterioration in water distribution systems. A major component of organic pollution is natural organic matter (NOM). The operational mechanisms of most unit processes are well understood. However, their interaction with NOM is still the subject of scientific research. This paper takes the form of a meta-study to capture some of the experiences with NOM monitoring and anal-ysis at a number of Southern African Water Treatment Plants. It is written from the perspective of practical process selection, to try and coax some pointers from the available data for the design of more detailed pilot work. NOM was tracked at six water treatment plants using dissolved organic carbon (DOC) measurements. Fractionation of the DOC based on biodegradability and molecular weight distribution was done at a water treatment plant in Namibia. A third fractionation technique using ion exchange resins was used to assess the impact of ozonation on DOC. DOC measurements alone did not give much insight into NOM evolution
through the treatment train. The more detailed characterization techniques showed that different unit processes
preferentially remove different NOM fractions. Therefore these techniques provide better information for
pro-cess design and optimisation than the DOC measurement which is routinely done during full scale operation at these water treatment plants.
1 Introduction
In most parts of the world there is increased concern
to-wards the effects of organic pollution on drinking water
treatment. Major challenges attributed to organic
pollu-tion include the proliferapollu-tion of pathogenic micro-organisms, prevalence of toxic and physiologically disruptive organic micro-pollutants, and quality deterioration in water distribu-tion systems (Hem and Efraimsen, 2001). However, since the number of organic compounds present in water is large, it is
very difficult to monitor them individually during full scale
operation. Thus, surrogate measurements are widely used. Table 1 shows selected organic pollutants that are regulated
Correspondence to:M. Kubare (mkubare@gmail.com)
by the USEPA and in South Africa. Dissolved organic
car-bon (DOC) is the organic matter, measured as C in mg/l,
passing through a 0.45µm filter while the other parameters
Table 1.Regulated organic chemicals.
Determinant Unit EPA max limit (2009)2 South African max limit (2005)3
Dissolved organic carbon (DOC) mg/l Not mentioned 10
Total Trihalomethanes (TTHMs) mg/l 0.080 0.2
Polychlorinated biphenyls (PCBs) mg/l 0.0005 Not mentioned
Pesticides (sum) mg/l 0.00051 Not mentioned
1,1,2-Trichloroethane mg/l 0.005 Not mentioned
Vinyl chloride mg/l 0.002 Not mentioned
Halo-acetic acids (HAA5) mg/l 0.060 Not mentioned
1Value is from European Union guidelines.
2Source: Environmental Protection Agency, USA
3Source: South African National Standard (SANS) 241 Drinking Water Specifications
NOM had been implicated as the direct cause for the for-mation and proliferation of some organic micro-pollutants. Chlorination of NOM can lead to the formation of tri-halomethanes (THMs), and reaction with ozone can form toxic peroxide radicals, and physiologically disruptive alde-hydes among other harmful by-products (Amy et al., 1988;
Arruda and Fromm, 1989; Gunten et al., 2001; Westerhoff
et al., 2004). Additionally, NOM had been shown to be di-rectly responsible for several physical and bio-chemical wa-ter quality problems. NOM could be responsible for the colour, undesirable taste and odour of natural waters; is a source of nutrients for heterotrophic bacteria; promotes bac-terial re-growth and deposition of particles in the distribu-tion system (Escobar and Randall, 2000; Lehtola et al., 2001; Olivieri et al., 1984; Liua et al., 2002) which compromises water quality and increases turbidity at the consumer. Fur-thermore, NOM interferes with the performance of several unit processes. NOM could be responsible for high coag-ulant demand (Edzwald and Tobiason, 1999); rapid
clog-ging of filters by biofilm growth on media (Haarhoff and
Van Staden, 2006); rapid saturation of activated carbon beds thereby increasing the regeneration frequency; high disin-fectant demand; inhibition of the impact of disindisin-fectants; rapid decay of ozone; inhibition of precipitative processes which form the backbone of drinking water treatment; is a major membrane foulant (Lee et al., 2003) and may inhibit the removal of organic micro-pollutants by activated carbon. Given the inevitable occurrence of NOM in all natural water sources, more attention should be directed towards the sys-tematic consideration of NOM – its structure and occurrence in raw water sources, its flow and fate during water treatment processes, and its analytical fractionation into parts that can guide engineers towards more optimal process selection and design.
Larger treatment plants in Southern Africa rely almost ex-clusively on surface water sources, which are often compro-mised due to high return flows and indirect reuse. Water temperature is high, many surface water impoundments are
eutrophic and NOM concentrations are high (Swartz et al., 2004). Considering the often poor performance of wastewa-ter treatment plants, changes in land use patwastewa-terns due to rapid industrial development, increased use of chemicals in agri-culture, and new settlements, good drinking water has to be produced from ever changing and compromised raw water sources. The water sector is understandably concerned about the levels of NOM in drinking water, finding legal
expres-sion as a DOC guideline limit of 5 mg/l and a maximum of
10 mg/l. This forced attention to the flow and fate of NOM
in treatment plants, led to a number of smaller studies at dif-ferent locations in recent years.
This paper takes the form of a meta-study to capture some of the experiences with NOM monitoring and analysis at a number of Southern African Water Treatment Plants (WTPs). It is written from the perspective of practical process selec-tion, to try and coax some pointers from the available data for the design of more detailed pilot work. The main objectives are to:
1. Demonstrate that the normal routine monitoring of DOC does not bring much insight into process perfor-mance.
2. Enumerate selected methods for fractionating the NOM
and their possible relevance to different treatment
pro-cesses.
3. Evaluate the performance of treatment processes by tracking the removal and transformation of NOM
through different treatment trains using three different
fractionation techniques.
Table 2.WTPs configurations.
Plant Pre-treatment Conventional Treatment Advanced Treatment Disinfection
Vaalkop None EC O3+GAC Chloramination
Vereeniging None EC+ST None Chloramination
Balkfontein None EC+ST+RSF None Free chlorine
Stilfontein None DAF+ST O3+RSF Free chlorine
Von Bach None ST+RSF None Free chlorine
Goreangab Pre-ozonation EC+DAF+RSF O3+BAC+GAC+UF Free chlorine
EC=Enhanced Coagulation, ST=Settling Tank, RSF=Rapid Sand Filtration, DAF=Dissolved Air Flotation, O3=Ozonation,
GAC=Granular Activated Carbon, BAC=Biological Activated Carbon, UF=Ultrafiltration
2 Tracking unfractionated NOM during full-scale treatment
The removal and transformation of NOM during full scale
treatment was tracked using DOC measurements. DOC
varies with the type of water from approximately 0.5 mg/l for
groundwater and seawater to over 30 mg/l for coloured
wa-ter from swamps (Thurman and Malcolm, 1981). From the perspective of evaluating NOM treatment, Chen et al. (2007) grouped unit processes into four classes:
– pretreatment (includes pre-oxidation using ozone or
permanganate)
– conventional (includes enhanced coagulation, dissolved
air flotation, settling and rapid sand filtration)
– advanced (includes granular activated carbon, oxidation
preceding biofiltration and membrane filtration)
– disinfection (includes free chlorine, chloramination, or
sequential chlorination)
In this paper we present results from six water treatment plants (WTPs) in Southern Africa, namely: Vaalkop (owned and operated by Magalies Water, South Africa), Vereenig-ing (Rand Water, South Africa), Balkfontein (Sedibeng Wa-ter, South Africa), Stilfontein (Midvaal WaWa-ter, South Africa), Von Bach (NamWater, Namibia) and Goreangab (Windhoek City Council, Namibia). The configurations of the WTPs studied are shown in Table 2 according to the classifica-tion of Chen et al. (2007). Pretreatment is only applied at Goreangab. Conventional treatment forms the core of the NOM treatment at the Vereeniging, Balkfontein and Von
Bach WTPs. Advanced treatment is applied at Vaalkop
where ozonation precedes granular activated carbon; Stil-fontein where ozonation precedes rapid sand filtration; and Goreangab which has a comprehensive treatment scheme comprising of ozonation, biological activated carbon, granu-lar activated carbon, and ultrafiltration as advanced treatment steps.
DOC Removal at six Southern African WTPs
0 2 4 6 8 10 12 14 16 18
Vaalkop Vereeniging Balkfontein Stilfontein Von Bach Goreangab
Water Treatment Plant
DO
C (
m
g/L)
Raw Water Phase Separation Rapid Sand Filtration Ozonation
Granular Activated Carbon Biological Activated Carbon Final Water
P
P
P
Figure 1.DOC removal for the individual unit processes at the six Water Treatment Plants.
2.1 Experimental
During full scale operation, DOC is only measured in the raw and final water. In order to evaluate each individual unit process, additional sampling and laboratory analyses were required to supplement the routine monitoring data. Samples were collected from the raw water, after each unit process and from the final treated water. Two litres of each sam-ple were collected at each site, stored in the refrigerator at
4◦C and analysed within 24 h. DOC was measured by
quan-tifying the amount of carbon dioxide formed upon
inciner-ation of a water sample (after filtrinciner-ation through a 0.45µm
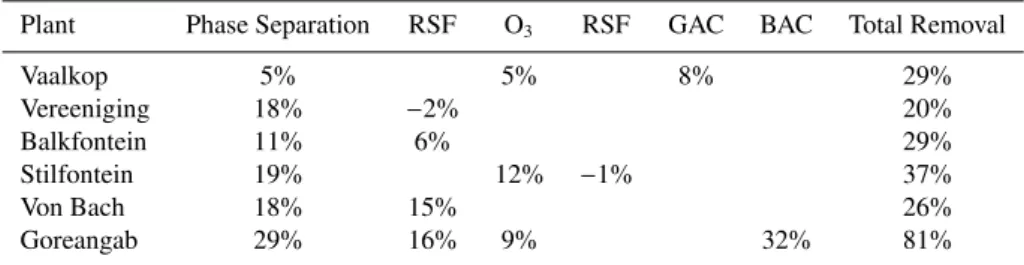
Table 3.DOC removal per unit process at the six WTPs (total removal not equal to sum of processes due to not all the processes being listed).
Plant Phase Separation RSF O3 RSF GAC BAC Total Removal
Vaalkop 5% 5% 8% 29%
Vereeniging 18% −2% 20%
Balkfontein 11% 6% 29%
Stilfontein 19% 12% −1% 37%
Von Bach 18% 15% 26%
Goreangab 29% 16% 9% 32% 81%
All abbreviations same as previously defined in Table 2.
2.2 Results
Figure 1 shows the DOC removal at the six WTPs for each unit process. The DOC levels in the raw water are very high
(>10 mg/l) at all the WTPs except Von Bach. Therefore DOC
removal is an important operational objective at these WTPs
as it is above the prescribed maximum limit of 10 mg/l in
treated water. However, the DOC removal is poor with DOC
values mostly greater than the guideline value of 5 mg/l in the
final treated water except at Von Bach and Goreangab where
the DOC is reduced to 4.2 mg/l and 2.0 mg/l respectively in
the treated water.
Table 3 shows the DOC removal for each individual unit process. Enhanced Coagulation (EC), Dissolved Air Floata-tion (DAF), and Settling Tank (ST) are primarily phase sep-aration methods and have been grouped together in Table 3 for analysis. Evidently, DOC removal is inconsistent for each
individual process for different raw water sources hinting at
strong differences in the NOM composition between the raw
water sources such as molecular weight and bio-availability. This demonstrates that the monitoring of DOC only brings limited insight into process performance and thus is not ad-equate for design or process optimization. Therefore further DOC characterization is required to reveal the NOM
charac-teristics responsible for these differences.
NOM is a collection of organic molecules with highly ver-satile chemical and physical structures. Organic compounds found in natural waters can be classified into six major struc-tural groups, namely: humic substances, hydrophilic acids, carboxylic acids, carbohydrates, amino acids, and hydrocar-bons. From this composition, we can deduce six proper-ties of NOM relevant to water treatment, namely: (1) hu-micity, (2) bioavailability, (3) molecular weight distribution,
(4) functional groups, (5) hydrophobicity/hydrophilicity, and
(6) charge distribution (Mwesigwa, 2007). Tracking these properties of NOM through the treatment train can reveal more information about process performance than the analy-sis presented in this section.
3 Fractionation of NOM into biodegradable and non-biodegradable fractions
This section deals with the bio-available fractionation of the NOM identified above, which classifies NOM based on its ability to support microbial growth. This is important in or-der to evaluate the biostability of water and disinfection de-mand in the distribution system and the performance of in-dividual unit processes. Bio-available NOM had been pre-viously quantified as assimilable organic carbon (AOC) and biodegradable dissolved organic carbon (BDOC) (Escobar and Randall, 2000; Liua et al., 2002).
AOC is the part of DOC that can be easily assimilated by bacteria and converted to cell mass and indicates bacterial re-growth potential in the distribution system. AOC is mainly related to NOM with molecular weight less than 1000 Dal-ton. This fraction of NOM with molecular weight less than 1000 Dalton corresponds to 16–38% of DOC and 4–9% of the colour (Hem and Efraimsen, 2001). BDOC is a mea-sure of both the DOC that is mineralised and assimilated by bacteria and indicates disinfection demand and disinfec-tion by-product formadisinfec-tion potential (DBFP). The quotient
AOC/BDOC may be regarded as an indication of the relative
biological stability of the biodegradable organic compounds present in drinking water (Van der Kooij, 1990). AOC and BDOC therefore provide complementary information. Based on the above, BDOC should be more suitable as a treatment process control parameter while AOC should be more suit-able for distribution system water quality control. Very few studies in South Africa had been done using AOC, but more recently BDOC has been included in studies from Namibia.
3.1 Experimental
For the determination of BDOC, an inoculum was added to a fixed mass of sample, aerated and kept at ambient tem-perature. For the measurements reported in this study, the
ambient temperature was 18oC during the winter months and
22◦C in summer. Daily measurements of DOC were taken
until no further change in DOC could be observed. This took
Table 4.Tracking NOM at the New Goreangab Water Reclamation Plant (removal expressed as percentages of the raw water concentration).
Stage DOC BDOC NBDOC DOC BDOC NBDOC
(mg/l) (mg/l) (mg/l) (% Removal) (% Removal) (% Removal)
Raw water 10.81 3.20 7.61 – – –
DAF 7.66 2.77 4.88 29 13 36
RSF 6.45 1.27 5.17 11 47 24
O3 5.89 2.37 3.51 5 −34 −6
BAC 3.95 1.29 2.66 18 34 11
Final water 1.97 0 1.97 18 40 9
Total Removal (%) 82 100 74
between the initial DOC and the final DOC. This procedure was optimised for inoculum size, incubation period and aer-ation.
During the study reported here, biologically active antracite was taken from an operational rapid sand filter at a water treatment plant, providing a well adapted heteroge-neous culture. The anthracite was pre-washed 10 times with distilled water until no DOC in the distilled water was de-tected. The initial DOC of the water sample to be tested
(DOCo) was then determined. A water sample of 300 ml was
mixed with 100 g of antracite and mixed gently. Air flow
at a rate of 2–4 l/h was bubbled continuously through the
water-anthracite mixture at ambient temperature for 5 days. Every 24 h a 20 ml sample was taken and filtered through a
0.45µm filter to determine the DOC on a Tekmar Dohrman
Phoenix 8000 Total Organic Carbon analyser. The diff
er-ence between the initial DOCi and the minimum DOCmin
reached after 5 days was regarded as the BDOC. The
dif-ference DOCi-DOComust be less than 0.2 mg/l according to
the assay. The DOCminwas taken as the non-biodegradable
dissolved organic carbon fraction (NBDOC).
This sampling and analysis programme formed part of research project at the New Goreangab Water Reclamation Plant (NGWRP) in Windhoek and is documented elsewhere in more detail (Menge et al., 2009).
3.2 Results
The New Goreangab Water Reclamation Plant uses a blend
of water from a dam and effluent from a wastewater
treat-ment plant as the raw water source in a ratio which varies from 1:20 to 1:12. The configuration of the plant consists
of pre-ozonation (O3), enhanced coagulation (EC), dissolved
air flotation (DAF), followed by sand filtration (SF),
ozona-tion (O3), and biological activated carbon (BAC). After BAC
water passes through granular activated carbon (GAC), ul-trafiltration (UF), chlorination (CL), and stabilization (SB) with sodium hydroxide to achieve a calcium carbonate
pre-cipitation potential (CCPP) of 2 to 4 mg/l as calcium
carbon-ate. Grab samples were collected after each treatment step
for analysis. Four replicates were collected during each sam-pling period. Samples were collected during the period from October 2007 to November 2008. Average values for the DOC tracking after various treatment units for one sampling run are shown in Table 4.
The following observations can be made from these results:
1. NBDOC and BDOC are 70% and 30% respectively in the raw water. This is consistent with the composition
of the raw water, which consists mainly of effluent from
a wastewater treatment plant.
2. DAF preferentially removes the NBDOC fraction and is fairly unresponsive to the biodegradable part of the DOC.
3. RSF targets mostly the BDOC fraction. Haarhoffand
Van Staden (2006) demonstrated the existence of an ac-tive biofilm in rapid sand filters. Biological activity in this biofilm might be responsible for the consumption of the BDOC fraction. This unit process reduces the BDOC fraction to only 20% of the total DOC.
4. O3increases the BDOC fraction by 34%. This is
consis-tent with the common understanding that ozone breaks down larger, complex molecules to smaller biodegrad-able units.
5. BAC reduces the BDOC fraction by 34%, an equal magnitude to the increase in BDOC during ozonation.
Therefore O3and BAC are complimentary processes.
There is 100% removal of BDOC in the effluent and the
re-maining 1.97 mg/l of DOC in the effluent is entirely NBDOC.
4 Fractionation of NOM by liquid size exclusion chromatography (LSEC)
Liquid size exclusion chromatography (LSEC) is a technique which fractionates NOM based on molecular weight distri-bution (MWD). Size is an important characteristic in water
treatment as diffusion coefficients and removal efficiencies
are directly dependent on the size of the solute. NOM
ex-hibits different characteristics depending on its MWD both
in terms of treatability and potential water quality problems. The design, integration and performance of processes such as coagulation, dissolved air flotation, solid media and mem-brane filtration, sorption on granular activated carbon, disin-fection and potential re-growth in the distribution system are strongly influenced by the MWD of the NOM (Tadanier et al., 2000).
This sampling and analysis programme formed part of a research project at the Goreangab water treatment plant and is documented elsewhere in more detail (Jacquemet et al., 2007).
4.1 Experimental
The LSEC consists of a liquid chromatography column cou-pled to on-line ultraviolet absorbance (UVA), Fluorescence and DOC detectors. The chromatography column separates NOM molecules based on molecular size so that the largest molecules are eluted first and the smallest molecules are eluted last in the column. This is because molecules that are smaller than the pore size can enter the particles and will thus have longer transit time than larger molecules as the larger molecules can not penetrate the pores very deeply. The elu-tion time can then be plotted against the DOC on one axis,
the UVA, and/or the Fluorescence on the other axis. Using
the resultant plot, NOM can then be characterised into high or low molecular weight and humic or non-humic fractions. However, it should be noted that other properties of the
sta-tionary phase such as surface charge also affect the retention
time of the fractions.
Using a calibration based on potassium
hydrogenophta-late, the different peaks of the chromatogram were integrated
to define and evaluate the proportion of each organic frac-tion. The chromatographable DOC (CDOC) was measured as the sum of all chromatographic fractions identified; hence this is the hydrophobic part of NOM. The hydrophilic
frac-tion (HDOC) was then determined as the difference between
the total DOC and CDOC.
The first fraction was detected after 25–35 min and this comprises the largest molecules attributed to
polysaccha-rides (PS), proteins and colloids. The second peak was
observed after 35–50 min and is attributed to aromatic or-ganic molecules of high molecular weight such as humic
sub-stances and the corresponding building blocks (HS+BB).
The third fraction, detected after 50–60 min, comprises the
Table 5. Removal rates of the three molecular weight fractions of NOM.
Stage Removal Rate (%)
PS∗ HS+BB A+N
DAF 39 24 23
SF 13 6 15
O3 1 13 9
BAC −11 −3 2
GAC 19 29 33
UF 19 −2 −2
∗Considering the small fraction of PS in the raw water (
<5%), the removal percentages of this fraction shown in the table are not con-clusive also because of the accuracy limitations of the equipment.
smallest molecules and is attributed to low molecular weight
organic acids and neutrals (A+N).
4.2 Results
The proportions of these fractions in the sewage effluent
were: PS<5%, HS+BB=60–65% and A+N=15%.
Con-sidering the ratio between dam water and sewage effluent
re-spectively, the blend exhibited a composition similar to the
sewage effluent. The removal of the three fractions is shown
in Table 5 after each unit process.
The following observations can be made:
1. DAF removes the highest molecular weight fractions better, while the removal of the intermediate and lower molecular weight fractions is comparable.
2. SF targets the highest and lowest molecular weight frac-tions. Biodegradation in the biofilm is probably respon-sible for the removal of the lowest molecular weight fractions because they are likely to be highly
biodegrad-able. Lower molecular weight compounds of NOM
enhance biodegradability because they are more eas-ily transported across the bacterial cell membrane and attacked by the metabolic enzymes (Leisinger et al., 1981).
4. The increase in PS during BAC treatment may be pos-sibly explained by the increase in excretion products of the bacteria growing on the media. Alternatively, resid-ual ozone is left in the water after the preceding ozona-tion step.
5. Results for GAC are consistent with the literature that it targets mostly low to intermediate molecular weight fractions. A portion of the GAC may also be functioning as a BAC.
6. Ultrafiltration is observed to target the high molecular weight fractions. This is probably due to size rejection by the membranes.
5 Fractionation of NOM by ion exchange resins
NOM can be characterised into hydrophobic and hydrophilic
fractions based on their affinity for water. The hydrophilic
fraction has more affinity for water and is composed mainly
of low molecular weight carbohydrates, proteins and amino
acids. The hydrophobic fraction has less affinity for
wa-ter thus more soluble in organic solvents and is
com-posed mainly of humic and fulvic acids. The affinity
for water by the hydrophilic species is attributed to their
charged/polarized molecular structure which enables them to
form hydrogen bonds with water thus more readily soluble in water than polar solvents. The hydrophobic species tend to be electrically neutral and non-polar, and thus readily soluble in neutral and non-polar solvents.
The hydrophobic and hydrophilic species can be further partitioned based on their ability to donate or accept a proton into acidic, basic, and neutral sub-groups. The acidic group is comprised mainly of carboxylic acids and phenols and it is the anionic character of this functional group that gives
NOM its aqueous solubility, high affinity for metal
complex-ation, and buffer capacity. The basic group is composed of
amines and amides and is found in amino acids, poly pep-tides and aquatic humic substances. Because they are basic, they are readily adsorbed by sediments (Thurman and Mal-colm, 1981). The most important neutral functional groups of NOM are hydroxyl, ether, ketone, aldehyde, ester and lac-tone. These functional groups are present in aquatic humic substances, carbohydrates, tannins, and ketoacids and be-cause they contain oxygen, they are able to form bonds with water molecules when they dissolve.
5.1 Experimental
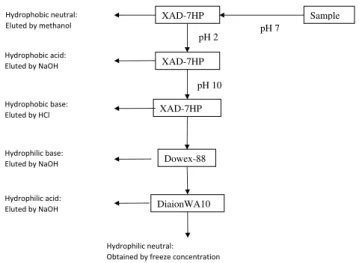
Ion exchange resins at pre-adjusted pH values were used to fractionate the NOM. Amberlite XAD resins were used to isolate the hydrophobic fractions of NOM. Dianion WA-10 and Dowex 88 resins were used after the XAD resins to iso-late the hydrophilic fractions. This procedure was done at pre-adjusted pH using appropriate solvents to elute the ad-sorbed fractions. Six NOM fractions were obtained, namely:
Sample XAD-7HP
XAD-7HP
pH 7 pH 2
XAD-7HP
Dowex-88
DiaionWA10
Hydrophilic base: Eluted by NaOH Hydrophobic base: Eluted by HCl Hydrophobic acid: Eluted by NaOH Hydrophobic neutral: Eluted by methanol
Hydrophilic acid: Eluted by NaOH
Hydrophilic neutral: Obtained by freeze concentration
pH 10
Figure 2.Steps applied during NOM fractionation using ion exchange resins.
hydrophobic acids (HpoA), hydrophobic bases (HpoB), drophobic neutrals (HpoN), hydrophilic acids (HpiA), hy-drophilic bases (HpiB) and hyhy-drophilic neutrals (HpiN).
This technique was used to investigate the treatability of NOM by ozonation at Vaalkop WTP. Ozone is a highly re-active oxidant. Ozone specifically targets unsaturated bonds which results in a shift in molecular weight and a consequent increase in low molecular weight fractions (Goel et al., 1995) which are often biodegradable (Ciardelli et al., 2001).
Two litre samples were collected before and after ozona-tion and analysed for the six fracozona-tions. The methodology of this fractionation technique is illustrated in Fig. 2. This sampling and analysis programme formed part of a post-graduate project at the Department of Chemical Technology at the University of Johannesburg and is fully documented elsewhere (Nkambule, 2009).
5.2 Results
Table 6 shows the composition of the water before ozona-tion. Other studies have shown that the hydrophilic fraction is more abundant in natural water (between 55–70%) than the hydrophobic fraction while the basic fraction only constitutes 2–3% (Thurman, 1985). Therefore these water samples be-fore ozonation do not conform to the observations of earlier
researchers probably because of the effects of unit processes
preceding the ozonation.
Figure 3 shows the removal of the six NOM fractions at Vaalkop WTP by ozonation during four sampling periods.
60 J. Haarhoff et al.: NOM characterization and removal at six Southern African water treatment plants
Table 6.Composition of the water before ozonation in mg/l.
Sampling Date Hpo Hpi B A N HpoB HpoA HpoN HpiB HpiA HpiN
Dec 2007 5.4 4.9 4.5 3.2 2.6 1.3 2.3 1.8 3.2 0.9 0.8
Jan 2008 5.7 5.6 4.6 3.5 3.2 1.5 2.5 1.7 3.1 1.0 1.5
Feb 2008 6.6 6.5 5.5 3.7 3.9 1.4 3.0 2.2 4.1 0.7 1.7
Mar 2008 3.3 2.8 2.3 2.7 1.1 0.8 1.8 0.7 1.5 0.9 0.4
‐ ‐
‐ ‐ ‐
‐ ‐ ‐ ‐
‐ ‐ ‐ ‐
‐ ‐ ‐ ‐
‐
NOM Fractions Removal by Ozonation
-30% -10% 10% 30% 50% 70%
Hpo Hpi B A N HpoB HpoA HpoN HpiB HpiA HpiN
NOM Fraction
Rem
o
val
Dec-07 Jan-08 Feb-08 Mar-08
Figure 3. Removal of different NOM fractions by ozonation at Vaalkop WTP.
these properties reveals that the HpoB, HpiB, and HpiA are removed while there is an increase in the HpoA and HpoN fractions. The impact on the HpiN fraction was inconsistent. Furthermore, the magnitude of the changes in these fractions due to ozonation varied significantly during the sampling pe-riod which may point to problems with reproducibility which require further investigation.
6 Summary and conclusions
The operational mechanisms of most unit processes are well understood. However, their interaction with NOM is not well understood. Water treatment process designers would ulti-mately like to have a firm, rational footing for selecting pro-cesses for NOM removal. In its most ideal form, one would
determine the different NOM components in a raw water
source, and then select those processes that will reduce the most dominant NOM components. In this respect, the results of the research projects reported earlier are encouraging. It was possible to show that the NOM fractions responded very
differently to different unit processes. Furthermore, the
ob-served impact of some unit processes relies heavily on the technique for NOM characterisation.
NOM was tracked at six WTPs using DOC measure-ments. Fractionation of the DOC based on biodegradabil-ity and molecular weight distribution was done at a WTP in Namibia. A third fractionation technique based on the
hy-drophilic/hydrophobic characteristics of NOM was used to
assess the impact of ozonation on DOC.
DOC measurements alone did not give much insight into
NOM evolution through the treatment train. The
perfor-mance of individual processes appeared inconsistent when the raw water source was varied hinting at a strong influence of other important constituents of the NOM. Fractionation of NOM based on biodegradability was more descriptive as the transformation of the BDOC and NBDOC fractions could be related to the operational mechanisms of the individual unit processes. This technique was especially informative for ozonation, rapid sand filtration and biological activated carbon. BDOC fractionation may thus be the analytical tech-nique of choice when oxidation and biofiltration processes have to be analysed more deeply.
The results reported in this paper on molecular weight fractionation showed that rapid sand filtration targets the low and high molecular weight fractions, GAC targets the low to intermediate molecular weight fractions, and UF targets the high molecular weight fraction. These results are consistent with the operational mechanisms of these unit processes and
thus can be used for operational analysis and/or optimization
of these processes.
Fractionation using ion exchange resins showed wide
vari-ations during different sampling runs, which may point to
problems with reproducibility. The technique, however
im-perfect it may be at present, did show up large differences in
the NOM response to ozonation, which may turn out to be a potentially powerful tool for better understanding of NOM transformation and removal.
Taken together, there can be no argument that NOM frac-tionation, beyond the usual DOC analysis, is an important prerequisite for better understanding NOM, and designing of water treatment plants for its optimal removal. The results
presented in this paper, gleaned from studies by different
par-ties, clearly demonstrated the high variability of NOM at the Southern African Water Treatment Plants which treat typical
surface water, and the very different responses of different
Acknowledgements. The researchers at the University of Johannesburg appreciate the funding from the National Research Foundation of South Africa, and ESKOM’s Tertiary Support Program (TESP). The City of Windhoek appreciates the support it received from WINGOC, Veolia and University of Namibia during the NOM characterisation project executed from 2005 to 2007.
Edited by: B. Heijman
References
Amy, G., Kuo, C. J., and Sierka, R.: Ozonation of humic
sub-stances: Effects on molecular weight distributions of dissolved
organic carbon and trihalomethane formation potential, Ozone-Sci. Eng., 10, 39–49, 1988.
Arruda, J. A. and Fromm, C. H.: Relationships among
tri-halomethane formation potential, organic carbon and lake en-richment, Environ. Pollut., 61, 199–209, 1989.
Baghoth, S. A., Maeng, S. K., Rodriguez, S. G. S., Ronteltap, M., Sharma, S., Kennedy, M., and Amy, G. L.: An urban water cycle perspective of natural organic matter (NOM)-NOM in drinking
water, wastewater effluent, stormwater and seawater Natural
Or-ganic Matter: From Source to Tap Conference, Bath, UK, 2008. Chen, C., Zhang, X., He, W., Lu, W., and Han, H.: Comparison of seven kinds of drinking water treatment processes to enhance organic material removal: A pilot test, Sci. Total Environ., 93– 102, 2007.
Ciardelli, J. E., Capannelli, G., and Bottino, A.: Ozone treatment of textile wastewaters for reuse, Water Sci. Technol., 44, 61–67, 2001.
Edzwald, J. K. and Tobiason, J. E.: Enhanced coagulation: US re-quirements and a broad view, Water Sci. Technol., 40, 63–70, 1999.
Escobar, I. C. and Randall, A. A.: Sample storage on the assimil-able organic carbon (AOC) bioassay, Water Res., 34, 1680–1686, 2000.
Goel, S., Hozalski, R. M., and Bouwer, E. J.: Biodegradation of
NOM: effect of NOM source and ozone dose, J. Am. Water
Works Ass., 87, 90–105, 1995.
Gunten, U. V., Driedger, A., Gallard, H., and Salhi, E.: By-products formation during drinking water disinfection: A tool to assess
disinfection efficiency?, Water Res., 35, 2095–2099, 2001.
Haarhoff, J. and Van Staden, S. J.: Measuring the cleanliness of
filter media, Ninth Biennial WISA Conference, Durban Interna-tional Conference Centre, 2006.
Hem, L. J. and Efraimsen, H.: Assimilable organic carbon in molec-ular weight fractions of natural organic matter, Water Res., 35, 1106–1110, 2001.
Jacquemet, V., Gherman, E. C., Konig, E., and Theron-Beukes, T.: Organic Matter Evolution In The Treatment Process Of The New Goreangab Water Reclamation Plant At Windhoek, Namibia, 6th International Water Association (IWA) Specialist Conference on Wastewater Reclamation and Reuse for Sustainability – Guiding the Growth of Water Reuse, Antwerp, Belgium, 2007.
Lee, N., Amy, G., Habarou, H., and Schrotter, J. C.: Identification and control of fouling of low-pressure (MF and UF) membranes by drinking-water natural organic matter, Water science and tech-nology: Water supply, 3, 217–222, 2003.
Lehtola, M. J., Miettinen, I. T., Vartiainen, T., Myllkangas, T., and Martikainen, P.: Microbially available organic carbon, phospho-rus, and microbial growth in ozonated drinking water, Water Res., 35, 1635–1640, 2001.
Liua, W., Wua, H., Wanga, Z., Ongb, S. L., Hub, J. Y., and Ngb, W. J.: Investigation of assimilable organic carbon (AOC) and bacterial regrowth in drinking water distribution system, Water Res., 36, 891–898, 2002.
Matsebula, B.: Evaluation of Water Treatment Processes In The Re-moval of Natural Organic Matter And Disinfection By-Products Using Cyclodextrin Polymers, MSc, Chemical Technology, Uni-versity of Johannesburg, Johannesburg, 2009.
Menge, J., Nikodemus, K., and Namundjanga, J.: A Simplified Method To Determine Biodegradable Organic Carbon (BDOC) In Drinking Water, 2nd Drinking Water Quality Conference, Port Elizabeth, South Africa, 2009.
Mwesigwa, J. K.: Relating NOM characteristics to treatability of groundwater: A case study of Vitens water supply company wa-ter treatment plants, MSs, Municipal Wawa-ter and Infrastructure, UNESCO-IHE Institute for Water Education, Delft, 108 pp., 2007.
Nkambule, T.: Removal of Natural Organic Matter Using Ion Ex-change Chromatography and Cyclodextrin Polyurethanes, MSc, Chemical Technology, University of Johannesburg, Johannes-burg, 2009.
Olivieri, V. P., Bakalian, A. E., Bossung, K. W., and Lowther, E. D.: Recurrent coliforms in water distribution systems in the presence of free residual chlorine, in: Water chlorination, chemistry, en-vironmental impacts and health effects, edited by: Jolley, R. L., Bull, R. J., Davis, W. P., Katz, W., Roberts, M. H., and Jacobs, V. A., Lewis Publishers Inc., Chelsea, MI, USA, 1984.
Swartz, C. D., Morrison, I. R., Thebe, T., Engelbrecht, W. J., Cloete, V. B., Knott, M., Loewenthal, R. E., and Kruger, P.: Char-acterisation and chemical removal of organic matter in South African coloured surface waters, Water Research Comission, Re-port No. 924/1/03, 2004.
Tadanier, C. R., Berry, D., and Knocke, W. R.: Dissolved Organic Matter Apparent Molecular Weight Distribution and Number-Average Apparent Molecular Weight by Batch Ultrafiltration, Environ. Sci. Technol., 34, 2348–2353, 2000.
Thurman, E. M. and Malcolm, R. L.: Preparative isolation of aquatic humic substances, Environ. Sci. Technol., 15, 463–466, 1981.
Van der Kooij, D.: Assimilable organic carbon in drinking waters, in: Drinking water microbiology, edited by: Mcfeters, G. A., New York, 57–87, 1990.
Westerhoff, P., Chaob, P., and Mash, H.: Reactivity of natural