Mortality in HIV-Positive Individuals across Europe and
Argentina: The EuroSIDA Study
Joanne Reekie1*, Justyna D. Kowalska2, Igor Karpov3, Jurgen Rockstroh4, Anders Karlsson5,
Aza Rakhmanova6, Andrzej Horban7, Ole Kirk2,8, Jens D. Lundgren2,8, Amanda Mocroft1, for EuroSIDA in EuroCoord
1Medical School, University College London, London, United Kingdom,2Copenhagen HIV Programme, University of Copenhagen, Copenhagen, Denmark,3Belarus State Medical University, Minsk, Belarus,4University of Bonn, Bonn, Germany,5Venhaelsan-Sodersjukhuset, Stockholm, Sweden,6Medical Academy Botkin Hospital, St Petersburg, Russia,7Warsaw Medical University, Hospital of Infectious Diseases, Warsaw, Poland,8Department of Infectious Diseases, Rigshospitalet, Copenhagen, Denmark
Abstract
Background:Differences in access to care and treatment have been reported in Eastern Europe, a region with one of the fastest growing HIV epidemics, compared to the rest of Europe. This analysis aimed to establish whether there are regional differences in the mortality rate of HIV-positive individuals across Europe, and Argentina.
Methods: 13,310 individuals under follow-up were included in the analysis. Poisson regression investigated factors associated with the risk of death.
Findings:During 82,212 person years of follow-up (PYFU) 1,147 individuals died (mortality rate 14.0 per 1,000 PYFU (95% confidence interval [CI] 13.1–14.8). Significant differences between regions were seen in the rate of all-cause, AIDS and non-AIDS related mortality (global p,0.0001 for all three endpoints). Compared to South Europe, after adjusting for baseline demographics, laboratory measurements and treatment, a higher rate of AIDS related mortality was observed in East Europe (IRR 2.90, 95%CI 1.97–4.28, p,.0001), and a higher rate of non-AIDS related mortality in North Europe (IRR 1.51, 95%CI 1.24– 1.82, p,.0001). The differences observed in North Europe decreased over calendar-time, in 2009–2011, the higher rate of non-AIDS related mortality was no longer significantly different to South Europe (IRR 1.07, 95%CI 0.66–1.75, p = 0.77). However, in 2009–2011, there remained a higher rate of AIDS-related mortality (IRR 2.41, 95%CI 1.11–5.25, p = 0.02) in East Europe compared to South Europe in adjusted analysis.
Interpretations:There are significant differences in the rate of all-cause mortality among HIV-positive individuals across different regions of Europe and Argentina. Individuals in Eastern Europe had an increased risk of mortality from AIDS related causes and individuals in North Europe had the highest rate of non-AIDS related mortality. These findings are important for understanding and reviewing HIV treatment strategies and policies across the European region.
Citation:Reekie J, Kowalska JD, Karpov I, Rockstroh J, Karlsson A, et al. (2012) Regional Differences in AIDS and Non-AIDS Related Mortality in HIV-Positive Individuals across Europe and Argentina: The EuroSIDA Study. PLoS ONE 7(7): e41673. doi:10.1371/journal.pone.0041673
Editor:Patrick S. Sullivan, Rollins School of Public Health, Emory University, United States of America
ReceivedFebruary 6, 2012;AcceptedJune 25, 2012;PublishedJuly 23, 2012
Copyright:ß2012 Reekie et al. This is an open-access article distributed under the terms of the Creative Commons Attribution License, which permits unrestricted use, distribution, and reproduction in any medium, provided the original author and source are credited.
Funding:This work was supported by the European Commission BIOMED 1 (CT94-1637), BIOMED 2 (CT97-2713), the 5th Framework (QLK2-2000-00773) and the 6th Framework (LSHP-CT-2006-018632), and the 7th Framework (FP7/2007-2013, EuroCoord nu260694) programmes. The participation of centres from Switzerland was supported by The Swiss National Science Foundation (Grant 108787). The funders had no role in study design, data collection and analysis, decision to publish, or preparation of the manuscript.
Competing Interests:The authors have declared that no competing interests exist.
* E-mail: j.reekie@ucl.ac.uk
Introduction
Mortality in HIV-positive individuals continues to decrease due to improvements in combination antiretroviral therapy (cART) and its availability, although it remains higher than in the general population [1]. A high proportion of the mortality observed in HIV-positive individuals is now due to non-AIDS related causes [2,3]. However, the incidence of non-AIDS related mortality, from causes such as cardiovascular disease (CVD), liver disease, and cancer, has also declined [3]. Drug specific toxicity, lifestyle factors (smoking drug and alcohol misuse), co-infection with other viruses
(hepatitis B and C, human papillomavirus) and residual immuno-deficiency are all thought to contribute to the higher relative risk of non-AIDS related mortality observed in HIV-positive individuals compared to the general population [4].
differences in access to care and treatment compared to the rest of Europe [7,8]. Shortly after the introduction of cART, the EuroSIDA study reported that the all-cause mortality rate in Western Central Europe was significantly lower than in North and South Europe [9]. Since then, the study has grown substantially, particularly in Eastern Europe where few cohort studies are established. Additionally, to allow for comparisons outside of Europe the study includes data from Argentina, where the uptake of cART is high, with more than 95% of those in need of cART (CD4 count ,350 cells/mm3) receiving it [10]. The study provides a unique opportunity to establish whether, in the current treatment era, regional differences in the mortality rate of HIV-positive individuals remain.
Methods Ethics Statement
Informed consent and ethics committee approval were obtained in each participating centre according to national guidelines. Full study details are available at www.cphiv.dk.
Inclusion Criteria
The EuroSIDA study is a prospective study of individuals with HIV-1 in more than 100 centres across Europe, Israel and Argentina. To be eligible for inclusion into EuroSIDA, individuals must be aged 16 or older and have a pre-booked outpatient appointment at the centre. Starting in May 1994, there have been eight different periods of enrolment in EuroSIDA (cohorts I–VIII). Currently, 16,597 individuals are enrolled in EuroSIDA. The study has expanded into Eastern Europe with half of the individuals originating from Eastern European countries in Cohort VIII. Data is collected and updated at 6-monthly intervals on standardised recruitment and follow-up forms. Full study details are available at www.cphiv.dk. The incidence of LTFU in EuroSIDA has previously been reported to be fairly consistent over time at ,5% per 100 PYFU [11]. An extensive quality assurance program has been established that includes data checking at the coordinating office, as well as regular monitoring visits with source verification of all new major events, plus a random selection of individuals followed at the clinics.
Statistical Methods
Individuals were included from baseline, defined as either 1st January 2002 or enrolment into EuroSIDA, whichever occurred later, this was when EuroSIDA expanded its network in East Europe. Additionally, previous EuroSIDA studies have reported mortality rates in earlier time periods [3,12]. Follow-up was until death, or 6 months after their last recorded visit (to allow for delays in reporting death), whichever occurred first. The incidence of mortality was calculated per 1,000 person years of follow-up (PYFU) and stratified by region. Individuals were divided into 6 regions according to country of residence as follows:
N
South Europe: Greece, Israel, Italy, Portugal, Spain.N
West Central Europe: Austria, Belgium, France, Germany,Luxembourg, Switzerland.
N
North Europe: Denmark, Finland, Ireland, the Netherlands, Norway, Sweden, the United KingdomN
East Central Europe: Bulgaria, Croatia, the Czech Republic, Hungary, Poland, Romania, Serbia, SlovakiaN
Eastern Europe: Belarus, Estonia, Latvia, Lithuania, the Russian Federation, UkraineN
ArgentinaIn order to compare the regions of Europe and Argentina, South Europe was chosen as the reference group as this group contained the largest number of individuals.
For individuals who died, date and cause of death are reported by the site investigator and, since 2004, a Coding Causes of Death in HIV (CoDe) case report form is additionally completed for each fatal case and CoDe methods used to determine the underlying cause of death [13]. Deaths reported without a known cause were classified as either unknown AIDS or unknown non-AIDS mortality according to earlier developed methods [14].
Poisson regression analyses were used to investigate factors associated with the incidence of mortality. Variables investigated were age, gender, ethnic origin, smoking status, anaemia, hypertension, diabetes, hepatitis B and C status, HIV transmission group, CD4 count, any previous AIDS defining illnesses and year of follow-up. Age and year of follow-up were treated as continuous variables. CD4 count was categorised (,200, 200–349, 350–500,
$500 cell/mm3, missing) to allow for patients with missing values to remain in the analysis. Further treatment for HIV was split into 4 categories, not on cART, on cART with a viral load
,500 copies/ml, on cART with a viral load $500 copies/ml, or on cART with no viral load measurement available. cART was defined as receiving$3 antiretrovirals. A cut-off of 500 copies/ml was chosen as this was lower limit of detection of the viral load assay for some individuals. Both current (time-updated) and baseline values were investigated for variables that could change over time. Factors that were significant in univariate analysis (p,0.1) were included in multivariate analyses.
Individuals were classed as Hepatitis B positive if they had a positive HBV surface antigen test recorded and Hepatitis C positive if they had a positive HCV antibody test. Hypertension was defined as a diastolic blood pressure$90 or a systolic blood pressure$140 (mmHg) or receiving anti-hypertensive medication. If a diagnosis of insulin dependent diabetes was reported by the investigating centre or if an individual was receiving anti-diabetic medication they were classed as diabetic. Anaemia was defined as a haemoglobin level#12 or#14 (mg/dl) for females and males respectively [15]. Smoking status was defined as either never, current, previous or unknown.
All analysis was performed using SAS 9.1 (SAS institute, Cary North Carolina, USA).
Results
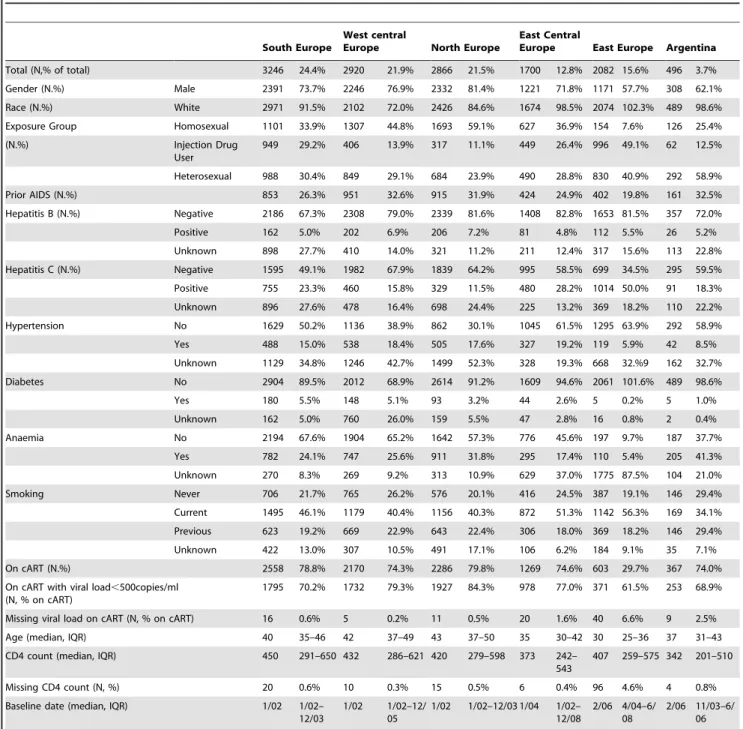
13,310 HIV-positive individuals were included in the analysis. There were clear differences in demographics across the regions (table 1). In East Europe, individuals were more likely to be younger (median age 30), female (42%) and infected via intravenous drug use [IDU] (49%) or heterosexual sex (41%). In contrast the majority of the individuals in West Central (45%), and North Europe (59%) were infected through homosexual sex. Similar baseline CD4 counts were observed across the regions. In South, West Central, North, East Central Europe and Argentina around 75–80% were on cART at baseline compared to only 30% in East Europe. In these individuals on cART, 62% in East Europe had a viral load,500 copies/ml compared to 70–85% in the other regions.
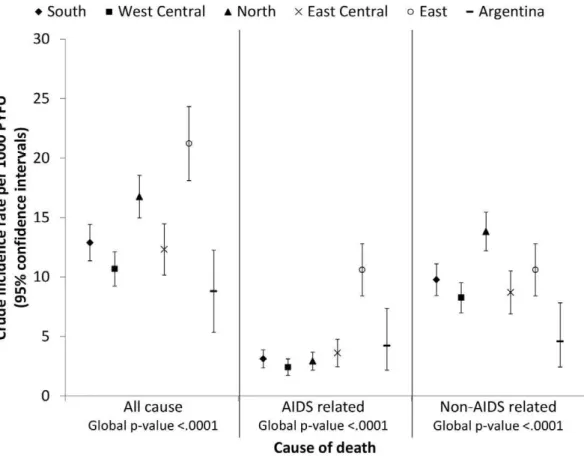
1,000 PYFU (95% CI 9.5–10.9) compared to 3.8 AIDS related deaths per 1,000 PYFU (95% CI 3.4–4.2). Figure 1 shows the crude mortality rate for all cause, AIDS and non-AIDS related causes by region. Significant differences in mortality were seen across the 6 different regions (global p,0.0001 for all three endpoints). Higher all-cause mortality rates were observed in North and East Europe compared to the other regions. In East Europe a higher rate of AIDS related mortality was observed, the crude mortality rate due to AIDS related causes in East Europe was over three times higher than in South Europe (incidence rate ratio [IRR] 3.41, 95%CI 2.48–4.68, p,0001). In contrast, a higher rate of non-AIDS related mortality was observed in North
Europe, compared to South Europe, the crude rate of non-AIDS related mortality in North Europe was 1.4 times higher (IRR 1.41, 95% CI 1.18–1.69, p,0001).
Table 2 shows the characteristics of the individuals who died at the time of their death in each of the 6 regions. Those in East Europe were younger at the time of their death and had lower CD4 counts. A higher proportion on individuals in East Europe (66%) and Argentina (68%) had experienced an AIDS event prior to their death than in the other regions. In contrast, in those dying in South, West Central, North, East Central Europe and Argentina around 30–40% had been diagnosed with a non-AIDS
Table 1.Baseline characteristics (baseline was defined as either 1stJanuary 2002 or enrolment into EuroSIDA which ever occurred later).
South Europe
West central
Europe North Europe
East Central
Europe East Europe Argentina
Total (N,% of total) 3246 24.4% 2920 21.9% 2866 21.5% 1700 12.8% 2082 15.6% 496 3.7%
Gender (N.%) Male 2391 73.7% 2246 76.9% 2332 81.4% 1221 71.8% 1171 57.7% 308 62.1%
Race (N.%) White 2971 91.5% 2102 72.0% 2426 84.6% 1674 98.5% 2074 102.3% 489 98.6%
Exposure Group Homosexual 1101 33.9% 1307 44.8% 1693 59.1% 627 36.9% 154 7.6% 126 25.4%
(N.%) Injection Drug
User
949 29.2% 406 13.9% 317 11.1% 449 26.4% 996 49.1% 62 12.5%
Heterosexual 988 30.4% 849 29.1% 684 23.9% 490 28.8% 830 40.9% 292 58.9%
Prior AIDS (N.%) 853 26.3% 951 32.6% 915 31.9% 424 24.9% 402 19.8% 161 32.5%
Hepatitis B (N.%) Negative 2186 67.3% 2308 79.0% 2339 81.6% 1408 82.8% 1653 81.5% 357 72.0%
Positive 162 5.0% 202 6.9% 206 7.2% 81 4.8% 112 5.5% 26 5.2%
Unknown 898 27.7% 410 14.0% 321 11.2% 211 12.4% 317 15.6% 113 22.8%
Hepatitis C (N.%) Negative 1595 49.1% 1982 67.9% 1839 64.2% 995 58.5% 699 34.5% 295 59.5%
Positive 755 23.3% 460 15.8% 329 11.5% 480 28.2% 1014 50.0% 91 18.3%
Unknown 896 27.6% 478 16.4% 698 24.4% 225 13.2% 369 18.2% 110 22.2%
Hypertension No 1629 50.2% 1136 38.9% 862 30.1% 1045 61.5% 1295 63.9% 292 58.9%
Yes 488 15.0% 538 18.4% 505 17.6% 327 19.2% 119 5.9% 42 8.5%
Unknown 1129 34.8% 1246 42.7% 1499 52.3% 328 19.3% 668 32.%9 162 32.7%
Diabetes No 2904 89.5% 2012 68.9% 2614 91.2% 1609 94.6% 2061 101.6% 489 98.6%
Yes 180 5.5% 148 5.1% 93 3.2% 44 2.6% 5 0.2% 5 1.0%
Unknown 162 5.0% 760 26.0% 159 5.5% 47 2.8% 16 0.8% 2 0.4%
Anaemia No 2194 67.6% 1904 65.2% 1642 57.3% 776 45.6% 197 9.7% 187 37.7%
Yes 782 24.1% 747 25.6% 911 31.8% 295 17.4% 110 5.4% 205 41.3%
Unknown 270 8.3% 269 9.2% 313 10.9% 629 37.0% 1775 87.5% 104 21.0%
Smoking Never 706 21.7% 765 26.2% 576 20.1% 416 24.5% 387 19.1% 146 29.4%
Current 1495 46.1% 1179 40.4% 1156 40.3% 872 51.3% 1142 56.3% 169 34.1%
Previous 623 19.2% 669 22.9% 643 22.4% 306 18.0% 369 18.2% 146 29.4%
Unknown 422 13.0% 307 10.5% 491 17.1% 106 6.2% 184 9.1% 35 7.1%
On cART (N.%) 2558 78.8% 2170 74.3% 2286 79.8% 1269 74.6% 603 29.7% 367 74.0%
On cART with viral load,500copies/ml (N, % on cART)
1795 70.2% 1732 79.3% 1927 84.3% 978 77.0% 371 61.5% 253 68.9%
Missing viral load on cART (N, % on cART) 16 0.6% 5 0.2% 11 0.5% 20 1.6% 40 6.6% 9 2.5%
Age (median, IQR) 40 35–46 42 37–49 43 37–50 35 30–42 30 25–36 37 31–43
CD4 count (median, IQR) 450 291–650 432 286–621 420 279–598 373 242–
543
407 259–575 342 201–510
Missing CD4 count (N, %) 20 0.6% 10 0.3% 15 0.5% 6 0.4% 96 4.6% 4 0.8%
Baseline date (median, IQR) 1/02 1/02–
12/03
1/02 1/02–12/ 05
1/02 1/02–12/03 1/04 1/02– 12/08
2/06 4/04–6/ 08
2/06 11/03–6/ 06
event prior to their death, whereas only 17% had been diagnosed in East Europe.
Table 3 gives the results of the Poisson regression analysis and presents the incidence rate ratios for all-cause, AIDS and non-AIDS related mortality for the five regions compared to South Europe. Adjusting for gender, age, HIV exposure group, AIDS diagnosis prior to baseline, non-AIDS event prior to baseline, hepatitis B and C status, hypertension, anaemia, baseline CD4 count, baseline date and baseline on cART/viral load status accounted for some of the higher rate of AIDS-related mortality observed in East Europe, though the rate of AIDS-related mortality was still more than double the rate in South Europe (IRR 2.27, 95%CI 1.42–3.46, p = 0.0006). Further, modelling age, hepatitis B and C status, hypertension, anaemia, CD4 count, year of follow-up and on cART viral load as time updated covariates the rate of AIDS related mortality was more than three times higher in East Europe compared to South.
A higher incidence of non-AIDS related mortality was observed, after adjusting for baseline variables (listed in the footnote of table 3), in North Europe (IRR 1.63, 95%CI 1.34–1.99, p,0001), East Central Europe (IRR 1.31, 95%CI 1.01–1.70, p = 0.04) and East Europe (IRR 1.81, 95%CI 1.27–2.57, p = 0.001) compared to South Europe (Table 3). After including time-updated covariates in the model the increased rate was no longer significant in East Central Europe (IRR 1.22, 95% CI 0.95–1.58, p = 0.11) or East Europe (IRR 1.29, 95% CI 0.98–1.71, p = 0.07) but there remained a significantly increased rate of mortality in North Europe (IRR 1.51, 95% CI 1.24–1.82, p,0001).
In the adjusted analyses, increasing year of follow-up was associated with a significantly lower rate of both AIDS (IRR 0.91, 95%CI 0.87–0.95, p,.0001 and non-AIDS related mortality (IRR 0.90, 95%CI 0.88–0.92, p,0001). The test for interaction between region and calendar year of follow-up was significant for all-cause (p = 0.02) and AIDS related (p = 0.05) mortality, indicating that the effect of calendar year of follow-up on mortality rate may be different in each region, although it was non-significant for non-AIDS related mortality (p = 0.10). Figure 2 shows the adjusted incidence rate ratio for mortality per calendar year of follow-up stratified by region, from the fully adjusted model. Significant decreases over time in all-cause mortality rates were observed in West Central (IRR 0.90 per calendar year later, 95%CI 0.85–0.95, p = 0.0002), North (IRR 0.85 per calendar year later, 95%CI 0.82–0.89, p,0001), and East Europe (IRR 0.89 per calendar year later, 95%CI 0.84–0.95, p0.0005). No significant changes over time in all-cause mortality were observed in South (p = 0.32) or East Central Europe (p = 0.37). Argentina was excluded from this analysis due to the limited number of patients. Despite the observed decrease in mortality in East Europe over time, in the most recent period, 2009–2011, there remained a higher rate of all-cause (IRR 1.50, 95%CI 1.50–2.38, p = 0.08) and AIDS-related mortality (IRR 2.41, 95%CI 1.11–5.25, p = 0.02) compared to South Europe in adjusted analysis. However, in 2009–2011, the significantly higher rate in North Europe was no longer observed for all-cause (IRR 0.91, 95%CI 0.58–1.42, p = 0.18) or non-AIDS related mortality (IRR 1.07, 95%CI 0.66–1.75, p = 0.77), suggesting that the differences in North Europe, relative to South, are decreasing over time.
Figure 1. Crude mortality rate across the six different regions.Cause of death are reported by the site investigator and, since 2004, a Coding of Death in HIV (CoDe) case report form is additionally completed for each fatal case and CoDe methods used to determine the underlying cause of death.
Discussion
EuroSIDA is unique amongst studies of HIV-positive individ-uals in terms of its coverage across the entire continent of Europe. The results of this study with over 67,000 PYFU found significant differences in mortality rates across regions of Europe and Argentina. In particular, individuals in East Europe were found to have a higher mortality rate from AIDS related causes and individuals in North Europe a higher rate of non-AIDS related mortality. Similar rates of both AIDS and non-AIDS related mortality were seen across the other regions of Europe and Argentina. The mortality rate decreased over time particularly in West Central, North and East Europe.
Differences in the incidence of AIDS related mortality could partly be explained by variations in patient demographics including CD4 count and use of effective cART regimens. The epidemic in Eastern Europe is more recent, from 1995 there has been a rapid increase in HIV infections [16]. Since then a number of countries in the region have expanded access to antiretroviral coverage although treatment coverage remains low. UNAIDS estimated that in 2009 19% of those eligible for treatment in East Europe were accessing it, an estimated increase of 34% since the previous year [16]. In our study, after adjustment, the rate of AIDS related mortality appeared to be decreasing over time in East Europe, which may reflect improvements in antiretroviral coverage. However, after adjustment for time-updated CD4 count, use of cART, viral load and other factors, regional differences in
AIDS related mortality were still significant, indicating that the differences cannot be fully explained by those variables collected and included in our models.
A high proportion of patients in East Europe are infected via IDU [17]. This was accounted for in the adjusted analysis but, IDU populations may differ across the regions. Several factors have been identified as contributing to the excess risk of mortality observed in IDUs in the cART era including decreased access and adherence to cART [18,19], and more comorbidities such as co-infection with hepatitis C [20,21]. In West Central Europe coverage of HIV services in IDU populations has been reported to be high, particularly access to cART [22]. However in East Europe services are low, there are low levels of needle exchange programmes [23] and very few IDUs have been found to be receiving antiretroviral treatment [22]. Opiate substitution pro-grams are available in most countries but may be very limited in East Europe. Detailed information on opiate substitution pro-grammes or whether individuals were actively injecting drug users was not available in this analysis. However, a sensitivity analysis, excluding those where the reported transmission route was IDU, found a similar increased incidence rate for East compared to South Europe, indicating that the higher prevalence of IDU does not account for the excess risk.
State-of-the-art care of HIV patients requires the utilisation of multiple health care interventions, such as the procurement of antiretroviral drugs, laboratory equipment, proper monitoring of antiretroviral treatment effectiveness and safety, and health care
Table 2.Characteristics at time of death of 1147 patients who died between 2002–2011 across Europe and Argentina.
Region
South West Central North East Central East Argentina P-value*
N died (% of total in each region) 273 (8.4%) 208 (7.1%) 337 (11.8%) 126 (7.4%) 178 (8.6%) 25 (5.0%) ,.0001 Age (median, IQR) 47 (42–57) 48 (43–59) 50 (43–59) 42 (36–54) 35 (30–41) 41 (34–48) ,.0001 CD4 count, cells/mm3(median, IQR) 208 (78–392) 249 (85–450) 260 (113–452) 236 (90–416) 156 (45–296) 58 (24–136) 0.0002
Missing CD4 count (N, %) 56 (20.5%) 39 (18.8%) 78 (23.2%) 23 (18.3%) 82 (46.1%) 11 (44.0%)
Ever started cART (N, %) 261 (95.6%) 195 (93.8%) 325 (96.4%) 112 (89.9%) 89 (50.0%) 24 (96.0%) ,.0001 HIV viral load,500 copies/ml (N,% with viral
load measured)
128 (63.1%) 101 (61.6%) 187 (71.4%) 48 (58.5%) 17 (37.0%) 6 (60.0%) 0.0005
Missing viral load (N,%) 70 (25.6%) 44(21.2%) 75 (22.3%) 44 (34.9%) 132 (74.2%) 15 (60.0%)
AIDS reported prior to death (N, %) 159 (58.2%) 123 (59.1%) 168 (49.9%) 75 (59.5%) 118 (66.3%) 17 (68.0%) ,.0001 Most recent AIDS diagnosis (N, % of AIDS
diagnosis)
Oesophageal candidiasis 12 (7.6%) 23 (18.7%) 32 (19.1%) 7 (9.3%) 26 (22.0%) 2 (11.8%)
PCP 14 (8.8%) 9 (7.3%) 25 (14.9%) 7 (9.3%) 8 (6.8%) 2 (11.8%)
HIV wasting syndrome 8 (5.0%) 12 (9.8%) 10 (6.0%) 6 (8.0%) 18 (15.3%) 1 (5.9%)
Pulmonary TB 18 (11.3%) 5 (4.1%) 6 (3.6%) 7 (9.3%) 21 (17.8% 1 (5.9%)
NHL 24 (15.1%) 10 (8.1%) 20 (11.9%) 8 (10.7%) 2 (1.7%) 1 (5.9%)
Non-AIDS event prior to death (N,%) 109 (39.9%) 63 (30.3%) 107 (31.8%) 45 (35.7%) 31 (17.4%) 8 (32.0%) ,.0001 Non-AIDS events reported (N,%)
NADM 49 (17.9%) 24 (11.5%) 45 (13.3%) 18 (14.3%) 4 (2.2%) 4 (16%)
Cardiovascular disease 32 (11.7%) 30 (14.4%) 52 (15.4%) 19 (15.1%) 3 (1.7%) 1 (4%)
Pancreatitis 10 (3.7%) 7 (3.4%) 7 (2.1%) 4 93.2%) 10 (5.6%) 0 (0%)
Liver related event 25 (9.2%) 9 (4.3%) 11 (3.3%) 10 (7.9%) 17 (9.6%) 4 (16%)
End-stage renal disease 10 (3.7%) 7 (3.4%) 5 (1.5%) 0 (0%) 1 (0.6%) 0(0%)
*Chi-squared test for categorical variables and Kruskal-Wallis for continuous variables. IQR; Inter-quartile range, PCP: Pneumocystis jiroveci pneumonia, TB: mycobacterium tuberculosis, NHL: non-Hodgkin’s lymphoma, NADM: non-AIDS defining malignancy.
infrastructure in general [16]. Not all differences in patient care will have been captured by the use of effective cART, and overall lower levels of patient care in East Europe, may play a significant role in the higher rate of AIDS related mortality. Socio-economic and infrastructure aspects, for which we do not have data [24], may also play a role.
An increased rate of non-AIDS mortality was found in patients in North Europe compared to South Europe, and these differences could not be explained by adjusting for differences in patient demographics, treatment or other risk factors that were measured such as smoking status, co-infection and CVD risk factors, either at baseline or time-updated. However, the rate of non-AIDS related mortality does appears to be decreasing over time in North Europe with no difference observed in the most recent time period. The differences in non-AIDS mortality are probably not driven by poor patient care but by underlying differences in population morbidity
and mortality. Smoking and excessive alcohol are found at an increased level in the HIV-positive population compared to the general population [25,26] and could not be fully adjusted for in these analyses. Further, Mediterranean diet has been found to be associated with a lower risk of all-cause mortality, in particular due to CVD and cancer [27]. A recent study found that middle-aged men in North Europe had a 5% and woman 28% higher risk of all-cause mortality compared to South [28]. Although we have accounted for CVD factors such as diabetes and hypertension, these data were not available for all patients. Additionally, data on alcohol use was not available for this analysis although it has recently been added to the EuroSIDA follow-up forms. Further-more, if HIV infection is accelerating the aging process [29], certain factors in North Europe such as a high intake of animal fat, smoking, and alcohol use, may be acting with this and could partly explain the differences observed, although we found no evidence
Table 3.Results from univariate and multivariate Poisson regression analysis investigating mortality rates by region (South is the reference region).
All-cause mortality Univariate Multivariatea Multivariateb
Region IRR 95% CI
p-value IRR 95% CI
p-value IRR 95% CI p-value
South Europe 1.00 – – 1.00 – – 1.00 – –
West Central Europe 0.83 0.69–0.99 0.04 0.99 0.82–1.20 0.90 0.85 0.70–1.03 0.09
North Europe 1.30 1.11–1.53 0.001 1.50 1.26–1.78 ,.0001 1.37 1.15–1.62 0.0003
East Central Europe 0.96 0.77–1.18 0.67 1.31 1.05–1.64 0.01 1.28 1.03–1.59 0.02
East Europe 1.65 1.36–1.99 ,.0001 2.07 1.57–2.73 ,.0001 1.77 1.42–2.20 ,.0001
Argentina 0.68 0.45–1.03 0.06 0.99 0.65–1.52 0.97 0.77 0.50–1.16 0.21
AIDS related mortality Univariate Multivariatec Multivariated
Region IRR 95% CI
p-value
IRR 95% CI p-value IRR 95% CI p-value
South Europe 1.00 – – 1.00 – – 1.00 – –
West Central Europe 0.77 0.53–1.13 0.18 0.84 0.57–1.23 0.36 0.72 0.49–1.06 0.09
North Europe 0.94 0.66–1.34 0.73 1.09 0.75–1.58 0.66 1.01 0.70–1.46 0.95
East Central Europe 1.16 0.78–1.74 0.46 1.29 0.84–1.97 0.24 1.43 0.93–2.19 0.10
East Europe 3.41 2.48–4.68 ,.0001 2.27 1.42–3.64 0.0006 2.90 1.97–4.28 ,.0001
Argentina 1.36 0.73–2.51 0.33 1.03 0.54–1.95 0.93 1.01 0.53–1.90 0.98
Non-AIDS related mortality Univariate Multivariatea Multivariateb
Region IRR 95% CI p-value IRR 95% CI p-value IRR 95% CI p-value
South Europe 1.00 – – 1.00 – – 1.00 – –
West Central Europe 0.85 0.69–1.04 0.11 1.01 0.81–1.26 0.92 0.88 0.70–1.10 0.27
North Europe 1.41 1.18–1.69 0.0002 1.63 1.34–1.99 ,.0001 1.51 1.24–1.82 ,.0001 East Central Europe 0.89 0.69–1.14 0.35 1.31 1.01–1.70 0.04 1.22 0.95–1.58 0.11
East Europe 1.09 0.85–1.39 0.51 1.81 1.27–2.57 0.001 1.29 0.98–1.71 0.07
Argentina 0.47 0.27–0.82 0.008 0.87 0.49–1.54 0.62 0.61 0.35–1.09 0.09
aadjusted for baseline variables gender, age, HIV exposure group, hepatitis B and C status, prior AIDS diagnosis, prior non-AIDS diagnosis, hypertension, diabetes,
anaemia, smoking status, CD4 count, baseline date and on cART viral load.
badjusted as in a but age, hepatitis B and C status, hypertension, diabetes, anaemia, smoking status, CD4 count, year of follow-up and on cART viral load were included
as time-updated covariates.
cadjusted for baseline variables gender, age, HIV exposure group, hepatitis B and C status, prior AIDS diagnosis, prior non-AIDS diagnosis, hypertension, diabetes,
anaemia, CD4 count, baseline date and on cART viral load.
dadjusted as in a but age, hepatitis B and C status, hypertension, diabetes, anaemia, CD4 count, year of follow-up and on cART viral load were included as time-updated
covariates.
that the relationship between age and mortality differed between regions (data not shown).
Another possibility is that the higher observed rate in North Europe is due to under ascertainment or incomplete reporting of mortality in other regions. Centres in some countries may be linked to national death registers allowing more complete reporting of mortality or have better methods of finding patients lost to follow-up (LTFU). LTFU in EuroSIDA is low, with individuals in North and West Central Europe having the lowest and those in East Europe the highest rates of LTFU in the study [11]. To investigate biases caused by under ascertainment of death we varied the right censoring interval from 6 months after last follow-up visit to 3 months and 1 year. The results remained consistent with the main analysis, suggesting that these differences aren’t solely due to underreporting in other regions. An analysis comparing the general HIV-negative population in these regions may also help clarify the reasons for these differences.
Demographically, individuals enrolled in the EuroSIDA study are fairly representative of each region based on comparisons with data from UNAIDS [30]. However, centres included in EuroSIDA are often university-associated clinics in larger cities, thus individuals in these clinics may have better access to care and may not be representative of all clinics in Europe, with potentially better clinical outcomes. This raises most concern in Eastern Europe, where the least favourable outcomes were seen, suggesting that improvements in this region are urgently needed. Further, within each of the regions some countries maybe quite heteroge-neous in terms of their political and economic situation, however, the groupings provide a valuable regional overview of the differences in mortality rate across Europe.
In conclusion, differences were observed in the rate of all-cause mortality among HIV-positive individuals across different regions of Europe. Individuals in Eastern Europe had an increased risk of mortality from AIDS related causes in part due to differences in use of effective cART. Individuals in North Europe had the highest rate of non-AIDS related mortality which could not easily be explained but did appear to decrease over time. These findings are important for understanding and reviewing HIV treatment strategies and policies across the European region.
Acknowledgments
The multi-centre study group on EuroSIDA (national coordina-tors in parenthesis).
Argentina: (M Losso), C Elias, Hospital JM Ramos Mejia, Buenos
Aires. Austria: (N Vetter), Pulmologisches Zentrum der Stadt Wien, Vienna; R Zangerle, Medical University Innsbruck, Innsbruck.Belarus: (I Karpov), A Vassilenko, Belarus State Medical University, Minsk, VM Mitsura, Gomel State Medical University, Gomel; O Suetnov, Regional AIDS Centre, Svetlogorsk.Belgium:(N Clumeck), S De Wit, M Delforge, Saint-Pierre Hospital, Brussels; R Colebunders, Institute of Tropical Medicine, Antwerp; L Vandekerckhove, University Ziekenhuis Gent, Gent. Bosnia-Herzegovina: (V Hadziosmanovic), Klinicki Centar Univerziteta Sarajevo, Sarajevo. Bulgaria: (K Kostov), Infectious Diseases Hospital, Sofia. Croatia: (J Begovac), University Hospital of Infectious Diseases, Zagreb. Czech Republic: (L Machala), D Jilich, Faculty Hospital Bulovka, Prague; D Sedlacek, Charles University Hospital, Plzen. Denmark: (J Nielsen), G Kronborg,T Benfield, M Larsen, Hvidovre Hospital, Copenhagen; J Gerstoft, T Katzenstein, A–B E Hansen, P Skinhøj, Rigshospitalet, Copenhagen; C Pedersen, Odense University Hospital, Odense; L Ostergaard, Skejby Hospital, Aarhus. Estonia: (K Zilmer), West-Tallinn Central Hospital, Tallinn; Jelena Smidt, Nakkusosakond Siseklinik, Kohtla-Ja¨rve. Finland: (M Ristola), Figure 2. Incidence rate ratio (IRR) for all cause, AIDS and non-AIDS related mortality per calendar year of follow-up stratified by region.(Argentina was excluded from this analysis due to limited power).aadjusted for gender, age*, HIV exposure group, hepatitis B* and C* status, prior AIDS diagnosis, prior non-AIDS diagnosis, hypertension*, diabetes*, anaemia*, smoking status*, CD4 count*, baseline date* and on cART viral load*.badjusted for gender, age*, HIV exposure group, hepatitis B* and C* status, prior AIDS diagnosis, prior non-AIDS diagnosis, hypertension*, diabetes*, anaemia*, CD4 count*, baseline date* and on cART viral load*. *time-updated.
Helsinki University Central Hospital, Helsinki. France: (C Katlama), Hoˆpital de la Pitie´-Salpe´tie`re, Paris; J-P Viard, Hoˆpital Necker-Enfants Malades, Paris; P-M Girard, Hospital Saint-Antoine, Paris; JM Livrozet, Hoˆpital Edouard Herriot, Lyon; P Vanhems, University Claude Bernard, Lyon; C Pradier, Hoˆpital de l’Archet, Nice; F Dabis, D Neau, Unite´ INSERM, Bordeaux.Germany:(J Rockstroh), Universita¨ts Klinik Bonn; R Schmidt, Medizinische Hochschule Hannover; J van Lunzen, O Degen, University Medical Center Hamburg-Eppendorf, Infectious Diseases Unit, Hamburg; HJ Stellbrink, IPM Study Center, Hamburg; S Staszewski, JW Goethe University Hospital, Frankfurt; J Bogner, Medizinische Poliklinik, Munich; G. Fa¨tkenheuer, Universita¨t Ko¨ln, Cologne. Greece: (J Kosmidis), P Gargalianos, G Xylomenos, J Perdios, Athens General Hospital; G Panos, A Filandras, E Karabatsaki, 1st IKA Hospital; H Sambatakou, Ippokration Genereal Hospital, Athens. Hungary: (D Banhegyi), Szent La´slo´ Hospital, Budapest. Ireland: (F Mulcahy), St. James’s Hospital, Dublin.Israel:(I Yust), D Turner, M Burke, Ichilov Hospital, Tel Aviv; S Pollack, G Hassoun, Rambam Medical Center, Haifa; S Maayan, Hadassah University Hospital, Jerusalem. Italy: (S Vella), Istituto Superiore di Sanita`, Rome; R Esposito, I Mazeu, C Mussini, Universita` Modena, Modena; C Arici, Ospedale Riuniti, Bergamo; R Pristera, Ospedale Generale Regionale, Bolzano; F Mazzotta, A Gabbuti, Ospedale S Maria Annunziata, Firenze; V Vullo, M Lichtner, University di Roma la Sapienza, Rome; A Chirianni, E Montesarchio, M Gargiulo, Presidio Ospedaliero AD Cotugno, Monaldi Hospital, Napoli; G Antonucci, A Testa, P Narciso, C Vlassi, M Zaccarelli, Istituto Nazionale Malattie Infettive Lazzaro Spallanzani, Rome; A Lazzarin, A Castagna, N Gianotti, Ospedale San Raffaele, Milan; M Galli, A Ridolfo, Osp. L. Sacco, Milan; A d’Arminio Monforte, Istituto Di Clinica Malattie Infettive e Tropicale, Milan.Latvia:(B Rozentale), I Zeltina, Infectology Centre of Latvia, Riga. Lithuania: (S Chaplinskas), Lithuanian AIDS Centre, Vilnius. Luxembourg: (R Hemmer), T Staub, Centre Hospitalier, Luxembourg. Netherlands: (P Reiss), Academisch Medisch Centrum bij de Universiteit van Amsterdam, Amsterdam.Norway:(V Ormaasen), A Maeland, J Bruun, Ulleva˚l Hospital, Oslo. Poland: (B Knysz) J Gasiorowski, Medical University, Wroclaw; A Horban, E Bakowska, Centrum Diagnostyki i Terapii AIDS, Warsaw; A Grzeszczuk, R Flisiak, Medical University, Bialystok; A Boron-Kaczmarska, M Pynka, M Parczewski, Medical Univesity, Szczecin; M Beniowski, E Mularska, Osrodek Diagnostyki i Terapii AIDS, Chorzow; H Trocha, Medical University, Gdansk; E Jablonowska, E Malolepsza, K Wojcik, Wojewodzki Szpital Specjalistyczny, Lodz. Portugal: (F Antunes), M Doroana, L Caldeira, Hospital Santa Maria, Lisbon; K Mansinho, Hospital de Egas Moniz, Lisbon; F Maltez, Hospital Curry Cabral, Lisbon.Romania:(D Duiculescu), Spitalul de Boli Infectioase si Tropicale: Dr. Victor Babes, Bucarest.Russia:(A Rakhmanova), Medical Academy Botkin Hospital, St Petersburg; N Zakharova, St Petersburg AIDS Centre, St Peterburg; S
Buzunova, Novgorod Centre for AIDS, Novgorod.Serbia:(D Jevtovic), The Institute for Infectious and Tropical Diseases, Belgrade.Slovakia:(M Mokra´sˇ), D Stanekova´, De´rer Hospital, Bratislava. Slovenia: (J Tomazic), University Clinical Centre Ljubljana, Ljubljana. Spain: (J Gonza´lez-Lahoz), V Soriano, P Labarga, J Medrano, Hospital Carlos III, Madrid; S Moreno, J. M. Rodriguez, Hospital Ramon y Cajal, Madrid; B Clotet, A Jou, R Paredes, C Tural, J Puig, I Bravo, Hospital Germans Trias i Pujol, Badalona; JM Gatell, JM Miro´, Hospital Clinic i Provincial, Barcelona; P Domingo, M Gutierrez, G Mateo, MA Sambeat, Hospital Sant Pau, Barcelona. Sweden: (A Karlsson), Venhaelsan-Sodersjukhuset, Stock-holm; L Flamholc, Malmo¨ University Hospital, Malmo¨.Switzerland:(B Ledergerber), R Weber, University Hospital, Zu¨rich; P Francioli, M Cavassini, Centre Hospitalier Universitaire Vaudois, Lausanne; B Hirschel, E Boffi, Hospital Cantonal Universitaire de Geneve, Geneve; H Furrer, Inselspital Bern, Bern; M Battegay, L Elzi, University Hospital Basel.Ukraine:(E Kravchenko), N Chentsova, Kiev Centre for AIDS, Kiev; V Frolov, G Kutsyna, Luhansk State Medical University; Luhansk; S Servitskiy, Odessa Region AIDS Center, Odessa; M Krasnov, Kharkov State Medical University, Kharkov.United Kingdom:(S Barton), St. Stephen’s Clinic, Chelsea and Westminster Hospital, London; AM Johnson, D Mercey, Royal Free and University College London Medical School, London (University College Campus); A Phillips, MA Johnson, A Mocroft, Royal Free and University College Medical School, London (Royal Free Campus); M Murphy, Medical College of Saint Bartholomew’s Hospital, London; J Weber, G Scullard, Imperial College School of Medicine at St. Mary’s, London; M Fisher, Royal Sussex County Hospital, Brighton; C Leen, Western General Hospital, Edinburgh.
Steering Committee:J Gatell, B Gazzard, A Horban, J Lundgren, I Karpov, B Ledergerber, M Losso, A D’Arminio Monforte, C Pedersen, A Phillips, A Rakhmanova, M Ristola, P Reiss, J Rockstroh (Chair), S De Wit (Vice-Chair)
Coordinating Centre Staff:O Kirk, A Mocroft, A Cozzi-Lepri, D
Grint, M Ellefson, D Podlekareva, J Kjær, L Peters, J Reekie, J Kowalska, J Nielsen, J Tverland, A H Fischer
EuroSIDA representatives to EuroCoord:O. Kirk, A. Mocroft, J.
Grarup, S. deWitt, P. Reiss, A. Cozzi-Lepri, R. Thiebaut, J. Rockstroh, D. Burger, R. Paredes, J. Kjær
Author Contributions
Conceived and designed the experiments: JDL OK AM. Analyzed the data: JMR JDK. Wrote the paper: JMR. National data coordination: IK JR AK AR AH. Interpretation of results: JMR JDK JDL OK AM. Critically revised manuscript: JDK IK JR AK AR AH JDL OK AM. Approved the final version of the manuscript: JMR JDK IK JR AK AR AH JDL OK AM STUDY PI: JDL OK AM.
References
1. Antiretroviral Therapy Cohort Collaboration (2008) Life expectancy of individuals on combination antiretroviral therapy in high-income countries: a collaborative analysis of 14 cohort studies. Lancet 372: 293–299.
2. Lewden C, May T, Rosenthal E, Burty C, Bonnet F, et al. (2008) Changes in causes of death among adults infected by HIV between 2000 and 2005: The ‘‘Mortalite 2000 and 2005’’ surveys (ANRS EN19 and Mortavic). J Acquir Immune Defic Syndr 48: 590–598.
3. Mocroft A, Brettle R, Kirk O, Blaxhult A, Parkin JM, et al. (2002) Changes in the cause of death among HIV positive subjects across Europe: results from the EuroSIDA study. AIDS 16: 1663–1671.
4. Deeks SG, Phillips AN (2009) HIV infection, antiretroviral treatment, ageing, and non-AIDS related morbidity. BMJ 338: a3172.
5. Joint United Nations Programme on HIV/AIDS (UNAIDS) (2009) Fact Sheet, North America and Western and Central Europe. Latest epidemiological trends. 6. UNAIDS, World Health Organization (2009) 09 AIDS epidemic update. 1–100. 7. Podlekareva D, Reekie J, Rakhmanova A, Horban A, Mocroft A, et al. (2008)
Indicators of the use of healthcare interventions across Europe.
8. Podlekareva D, Bannister W, Mocroft A, Abrosimova L, Karpov I, et al. (2008) The EuroSIDA study: Regional differences in the HIV-1 epidemic and treatment response to antiretroviral therapy among HIV-infected patients across Europe–a review of published results. Cent Eur J Public Health 16: 99– 105.
9. Chiesi A, Mocroft A, Dally LG, Miller V, Katlama C, et al. (1999) Regional survival differences across Europe in HIV-positive people: the EuroSIDA study. AIDS 13: 2281–2288.
10. UNAIDS (2009) Argentina County Sitution 2009.
11. Mocroft A, Kirk O, Aldins P, Chies A, Blaxhult A, et al. (2008) Loss to follow-up in an international, multicentre observational study. HIV Med 9: 261–269. 12. Mocroft A, Ledergerber B, Katlama C, Kirk O, Reiss P, et al. (2003) Decline in
the AIDS and death rates in the EuroSIDA study: an observational study. Lancet 362: 22–29.
13. Kowalska JD, Friis-Moller N, Kirk O, Bannister W, Mocroft A, et al. (2011) The Coding Causes of Death in HIV (CoDe) Project: initial results and evaluation of methodology. Epidemiology 22: 516–523.
14. Kowalska JD, Mocroft A, Ledergerber B, Florence E, Ristola M, et al. (2011) A standardized algorithm for determining the underlying cause of death in HIV infection as AIDS or non-AIDS related: results from the EuroSIDA study. HIV Clin Trials 12: 109–117.
15. Mocroft A, Kirk O, Barton SE, Dietrich M, Proenca R, et al. (1999) Anaemia is an independent predictive marker for clinical prognosis in HIV-infected patients from across Europe. EuroSIDA study group. AIDS 13: 943–950.
16. UNAIDS (2010) Global Report:UNAIDS report on the global AIDS epidmic. 17. UNAIDS (2009) Fact sheets. Eastern Europe and Central Asia. Latest
epidemiological trends.
18. van Asten LC, Boufassa F, Schiffer V, Brettle RP, Robertson JR, et al. (2003) Limited effect of highly active antiretroviral therapy among HIV-positive injecting drug users on the population level. Eur J Public Health 13: 347–349. 19. Wood E, Montaner JS, Yip B, Tyndall MW, Schechter MT, et al. (2003) Adherence and plasma HIV RNA responses to highly active antiretroviral therapy among HIV-1 infected injection drug users. CMAJ 169: 656–661. 20. Braitstein P, Justice A, Bangsberg DR, Yip B, Alfonso V, et al. (2006) Hepatitis
antiretroviral therapy in a population-based HIV cohort. AIDS 20: 323–331. 10.1097/01.aids.0000198091.70325.f4 [doi];00002030-200602140-00003 [pii]. 21. Murray M, Hogg R, Lima V, May M, Moore D, et al. (2011) The effect of injecting drug use history on disease progression and death among HIV-positive individuals initiating combination antiretroviral therapy: collaborative cohort analysis. HIV Med. 10.1111/j.1468-1293.2011.00940.x [doi].
22. Mathers BM, Degenhardt L, Ali H, Wiessing L, Hickman M, et al. (2010) HIV prevention, treatment, and care services for people who inject drugs: a systematic review of global, regional, and national coverage. Lancet 375: 1014–1028. S0140-6736(10)60232-2 [pii];10.1016/S0140-6736(10)60232-2 [doi].
23. Sarang A, Rhodes T, Platt L (2008) Access to syringes in three Russian cities: implications for syringe distribution and coverage. Int J Drug Policy 19 Suppl 1: S25–S36. S0955-3959(07)00244-7 [pii];10.1016/j.drugpo.2007.11.008 [doi]. 24. Hamers FF, Downs AM (2003) HIV in central and eastern Europe. Lancet 361:
1035–1044. S0140-6736(03)12831-0 [pii];10.1016/S0140-6736(03)12831-0 [doi].
25. Friis-Moller N, Sabin CA, Weber R, d’Arminio MA, El-Sadr WM, et al. (2003) Combination antiretroviral therapy and the risk of myocardial infarction. N Engl J Med 349: 1993–2003.
26. Lewden C, Salmon D, Morlat P, Bevilacqua S, Jougla E, et al. (2005) Causes of death among human immunodeficiency virus (HIV)-infected adults in the era of potent antiretroviral therapy: emerging role of hepatitis and cancers, persistent role of AIDS. Int J Epidemiol 34: 121–130.
27. Sofi F, Cesari F, Abbate R, Gensini GF, Casini A (2008) Adherence to Mediterranean diet and health status: meta-analysis. BMJ 337: a1344. 28. Vollset SE (2010) Does the southern European cardiovascular mortality
advantage extend to total mortality? 50-year trends in death risks between 40 and 70 years of age in Western European men and women. Scand J Public Health 38: 127–134.
29. Deeks SG (2011) HIV infection, inflammation, immunosenescence, and aging. Annu Rev Med 62: 141–155.