Implementing marine organic aerosols into the GEOS-Chem model
Texto
Imagem


Documentos relacionados
Simulated aerosol size distributions are in reasonable agreement with obser- vations in the marine boundary layer and in the free troposphere, while the model underestimates
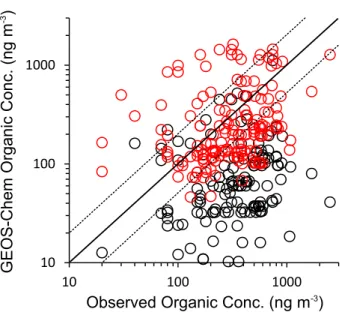
The spatial distribution of aerosol chemical com- position and the evolution of the Organic Aerosol (OA) fraction is investigated based upon airborne measurements of aerosol
(2011) found that organic aerosol particles measured at the PUY site during summer 2010 were likely linked to biogenic sources: the mass spectra of OOA (oxygenated organic aerosols)
Annual mean emissions (2006–2010) of (a) sea salt aerosol and (b) primary marine organic matter (PMOM) in sea spray aerosol, (c) the mass fraction (in the dry diameter range of
Based on previously studied emission profiles of organic compounds (Schauer et al., 1996; Simoneit et al., 2004b) and the above discussion, organic compound classes quantified in
(2011a) have simulated organic aerosol concentrations using the WRF- CHEM model in Mexico City during the same period as this study, and found that, with the contribution of glyoxal
Figure 7b, c presents contributions (%) of total diacids to total carbon (TC) and water- soluble organic carbon (WSOC), respectively. 8.8 %) reported in the remote marine
We use satellite observations of aerosol optical depth (AOD) from the Moderate Resolution Imaging Spec- trometer (MODIS) together with the GEOS-Chem global chemical transport model
