Membrane on the Temperature and the Concentration of
the Cryoprotectant
Jianye Wang, Kaixuan Zhu, Gang Zhao*, Jian Ren, Cui Yue, Dayong Gao
Institute of Biomedical Engineering, Department of Electronic Science and Technology, University of Science and Technology of China, Hefei, Anhui, People’s Republic China
Abstract
The Sf21 cell line is extensively used for virus research and producing heterologous recombinant proteins. To develop optimal strategies for minimizing cell injury due to intracellular ice formation and excessive volume shrinkage during cryopreservation, the fundamental transport properties including the osmotic inactive volume (Vb), the hydraulic conductivity (Lp), and the glycerol permeability (Ps) of Sf21 cell membrane at 25, 15, 5 and22uC were characterized using a micro-perfusion chamber. The effects of temperature on the hydraulic conductivity and the glycerol permeability of Sf21 cell membrane, reflected by the activation energies, were quantitatively investigated. It was found that the hydraulic conductivity decreases along with the increase of the final CPA concentration at a given temperature, and quantitative analysis indicates that the hydraulic conductivity has a significant linear attenuation along with the increase of the concentration of glycerol. Therefore, we incorporate the concentration dependence of the hydraulic conductivity into the classic Arrhenius relationship by replacing the constant reference value of the hydraulic conductivity at the reference temperature with a function that is linearly dependent on the CPA concentration. Consequently, the prediction of the Arrhenius relationship is improved, and the novel Arrhenius relationship could be very important to the development of optimal strategies for cell cryopreservation.
Citation:Wang J, Zhu K, Zhao G, Ren J, Yue C, et al. (2013) Dual Dependence of Cryobiogical Properties of Sf21 Cell Membrane on the Temperature and the Concentration of the Cryoprotectant. PLoS ONE 8(9): e72836. doi:10.1371/journal.pone.0072836
Editor:Xiaoming He, The Ohio State University, United States of America
ReceivedMay 13, 2013;AcceptedJuly 14, 2013;PublishedSeptember 4, 2013
Copyright:ß2013 Wang et al. This is an open-access article distributed under the terms of the Creative Commons Attribution License, which permits unrestricted use, distribution, and reproduction in any medium, provided the original author and source are credited.
Funding:This work was supported by the National Natural Science Foundation of China (Nos. 51076149, 51276179) (http://www.nsfc.gov.cn), and the Fundamental Research Funds for the Central Universities (http://www.moe.edu.cn). The funders had no role in study design, data collection and analysis, decision to publish, or preparation of the manuscript.
Competing Interests:The authors have declared that no competing interests exist. * E-mail: zhaog@ustc.edu.cn
Introduction
The Sf21 cell line, derived from the ovary of the fall armyworm (Spodoptera Frugiperda) by Vaughnet at 1977 [1], is a host of many viruses, and when combined with baculoviruses, is a powerful platform technology that is widely used for the manufacture of viral particles and heterologous recombinant proteins [2,3,4]. This robust expression system is able to produce large amounts of different proteins, with applications from basic research (protein-protein interaction, multiple-affinity (protein-protein purification, ultrasen-sitive mass spectrometry, and protein structures) [5] to clinical medicine (routine diagnostic tests, therapeutic protein drugs for various diseases, etc.) [6,7,8].
The maintenance of viable insect cell line cultures is a time-consuming and very expansive program. Long-term preservation of the insect cell lines through cryopreservation is considered to be a better alternative to meet the ever-increasing demands. Cryopreservation is an enabling technology for cell and tissue banking because metabolic activities can be arrested and life temporarily suspended at cryogenic temperatures. However, cells could be damaged upon freezing by extracellular ice formation, intracellular ice formation (IIF) [9,10] and excessive volume shrinkage [11] due to the elevation of solute concentration in the surrounding of cells. Cryoprotective agents (CPAs) are commonly
Figure 1. The micro-perfusion system.A Schematic diagram showing the arrangement of the major components. B Photograph of the micro-perfusion chamber mounted on the microscope stage.
doi:10.1371/journal.pone.0072836.g001
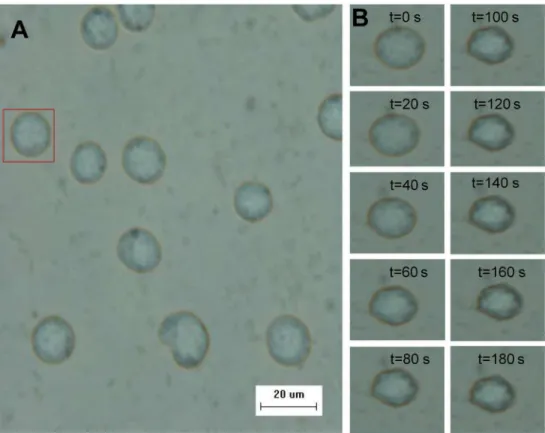
Figure 2. The morphology and volume changes of representative cell.A The Sf21 cells were immobilized on the micro-channel. B The volume changes of a typical cell during the osmotic shift from PBS to 36PBS solution at22uC.
developed a low-cost, easy-to-use microperfusion chamber for the investigation of cell osmotic responses.
The osmotic properties of the Sf21 cell membrane were experimentally studied using this micro-perfusion chamber. The membrane permeability coefficient to water (Lp), the membrane
permeability coefficient to glycerol of different concentration (Ps),
and the activation energies of water and glycerol permeability coefficients at 25, 15, 5 and 22uC have been investigated. Furthermore, the effects of the temperature and the CPA concentration on the transport properties of the Sf21 cell membrane were analyzed and a novel Arrhenius relationship was proposed for predicting the osmotic behaviors of cell membrane during cryopreservation.
Materials and Methods
Theory of Cell Membrane Transport Model
Kedem and Katchalsky proposed theK-Kmodel to descript the transport of both water and the CPA through the cell membrane [19], and theK–Kformalism can be described as follows:
Jv~
dVwzc
Adt ~{LPRT((C
e
s{Csi)zs(Cce{Cci)) ð1Þ
dNc
dt ~A C
Cc(1{s)JvzPs(Cec{Cci) ð2Þ
whereJvis the total volume flux,Vw+cis the volume of water and
solute volume, Nc is the number of moles of the permeating
solution, A is the area of the cell, and C is osmolarity of the solution. The superscript i and e represent the intra- and extracellular, respectively; the subscriptsand crepresent the salt and the CPA, respectively.sis the reflection coefficient.CCcis the
mean of the osmolarity of the CPA.
The two-parameter (2-p) model is often used to describe the cell volume response during osmotic shift in a ternary system [20]. In which, water and CPA flux across the plasma membrane can be described as follows [14,15,21]:
dVw
dt ~LpART(C
e s{C
i
s) ð3Þ
dVc
dt ~PsA(C
e c{C
i
c)VVc ð4Þ
The 2-p model employs only two parameters Lp and Ps to
describe the flux of water and CPA through the cell membranes.
V
Vc is the partial molar volume of CPA.
The water permeability at different temperatures obeys the following Arrhenius relationship [12,22,23]:
Lp(T)~Lpg:exp ( ELp
R ( 1 T0
{1
T)) ð5Þ
where ELp is the activation energies of water permeability
coefficients and Lpg is water membrane permeability coefficient
at a reference temperature (usually, at T0= 273.15 K),R is the
universal gas constant. Taking the natural logarithm in the equation simultaneously, it turns to be
Table 1.Cryobiological parameters for Sf21.
Temperature(6C) Vb/V0(%) Lp
(10214m/Pa/s) (
mm/atm/min)
25(n = 12) 54.669.1 1.11260.334 0.06860.020
15(n = 8) 50.6611.8 0.91060.277 0.05560.017
5(n = 11) 51.364.1 0.44960.090 0.02760.006
22(n = 7) 50.866.1 0.36860.101 0.02360.006 doi:10.1371/journal.pone.0072836.t001
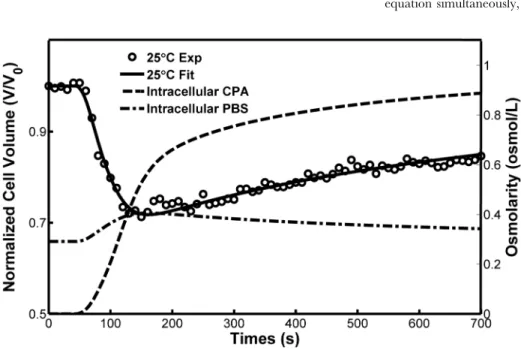
Figure 3. Volume change of a Sf21 cell and osmolarity shift of CPA and PBS in the intracellular solution during the solution from the PBS to PBS solution with 1.0 M glycerol at 256C.
ln Lpð ÞT
~ ln Lpg
zELp
RT0
{ELp
R : 1
T ð6Þ
Cell Culture and Sample Preparation
Sf21 cell line was obtained from Prof. Gang Cai as a gift [24], and SF21 cells were cultured using SF900II SFM (Gibco) without fetal bovine serum at 28uC, and the cells were harvested when the number of cells was about 16107/ml. The cells were re-suspended in PBS and centrifuged at 600 g for 5 min.
Experimental Procedure
The micro-perfusion system developed based on those of Takamatsuet al. [17,18], Gao et al.[15,16], and McGrath et al.
[14], as shown in Figure 1, was applied to study cell osmotic response in this study. The micro-perfusion chamber was mounted on the inverted microscope (Ti-FL, Nikon, Japan). SF21 cells were immobilized after the suspending cells were injected to the micro-channel. The cell volume response during the experiments was recorded to the computer via a CCD camera (DS-Ri1, Nikon, Japan) and a digital camera (DS-U3, Nikon, Japan). The image frames were extracted from the videos and saved to prepare for image processing.
In this experiment, we observed the cell volume responses after being transferred from PBS to 36PBS, and from PBS to the
solutions of different glycerol concentration at 25, 15, 5 and22uC, respectively.
Data Collection and Analysis
The video was converted into the image frames and a series of images with a 10s-interval were extracted from the images frames. The Sf21 cells were assumed to be spherical, and we could calculate the volumes of Sf21 cells thought the area of the cross section. The non-spherical shaped cells and the cells with
over-small or over-large volumes were discarded. Then the parameter was incorporated into equations (1)-(6) to fit the membrane permeability coefficients. In order to obtained a high precision fitting process, a universal self-adaptive time-varying function for the extracellular concentration profile was used [25]. Parameters of the cells and the fitted permeability coefficients were presented in the form of the Mean6Standard Deviation.
Results and Discussion
Figure 2A shows the Sf21 cells adhered to the micro-channel in the initial state at 22uC, and the transient response of a representative cell (indicated by a red box in the left figure) during the osmotic shift from PBS (291 mOsm) to 36PBS (784 mOsm) at22uC was shown in Figure 2B at a 10 second intervals. The measured cell volume changes at four different temperatures and the corresponding fitting processes are comparatively shown in Figure S1. Table 1 summarizes the values of the inactive cell volume (Vb) and the hydraulic conductivity at four different
temperatures. The mean value of the inactive cell volume is 0.518 and the standard error is 0.089, n = 25. The Vb of the Sf21 is
similar to mammalian ovarian tissues (0.5V0) [26,27,28].
The measured cell osmotic responses and the curve-fitting processes using the 2-pmodel after the addition of 1.0 M glycerol at four different temperatures are comparatively shown in Figure S2. Figure 3 presents volume change of a Sf21 cell and osmolarity shift of CPA and PBS in the intracellular solution during the solution from the PBS to PBS solution with 1.0 M glycerol at 25uC. The cell membrane permeability coefficients fitted using both theK-Kand the 2-pmodels for the addition of 1.0, 1.5 and 2.0 M glycerol are listed in tables 2, 3, 4, respectively. Apparently, individual variation of the results of theK-Kand the2-pmodels are quite a few marked-pronounced. In theK-Kmodel, the hydraulic conductivity, the solute permeability coefficient, and the reflection coefficient, are used to characterize the cell membrane. In order to describe the water and solute flux interaction across the cell membrane, the reflection coefficient was introduced [19]. It has
Table 2.The cell membrane permeability coefficients of Sf21 for 1.0 M glycerol.
Temperature (6C) K-K model parameters 2-p model parameters
Lp(10214m/Pa/s) Ps(1028m/s) s Lp(10214m/Pa/s) Ps(1028m/s)
25(n = 9) 0.62060.176 0.61960.314 0.9860.04 0.74860.524 0.64860.284
15(n = 11) 0.53360.356 0.50160.192 0.9160.16 0.65860.551 0.39560.160
5(n = 9) 0.36860.175 0.10160.050 0.9460.14 0.33560.97 0.10760.051
22(n = 7) 0.33460.124 0.04760.017 0.9360.16 0.27460.047 0.03860.010
doi:10.1371/journal.pone.0072836.t002
Table 3.The cell membrane permeability coefficients of Sf21 for 1.5 M glycerol.
Temperature (6C) K-K model parameters 2-p model parameters
Lp(10214m/Pa/s) Ps(1028m/s) s Lp(10214m/Pa/s) Ps(1028m/s)
25(n = 11) 0.42260.275 0.75960328 0.9260.15 0.65460.430 0.68260.298
15(n = 9) 0.42960.126 0.34960.144 0.9960.02 0.42960.131 0.39760.124
5(n = 8) 0.20360.051 0.08160.041 0.9960.01 0.19560.051 0.11760.048
22(n = 11) 0.02560.089 0.04560.034 0.8660.23 0.17360.016 0.04660.032
been pointed out that the K-Kmodel does not account for any membrane moderated transport and possible contributions of water channels. To fully consider the contribution of the water channel, the 2-pmodel was suggested, in which the interaction between water and CPA was neglected and their transport through the cell membrane is regarded to be independent [20]. In this study, all the permeability coefficients fitted using both theK-K
and the 2-pmodels are presented, and the analysis are based on the parameter of2-pmodel.
In previous studies, the effect of the CPA concentration on the hydraulic conductivity has not been fully established [29]. Hempling et al. [30] found that the hydraulic conductivity was sharply reduced by 50% with the concentration of dimethyl sulfoxide (DMSO) increasing from 0.6 M to 1.2 M in megakar-yocytopoietic cells, and there is no further reduction in the hydraulic conductivity with the increase of the DMSO concen-tration. However, McGrathet al.[31] got the conflict conclusion for the mouse oocytes research, where theLpvalue of the mouse
oocytes increased by 70% in the presence of 1.5 M DMSO or 1,2-propanediol. In this study, the Sf21 cell was used as a model cell, and the effects of the temperature and the CPA concentration on its hydraulic conductivity were quantitative investigated.
Figure 4 shows the transport properties of Sf21 cell membrane for different concentration of glycerol, from which it can be seen that theLp value sharply decrease along with the increase of the
CPA concentration at high temperature, while such decrease is comparatively slight at low temperatures. However, thePsvalues
do not apparently changes with the CPA concentration for all the temperatures studied. Figure 5 and 6 show that the dependence of the hydraulic conductivity and the glycerol permeability coefficient on temperature was analyzed by least-square curve-fitting and the dependence was validated by the classic Arrhenius relationship. The ELp, Lpg, EPs and Psg values of the Sf21 were determined
according to the linear regression, and they were listed in Table 5. Apparently, theLpgvalue of Sf21 decreases along with the increase
of the glycerol concentration, while the ELp doesn’t have the
responding decline. Besides, the Psg value increases with the
increase of the glycerol concentration. The dependences of the hydraulic conductivity and the glycerol permeability coefficient of Sf21 cell membrane on temperature and the final glycerol concentration were shown in Figure 7.
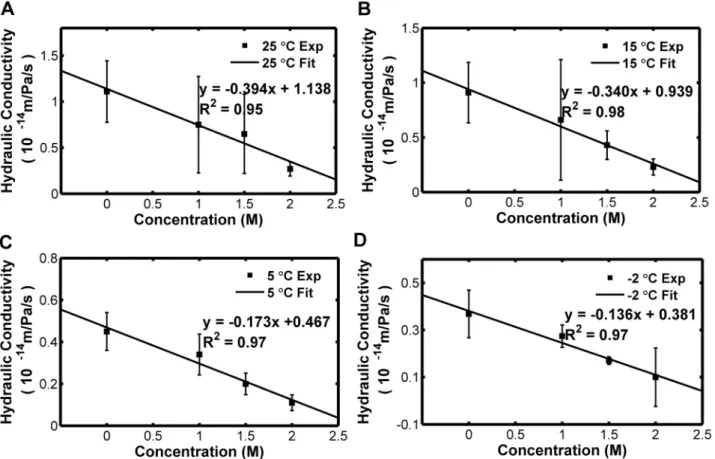
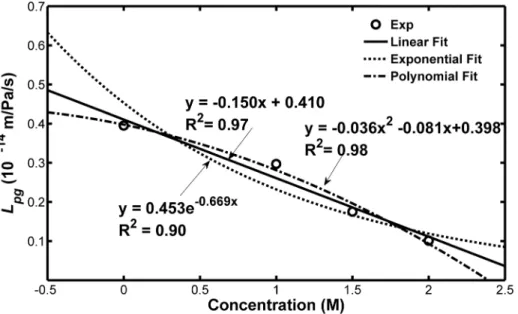
McGrath et al. [32] found that the hydraulic conductivity seemingly reduced exponentially in the presence of increased concentration of CPA based on their data. However, it was found that the hydraulic conductivity has a significantly linear decrease with the increase of the glycerol concentration, as shown in Figure 8. From Figure 9, the reference value of the hydraulic conductivity of Sf21 also has a significantly linear decrease with the increase of the final glycerol concentration. Although the polynomial fitting seems to be even better than the linear, it was
not recommended by this study due to the difficulty in demonstrating the mechanism.
It was assumed that the dependence of theLpgon the molar
concentration of the CPA could be described using the following equation,
LCPA
pg (C)~kCzL0pg ð7Þ
Table 4.The cell membrane permeability coefficients of Sf21 for 2.0 M glycerol.
Temperature (6C) K-K model parameters 2-p model parameters
Lp(10214m/Pa/s) Ps(1028m/s) s Lp(10214m/Pa/s) Ps(1028m/s)
25(n = 9) 0.25860.080 0.81960.195 0.9960.01 0.26960.077 0.76060.123
15(n = 7) 0.23160.113 0.67260.135 0.9860.03 0.22560.074 0.53860.082
5(n = 12) 0.08960.028 0.13260.062 0.9660.03 0.10960.038 0.15860.068
22(n = 10) 0.09760.036 0.09660.016 0.9860.05 0.09860.037 0.09860.016
doi:10.1371/journal.pone.0072836.t004
where the superscriptCPAmeans there is CPA in the solution, and the superscript0means there is no CPA in the solution.Cis the concentration of the CPA. Then eq. (7) is incorporated into eq. (5) to reflect the dependences of the hydraulic conductivity on both the temperature and the CPA molar concentration. Finally, theLp
values of Sf21 at any temperature and the given CPA concentra-tion could be predicted by the following equaconcentra-tion,
LCPAp (T,C)~LCPApg (C):exp ( ELp
R ( 1 T0
{1
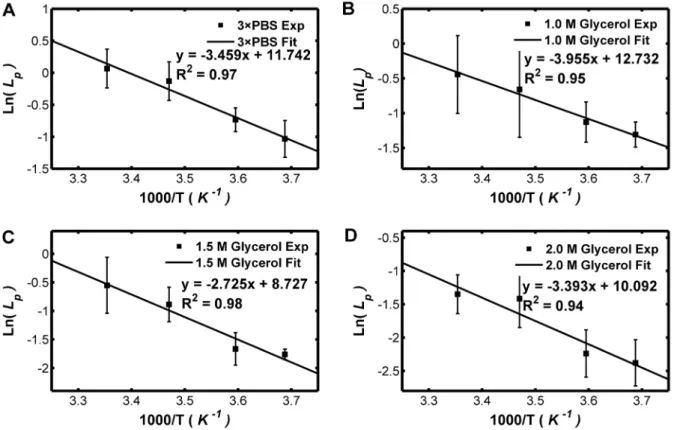
T)) ð8Þ Figure 5. Arrhenius plot of the hydraulic conductivity for solution in the presence of 0, 1.0, 1.5, 2.0 M glycerol.The natural logarithms of the hydraulic conductivity (10214
m/Pa/s) are linearly dependent to the 1000 fold of the reciprocal of the absolute temperature. doi:10.1371/journal.pone.0072836.g005
Figure 6. Arrhenius plot of the hydraulic conductivity for solution in the presence of 1.0, 1.5, 2.0 M glycerol.The natural logarithms of the glycerol permeability coefficient (1028m/s) are linearly dependent to the 1000 fold of the reciprocal of the absolute temperature.
The predictions of Eq. (8) and the experimental data were comparatively shown in figure 10, as can be seen that they agree well with each other. This implies that eq. (8) is applicable for Sf21 cells.
In eq. (8), theLpvalues of Sf21 are well described with the molar
concentration of CPA and the temperature. In aqueous glycerol solution, the solution viscosity steadily climbs up with increasing concentration according to the WLF model [33,34]. Beside, the high molar glycerol concentration indicates the water have a small
Figure 7. The overview of the dependences of the hydraulic conductivity and permeability coefficient of Sf21 cell on temperature and the glycerol concentration.A Dependences of the hydraulic conductivity of Sf21 cell on temperature and the glycerol concentration. The circles, experimental data; the curves, predictions using the Arrhenius formula. B Dependences of the CPA permeability coefficient of Sf21 cell on temperature and the glycerol concentration. The circles, experimental data; the curves, predictions using the Arrhenius formula.
proportion in the solution. Dual effects may indicate that the hydraulic conductivity has a significantly linear decrease with the increase of the final glycerol concentration. While, there are still no definitive conclusions on the relationship between the CPA and the water channels.
Figure S3 shows the glycerol permeability coefficient of Sf21 cell with the concentration of the glycerol at 25, 15, 5 and 22uC, respectively. It seems that the glycerol permeability coefficient increases with the increase of the CPA molar concentration, while no further quantitative relationship is found due to the limited experimental data.
There is a dynamic equilibrium in cell volume due to the water efflux as glycerol transported into the cell and water driven by the chemical potential [35], and then the volume change could been predicted using the cryobiological parameters in the experiment. We implement the new Arrhenius relationship in predicting the transient cell volume suffered the osmotic shifts. Figure S4 shows
the predicted cell volume changes of Sf21 after various osmotic shifts at 25uC using the permeability coefficients measure by this study (from PBS to 1.0, 1.5 and 2.0 M glycerol solutions). While, the researcher hypothesized the transport properties are indepen-dent to the glycerol concentration. This novel Arrhenius relationship induces the relationship of cryobiological properties, and it could be very important to the development of optimal strategies for cell cryopreservation.
Conclusion
The osmotically inactive volume, the hydraulic conductivity and the glycerol permeability coefficient of Sf21 cells were determined experimentally at 25, 15, 5 and22uC. The parameters of both the
K-K model and the 2-p model of Sf21 cells were fitted in the presence of 1.0, 1.5, 2.0 M glycerol at 25, 15, 5 and22uC. We found that Lp sharply decreases with the increase of the CPA
concentration at high temperature, while the reduction is relatively
Table 5.TheELp,Lpg,EPsand Psgof the Sf21 for different osmotic shifts.
Osmotic Shift ELp(kJ/mol) Lpg(10214m/Pa/s) EPs(kJ/mol) Psg(1028m/s)
PBSR36PBS 29.220 0.395 – –
PBSRPBS+1.0 M glycerol 26.727 0.297 70.667 0.056
PBSRPBS+1.5 M glycerol 34.911 0.175 67.013 0.065
PBSRPBS+2.0 M glycerol 27.396 0.101 52.664 0.121
doi:10.1371/journal.pone.0072836.t005
Figure 8. Dependence of the hydraulic conductivity of Sf21 cell membrane on the final glycerol concentration at 25, 15, 5 and
226C, respectively.
less at lower temperatures. TheLpgof Sf21 cells decreases with the
increase of glycerol concentration in the solution, while such trend was not observed for the ELp of Sf21. TheEPsand Psgincrease
slightly with the increase of the glycerol concentration. We proposed that the hydraulic conductivity has a significant linear correlation with the concentration of glycerol for the Sf21 cells and the Lg values correlate well with temperature and the molar
concentration of glycerol. The volume changes were predicted using the cryobiological parameters in the experiment. The concentration dependence of the hydraulic conductivity was incorporated into the classic Arrhenius relationship by replacing the constant reference value of the hydraulic conductivity at the reference temperature with a function that is linearly dependent of the CPA concentration. Further comparison between the
predic-Figure 9. Dependence of the reference value of the hydraulic conductivity (Lpg) of Sf21 cell on the glycerol concentration.The results
indicate that the linear fitting is better than the exponential fitting. doi:10.1371/journal.pone.0072836.g009
Figure 10. Dependences of the hydraulic conductivity on glycerol concentration and temperature predicted using modified Arrhenius relationship.The black boxes represent the experimental data (25, 15, 5 and22uC; 0, 1, 1.5 and 2 M glycerol), and the vertical lines indicate the standard error.
tions of the extended formula with the experimental data indicates that this formula was adequate at least for the Sf21 cells.
Supporting Information
Figure S1 Volume responses of Sf21 cell after osmotic shift from isotonic (291 mOsm) to hypertonic (873 mOsm) solution.A, B, C and D represent the changes of the normalized cell volume at 25, 15, 5 and22uC, respectively. (TIF)
Figure S2 Volume changes of Sf21 cell after osmotic shift from CPA free isotonic solution to solution with 1.0 M glycerol. A, B, C and D represent the changes of normalized cell volume at 25, 15, 5 and22uC, respectively. (TIF)
Figure S3 Dependence of the glycerol permeability coefficient of Sf21 cell on the glycerol concentration at 25, 15, 5 and22uC, respectively.
(TIF)
Figure S4 Predicted cell volume changes of Sf21 after various osmotic shifts at 25uC using the permeability coefficients measure by this study (from PBS to 1.0, 1.5 and 2.0 M glycerol solutions).The dot and dash-dot lines represent the predictions with the hypothesized transport proper-ties being independent of the glycerol concentration.
(TIF)
Acknowledgments
We are very grateful to Prof. Gang Cai for supporting us the Sf21 cell.
Author Contributions
Conceived and designed the experiments: JW GZ. Performed the experiments: JW CY. Analyzed the data: JW GZ JR DG. Contributed reagents/materials/analysis tools: KZ. Wrote the paper: JW GZ. Designed the software used in analysis: JR.
References
1. Vaughn JL, Goodwin RH, Tompkins GJ, McCawley P (1977) The establishment of two cell lines from the insect Spodoptera frugiperda (Lepidoptera; Noctuidae). In Vitro 13: 213–217.
2. Drugmand J-C, Schneider Y-J, Agathos SN (2012) Insect cells as factories for biomanufacturing. Biotechnology Advances 30: 1140–1157.
3. Ikonomou L, Schneider YJ, Agathos SN (2003) Insect cell culture for industrial production of recombinant proteins. Applied Microbiology and Biotechnology 62: 1–20.
4. Sandino E-M, Octavio Rr, Laura P (2005) Principles and Applications of the Insect Cell-Baculovirus Expression Vector System. Cell Culture Technology for Pharmaceutical and Cell-Based Therapies: CRC Press. 627–692.
5. Berger I, Fitzgerald DJ, Richmond TJ (2004) Baculovirus expression system for heterologous multiprotein complexes. Nat Biotech 22: 1583–1587.
6. Metz SW, Pijlman GP (2011) Arbovirus vaccines; opportunities for the baculovirus-insect cell expression system. Journal of Invertebrate Pathology 107, Supplement: S16-S30.
7. Hancock K, Narang S, Pattabhi S, Yushak ML, Khan A, et al. (2008) False positive reactivity of recombinant, diagnostic, glycoproteins produced in High FiveTM
insect cells: Effect of glycosylation. Journal of Immunological Methods 330: 130–136.
8. Go´mez-Sebastia´n S, Pe´rez-Filgueira DM, Go´mez-Casado E, Nun˜ez MC, Sa´nchez-Ramos I, et al. (2008) DIVA diagnostic of Aujeszky’s disease using an insect-derived virus glycoprotein E. Journal of Virological Methods 153: 29–35. 9. Mazur P (1984) Freezing of living cells: mechanisms and implications.
Am J Physiol 247: C125–142.
10. Toner M, Cravalho EG, Stachecki J, Fitzgerald T, Tompkins RG, et al. (1993) Nonequilibrium freezing of one-cell mouse embryos. Membrane integrity and developmental potential. Biophys J 64: 1908–1921.
11. Lovelock JE (1957) The denaturation of lipid-protein complexes as a cause of damage by freezing. Proc R Soc Lond B Biol Sci 147: 427–433.
12. Leibo SP (1980) Water permeability and its activation energy of fertilized and unfertilized mouse ova. J Membr Biol 53: 179–188.
13. Diller KR, Bradley DA (1984) Measurement of the water permeability of single human granulocytes on a microscopic stopped-flow mixing system. J Biomech Eng 106: 384–393.
14. McGrath JJ (1985) A microscope diffusion chamber for the determination of the equilibrium and non-equilibrium osmotic response of individual cells. Journal of Microscopy 139: 249–263.
15. Gao DY, McGrath JJ, Tao J, Benson CT, Critser ES, et al. (1994) Membrane transport properties of mammalian oocytes: a micropipette perfusion technique. Journal of Reproduction and Fertility. 385–392.
16. Chen HH, Purtteman JJ, Heimfeld S, Folch A, Gao D (2007) Development of a microfluidic device for determination of cell osmotic behavior and membrane transport properties. Cryobiology 55: 200–209.
17. Takamatsu H, Komori Y, Zawlodzka S, Fujii M (2004) Quantitative examination of a perfusion microscope for the study of osmotic response of cells. J Biomech Eng 126: 402–409.
18. Yoshimori T, Takamatsu H (2009) 3-D measurement of osmotic dehydration of isolated and adhered PC-3 cells. Cryobiology 58: 52–61.
19. Kedem O, Katchalsky A (1958) Thermodynamic analysis of the permeability of biological membranes to non-electrolytes. Biochim Biophys Acta 27: 229–246. 20. Kleinhans FW (1998) Membrane permeability modeling: Kedem-Katchalsky vs
a two-parameter formalism. Cryobiology 37: 271–289.
21. Gao DY, Benson CT, Liu C, McGrath JJ, Critser ES, et al. (1996) Development of a novel microperfusion chamber for determination of cell membrane transport properties. Biophys J 71: 443–450.
22. Levin RL, Cravalho EG, Huggins CE (1976) Effect of hydration on the water content of human erythrocytes. Biophys J 16: 1411–1426.
23. Hunter JE, Bernard A, Fuller BJ, McGrath JJ, Shaw RW (1992) Measurements of the membrane water permeability (Lp) and its temperature dependence (activation energy) in human fresh and failed-to-fertilize oocytes and mouse oocyte. Cryobiology 29: 240–249.
24. Vijayachandran LS, Viola C, Garzoni F, Trowitzsch S, Bieniossek C, et al. (2011) Robots, pipelines, polyproteins: enabling multiprotein expression in prokaryotic and eukaryotic cells. J Struct Biol 175: 198–208.
25. Zhao G (2010) A universal self-adaptive time-varying function for extracellular concentration during osmotic shift for curve-fitting permeability coefficients of cell membrane. Cryo Letters 31: 279–290.
26. Rubin SC, Sutton GP (1993) Ovarian cancer. London: McGraw-Hill Education. 27. Stevens A Lowe J (1996) Human histology, 2nd edn. The Netherlands: Elsevier
Health Science.
28. Devireddy RV, Li G, Leibo SP (2006) Suprazero cooling conditions significantly influence subzero permeability parameters of mammalian ovarian tissue. Mol Reprod Dev 73: 330–341.
29. Karlsson JOM, Cravalho EG, Toner M (1994) A model of diffusion-limited ice growth inside biological cells during freezing. Journal of Applied Physics 75: 4442–4455.
30. Hempling HG, White S (1984) Permeability of cultured megakaryocytopoietic cells of the rat to dimethyl sulfoxide. Cryobiology 21: 133–143.
31. McGrath JJ (1985) A microscope diffusion chamber for the determination of the equilibrium and non-equilibrium osmotic response of individual cells. J Microsc 139: 249–263.
32. McGrath JJ (1988) Membrane transport properties. American Society of Mechanical Engineers, Bioengineering Division (Publication) BED; Chicago, IL, USA. Publ by American Soc of Mechanical Engineers (ASME). 273–330. 33. He X, Fowler A, Toner M (2006) Water activity and mobility in solutions of
glycerol and small molecular weight sugars: Implication for cryo- and lyopreservation. Journal of Applied Physics 100: 074702–074711.
34. Williams ML, Landel RF, Ferry JD (1955) The Temperature Dependence of Relaxation Mechanisms in Amorphous Polymers and Other Glass-forming Liquids. Journal of the American Chemical Society 77: 3701–3707. 35. Pfaff RT, Agca Y, Liu J, Woods EJ, Peter AT, et al. (2000) Cryobiology of Rat