Attitudes towards mental illness in
the Commonwealth of Dominica
Robert Kohn,
1David Sharma,
2Christopher P. Camilleri,
3and Itzhak Levav
4Little is known about the perception of mental illness in the English-speaking Caribbean. This study was conducted in 1995 to determine the attitudes, knowledge, and help-seeking practices for emotional disorders in the Commonwealth of Dominica. Two groups in Dominica were surveyed: 67 community leaders, consisting of nurses, teachers, and police officers; and 135 community members grouped into five socioeconomic strata that were collapsed to three for the analysis. All the respondents were asked to identify and suggest management of individuals with psychosis, alcoholism, depression, and childhood hyperactivity, as depicted in case vi-gnettes. The person in the psychosis vignette was diagnosed as suffering from mental illness by 84.0% of the leaders and by 71.2% of the community members. However, in each of the three other vignettes, fewer than 30% of the respondents thought that mental illness was pres-ent. The person with alcoholism was viewed as having a serious problem by only slightly more than half of the respondents. Fewer than half of the respondents thought that the individuals with depression or hyperactivity had serious problems. The community leaders did somewhat worse in recognizing mental illness than did the community members. Respondents were most likely to refer a family member with emotional problems to a medical practitioner. In conclu-sion, education about mental health problems is needed in Dominica. Especially disconcerting was the lack of knowledge on mental illness among nurses, teachers, and police officers, that is, professionals directly involved in the pathway to care.
ABSTRACT
Dominica is of the largest of the Windward Islands. It is located in the Eastern Caribbean between the French islands of Guadeloupe and
Marti-nique. Dominica has a population of over 71 000, of whom 16 000 reside in Roseau, the capital. A former British colony, Dominica gained its indepen-dence in 1978. Although only 29 miles long and 16 miles wide, its mountain-ous terrain makes access to the capital difficult for most of the villagers. The country is predominately Roman Cath-olic. Dominica has the only surviving Carib indigenous population, estimated at some 2 000 persons. Although Eng-lish is Dominica’s official language, the majority of the population also speak French Creole. While the island’s econ-omy is based primarily on agriculture, the country is not self-sufficient in food production.
A 1995 poverty assessment sur-vey for Dominica showed that 27% of households live in poverty and are un-able to adequately meet basic needs, including nutritional ones (1). How-ever, undernutrition of young children is extremely low, at a rate of 1.4%. The unemployment rate is estimated to be approximately 9.9%. Although there is no compulsory education, in 1993 91.6% of the population between the ages of 5 and 19 were registered in school. Pri-mary school has been completed by 67.1% of the population. The functional illiteracy rate is estimated to be 10.5%.
A well-developed primary care sys-tem serves each of Dominica’s ten parishes, or administrative divisions.
1 Butler Hospital, Providence, Rhode Island, United
States of America, and Brown University, Depart-ment of Psychiatry and Human Behavior, Provi-dence, Rhode Island, United States of America. Send correspondence to: Robert Kohn, M.D., But-ler Hospital, 345 Blackstone Blvd., Providence, RI 02906, USA. Tel: 401/455-6277; fax: 401/455-6566; e-mail: [email protected]
2 Department of Psychiatry, Princess Margaret
Hos-pital, Dominica, West Indies.
3 Harvard South Shore Department of Psychiatry,
Veterans Administration Medical Center, Brock-ton, Massachusetts, United States of America.
4 Pan American Health Organization, Washington,
Recent legislation to reform the health care delivery system introduced na-tional health insurance in the country. Since 1993, technical collaboration by the Mental Health Program of the Pan American Health Organization and the World Health Organization Collaborative Center in Montreal, Canada, has aided in the development of a network of mental health care ser-vices reaching even the most remote villages.
According to Dominica’s 1995 Men-tal Health Report, the age-adjusted in-cidence of schizophrenia was 0.9% (1). In that same year, there were a total of 2 166 psychiatric outpatient visits. In-patient psychiatric treatment is avail-able in the capital, at the Princess Mar-garet Hospital. Of that hospital’s 652 inpatient psychiatric admissions in 1995, 8.7% were due to alcoholism, 7.6% to cannabis psychosis, and 2% to cocaine abuse. The Mental Health Re-port also concluded that 90% of the pa-tients in the prison psychiatric clinic had a history of drug abuse. The coun-try’s mental health policy is currently being reformulated to address service needs and legal issues.
Little is known about the perception of mental illness in the English-speaking Caribbean. Such information is impor-tant since lay attitudes toward mental disorders and the persons suffering from them influence help-seeking be-havior and compliance with treatment (2). Individuals with a mental disorder at least initially share the same beliefs about mental illness as do the other members of their society. These atti-tudes help determine when persons will seek help and how they will later be reintegrated into the community (3, 4).
The aim of this study was to deter-mine the knowledge, perceptions, and attitudes towards mental illness and help-seeking behavior in reference to psychiatric care.
MATERIALS AND METHODS Study population
This study was conducted in April 1995 on a nonrandomized sample from
the various communities around the island. Two groups were selected for study.
The first group was comprised of community leaders: nurses, teachers, and members of the police force. Be-cause of their positions and visibility, these “gatekeepers” have frequent contact with individuals with emo-tional problems. Eighty questionnaires were sent to the chief education officer for distribution to teachers from vari-ous schools around the island, and 42.5% of those questionnaires were re-turned. The office of the chief public health nurse distributed 140 question-naires to nurses at the health centers around the island, but only 10.7% were returned. Of the 110 question-naires distributed from the office of the commissioner of police to police at stations around the island, slightly over 16% were returned. In total, 67 out of 330 questionnaires were turned, yielding a modest 20.3% re-sponse rate.
The second study group consisted of individuals from different communi-ties around the island, who were inter-viewed face to face by a social worker. The in-person interviews lasted be-tween 10 and 15 minutes. After strati-fying by socioeconomic status, 30 sub-jects were randomly selected by the social worker, with the assistance of health visitors, from the records of community health centers in each of the country’s seven health regions. The various communities in the re-gions were selected by the Dominica-based team to represent both urban and rural areas and to be geographi-cally representative of the Common-wealth’s population; selection of the communities was not random.
Information on socioeconomic status (SES) is collected routinely by each community health center during a home assessment done by a health vis-itor. Determination of SES was based on quality of housing, ownership of property, occupational status, income, availability of running water and toilet facilities in the home, and ownership of such amenities as an automobile and television. SES was divided into five groups based on Hollingshead and
Redlich’s scale.5 The two lowest and
two highest SES groups were col-lapsed, leaving three groupings.
The overall response rate for the 210 community members was 64% due to the unavailability of respondents. The 135 community-member respondents included 67 individuals from social classes 1 and 2 (low), 47 individuals from social class 3 (middle), and 21 in-dividuals from social classes 4 and 5 (high).
Questionnaire
The questionnaire consisted of two parts. The first section included demo-graphic information, as well as items about the emotional health of the in-formant and the inin-formant’s family. The second part contained four case vignettes followed by questions tap-ping the informant’s knowledge, atti-tudes, and perceptions relating to mental health. The vignettes were those of Star,6with adaptations (5).
The first vignette described an indi-vidual who had psychotic symptoms: “Now I want to describe a man called John, who is very suspicious. He doesn’t trust anybody, and he’s sure that every-body is against him. Sometimes he thinks that people he sees on the street are talking about him or following him around. He has beaten up men who didn’t even know him. The other night, he began to curse his wife terrible, then he hit her and threatened to kill her be-cause, he said, she was working against him, just like everyone else.”
The second vignette was of an indi-vidual with alcoholism: “Carlos never seems to be able to hold a job very long, because he drinks too much. Whenever he has money in his pocket, he goes on a spree. He stays out all hours drinking, and never seems to care what happens to his wife and
chil-5 Hollingshead AB. Four factor index of
socioeco-nomic status [mimeo]. New Haven, Connecticut; 1975.
6 Star SA. The public’s ideas about mental illness
dren. Sometimes he feels very bad about the way he treats his family. He begs his wife to forgive him and promises to stop drinking but always goes off again.”
The third vignette depicted a case of depression: “Maria is a 50-year-old woman who lives with her husband. The neighbors remember her as some-one who was happy and took good care of her husband and family. Her three sons have already completed their studies and are married. Though living in different places, they visit on occasion. Maria appears different over the last several years in that all she does is stay home. She speaks slowly and cries, eats and sleeps a little, and appears to be very unhappy.”
The last case was of a child with hy-peractivity: “Paul is a 12-year-old boy who is in school, but is in a class 3 years behind the other children of his age. He is very active and unable to settle in class. This has been going on since he was a few years old. Recently, he is coming very restless in class and is be-coming involved in fights with other children in the class and at home.”
Analyses
The data were initially analyzed com-paring the responses from the commu-nity members and the commucommu-nity lead-ers, with subsequent analyses limited to the community-members sample. In the community-members sample, gender, social class, age of respondents, and the respondent’s history of an emotional disorder were examined as predictors for differential attitudes toward mental illness. Categorical data were examined using the chi-square statistic, and con-tinuous data were examined with analysis of variance (ANOVA) and t tests. The analysis was not corrected for multiple comparisons.
RESULTS
Demographics and health
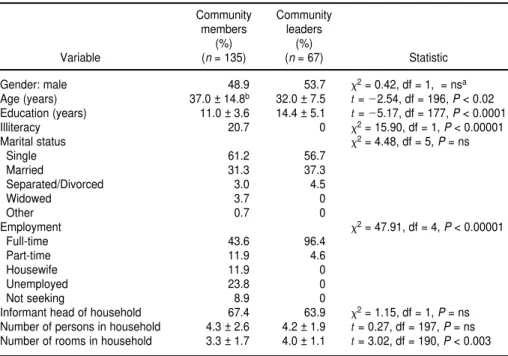
Table 1 provides information on the demographic characteristics of the
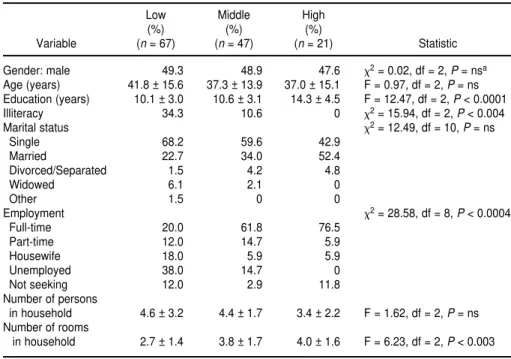
community members and of the com-munity leaders. Table 2 provides addi-tional details on the community-mem-ber group, by socioeconomic status.
In response to other questionnaire items, the leader group viewed them-selves to be in better physical health than the community-members group did, by a significant margin. Only 21.6% of the community-member sample thought their health was very good, in comparison to 50.7% of the leader sample (x2= 30.34, degrees of
freedom (df) = 3, P< 0.00001). How-ever, within the community-members group there was a gradient in per-ceived health, with 42.9% of the high-SES group viewing themselves to be in very good health, versus 19.6% for the middle group, and 16.4% for the low group (x2 = 20.03, df = 6, P <
0.003).
In terms of having consulted some-one for an emotional or nervous prob-lem, there was no significant statistical difference between the leaders group and the
community-members group; the rate was 9.2% among the leaders and 17.9% among the community members. Similarly, there was no statistically significant difference among the three SES groups of the community members, with rates of 22.4% for the low-SES group, 15.2% for the middle-SES group, and 9.5% for the high-SES group, respectively.
With respect to having taken medica-tions for an emotional or nervous prob-lem, there was a statistically significant difference between the leader group and the community-member group, with rates of 4.6% and 17.2%, respectively (x2 = 6.07, df = 1,
P < 0.02). On this questionnaire item, there were no statistically significant differences among the three SES groups of the community members, with rates of 22.4% for the low-SES group, 15.2% for the middle-SES group, and 4.3% for the high-SES group, respectively.
The respondents were asked how often they thought that people with an emotional or nervous problem were violent. Both the community-leader
TABLE 1. Demographic characteristics of the community-member and community-leader groups, Dominica, 1995
Community Community
members leaders
(%) (%)
Variable (n = 135) (n = 67) Statistic
Gender: male 48.9 53.7 x2= 0.42, df = 1, = nsa
Age (years) 37.0 ± 14.8b 32.0 ± 7.5 t=
22.54, df = 196, P < 0.02 Education (years) 11.0 ± 3.6 14.4 ± 5.1 t= 25.17, df = 177, P < 0.0001
Illiteracy 20.7 0 x2= 15.90, df = 1, P < 0.00001
Marital status x2= 4.48, df = 5, P = ns
Single 61.2 56.7
Married 31.3 37.3
Separated/Divorced 3.0 4.5
Widowed 3.7 0
Other 0.7 0
Employment x2= 47.91, df = 4, P < 0.00001
Full-time 43.6 96.4
Part-time 11.9 4.6
Housewife 11.9 0
Unemployed 23.8 0
Not seeking 8.9 0
Informant head of household 67.4 63.9 x2= 1.15, df = 1, P = ns Number of persons in household 4.3 ± 2.6 4.2 ± 1.9 t= 0.27, df = 197, P = ns Number of rooms in household 3.3 ± 1.7 4.0 ± 1.1 t= 3.02, df = 190, P < 0.003
ans = not significant.
group and the community-member group perceived a potential for violence (leaders versus community-member group: violent all of the time, 3.0% and 3.8%; some of the time, 83.6% and 79.7%; rarely, 11.9% and 14.3%; never, 1.5% and 2.3%).
Both the community-leader group and the community-member group would send a family member who had an emotional problem first to a doctor
or hospital, and only later to a psychia-trist or other mental health provider (Table 3).
Vignette 1: psychosis
Virtually all the questionnaire respon-dents—98.0% overall—thought that something was wrong with the in-dividual in the psychosis vignette
(Table 4). The leader group, however, identified the vignette as describing an individual with a mental illness at a sig-nificantly higher rate than did the com-munity-member respondents, 84.0% vs. 71.2% (x2= 8.85, df = 3, P< 0.03). Both
groups found the problem presented in the vignette to be serious regardless of whether or not it was viewed as a men-tal illness. Of the community-member respondents, 6.2% thought this individ-ual could overcome his problem on his own, while 3.8% thought he could not overcome it at all. Only 1.5% of the leader group thought the individual in the vignette could not overcome his problem at all. Over 30% of the both the respondent groups thought the person in the vignette had a mental illness and felt he should be in a mental hospital. The most common types of treatment suggested by the community-member respondents, regardless of whether they believed this to be a psychiatric disorder, were: mental hospitalization, 29.0%; psychiatrist, 22.1%; social worker, 10.7%; and psychologist, 7.6%. Among the leader group the most common in-terventions recommended were: psy-chiatrist, 33.8%; mental hospital, 27.7%; psychologist, 26.2%; and social worker, 4.6%. Table 4 provides a summary of the responses.
No differences based on the commu-nity respondents’ gender were found in knowledge, attitudes, and percep-tion in regards to psychosis. In addi-tion, the respondents’ history of emo-tional or nervous disorder did not significantly affect the results. Among the community-member respondents, older individuals were more likely to believe there was nothing wrong with the person described in the vignette (t= 2.21, df = 131, P< 0.03). In addi-tion, those in the low-SES group more often felt that the person described needed to be in a mental hospital, 44.4% versus 26.8% for the middle-SES group and 16.7% for the high-SES group (x2= 14.32, df = 6, P< 0.03).
Vignette 2: alcoholism
The community leaders more often thought that something was wrong
TABLE 2. Demographic characteristics of the community-member group by socioeconomic status, Dominica, 1995
Low Middle High
(%) (%) (%)
Variable (n = 67) (n = 47) (n = 21) Statistic
Gender: male 49.3 48.9 47.6 x2= 0.02, df = 2, P = nsa
Age (years) 41.8 ± 15.6 37.3 ± 13.9 37.0 ± 15.1 F = 0.97, df = 2, P = ns Education (years) 10.1 ± 3.0 10.6 ± 3.1 14.3 ± 4.5 F = 12.47, df = 2, P < 0.0001
Illiteracy 34.3 10.6 0 x2= 15.94, df = 2, P < 0.004
Marital status x2= 12.49, df = 10, P = ns
Single 68.2 59.6 42.9
Married 22.7 34.0 52.4
Divorced/Separated 1.5 4.2 4.8
Widowed 6.1 2.1 0
Other 1.5 0 0
Employment x2= 28.58, df = 8, P < 0.0004
Full-time 20.0 61.8 76.5
Part-time 12.0 14.7 5.9
Housewife 18.0 5.9 5.9
Unemployed 38.0 14.7 0
Not seeking 12.0 2.9 11.8
Number of persons
in household 4.6 ± 3.2 4.4 ± 1.7 3.4 ± 2.2 F = 1.62, df = 2, P = ns Number of rooms
in household 2.7 ± 1.4 3.8 ± 1.7 4.0 ± 1.6 F = 6.23, df = 2, P < 0.003
ans = not significant.
bMean ± standard deviation is used for age, education, and persons and rooms in household.
TABLE 3. Preferences for referral of a family member with emotional problems, Dominica, 1995
First choice Second choice
Community Community Community Community
members leaders members leaders
Referral (%) (%) (%) (%)
Doctor 33.6 34.9 18.5 15.7
Hospital 15.7 17.5 19.4 15.7
Psychiatrist 5.2 0.0 9.7 39.2
Nurse 13.4 0.0 3.2 0.0
Clinic 12.7 7.9 1.6 0.0
Clergy 6.0 11.1 7.3 2.0
Counselora 5.2 11.1 9.7 7.8
Other 7.5 17.5 20.1 13.7
Don’t know 0.7 0.0 10.5 5.9
with the individual in the alcoholism vignette than did the community-mem-ber respondents (x2= 7.67, df = 2, P<
0.03). Of the community-members group, 8.1% thought everything was all right with this person, and 5.9% of them said they did not know. Only 14.8% of the leaders and 21.1% of the commu-nity-members group viewed this vi-gnette as representing a mentally ill in-dividual. Slightly more than half of the respondents from both of the groups thought the problem was serious.
Of the community-member respon-dents, 13.2% believed that the per-son described in the alcoholism vi-gnette could overcome his problems on his own, in contrast to 4.9% of the lead-ers (x2= 5.92, df = 2, P< 0.05). The most
common types of assistance suggested by the leaders, regardless of whether the vignette was perceived to be a
men-tal disorder, were: psychologist, 35.0%; psychiatrist, 18.3%; family physician, 11.7%; and family or friends, 5.0%. The community-member group endorsed family and friends as the most appro-priate source for assistance, 27.5%, fol-lowed by psychologist, 12.5%; psychia-trist, 10.0%; and family physician, 8.3%. Very few respondents specifi-cally recommended an alcohol rehabil-itation or detoxification program.
Among the community-member re-spondents, no statistically significant differences were found based on their gender or SES. However, the younger the individuals were, the more likely they were to believe that something was wrong with the person described in the vignette (t= 2.72, df = 132, P< 0.007). Similarly, individuals who had a history of an emotional or nervous disorder were more likely to believe
something was wrong with the person described (x2= 4.83, df = 1, P< 0.03).
Vignette 3: depression
As in the two previous vignettes, al-most all the respondents in both the leader and community-member groups felt that something was wrong with the individual in the depression vignette. The community-member respondents were more likely to view this person as mentally ill, 25.6%, compared to the leader group, 18.6% (x2= 26.23, df = 3, P< 0.00001).
Nevertheless, with the depression vignette, many respondents were un-certain as to the nature of the problem. Although not shown in table 4, this was true for 22.6% of the persons in the community-member group and for 54.2% of the leaders. The community respondents were also more likely to view this person’s problem as being serious (x2= 7.70, df = 3, P< 0.05). Most
individuals, whether they thought the vignette represented someone with a mental illness or not, deemed that help was needed. Among those who did not view it as a mental illness, the leaders more often than the community mem-bers thought that help was required (x2 = 9.88, df = 4, P< 0.05).
Approxi-mately 8.1% of the community-member respondents felt that the woman de-picted could overcome the problem on her own. The most common sources of help suggested by the leaders, whether or not this was considered a mental dis-order, were: psychologist, 34.5%; psy-chiatrist, 15.5%; social worker, 13.8%; family or friends, 13.8%; and family doctor, 8.1%. Among the community members, the suggestions were: family or friends, 44.7%; psychiatrist, 12.2%; social worker, 8.1%; family doctor, 8.1%; and psychologist, 3.3%.
Among the community-member re-spondents, females were more likely than males to state that the individual described in the depression vignette re-quired help, 90.8% vs. 78.0% (x2= 3.91,
df = 1, P< 0.05). Younger individuals were more likely to believe something was wrong with the individual de-scribed (t= 2.51, df = 132, P< 0.012). No
TABLE 4. Percent responding yes to selected questions for each vignette, Dominica, 1995
Community members Community leaders
Question asked (%) (%)
Is something wrong with this individual?
Vignette 1: Psychosis 97.0 100
Vignette 2: Alcoholism 85.9 98.4
Vignette 3: Depression 91.1 98.4
Vignette 4: Hyperactivity 90.3 87.1
Is this mental illness?
Vignette 1: Psychosis 71.2 84.0
Vignette 2: Alcoholism 21.1 14.8
Vignette 3: Depression 25.6 18.6
Vignette 4: Hyperactivity 28.9 18.3
Is this a serious problem?
Vignette 1: Psychosis 70.2 80.6
Vignette 2: Alcoholism 55.7 59.0
Vignette 3: Depression 49.6 30.6
Vignette 4: Hyperactivity 44.4 40.0
If yes mental illness, is help needed?
Vignette 1: Psychosis 91.4 98.4
Vignette 2: Alcoholism 92.3 96.6
Vignette 3: Depression 89.1 97.3
Vignette 4: Hyperactivity 83.3 96.6
If no mental illness, is help needed?
Vignette 1: Psychosis 89.2 98.5
Vignette 2: Alcoholism 82.6 95.1
Vignette 3: Depression 84.7 91.8
Vignette 4: Hyperactivity 84.0 90.2
If yes mental illness, need mental hospital?
Vignette 1: Psychosis 33.6 32.1
Vignette 2: Alcoholism 13.7 3.8
Vignette 3: Depression 11.7 12.1
differences were found in the responses based on SES or between those with a history of an emotional disorder or not.
Vignette 4: hyperactivity
With the boy in the hyperactivity vignette, 87.1% of the leader group and 90.3% of the community-member group thought something was wrong; however, 6.7% of the community-mem-ber respondents said that nothing was wrong (x2= 11.02, df = 2, P< 0.005). The
community respondents were more likely to see the behavior described as being consistent with mental illness (x2= 11.47, df = 3, P< 0.01). Fewer than
half of the respondents viewed the problem described as being serious, but most agreed that help was needed. Among those who viewed the problem as a mental disorder, the community-member respondents were more likely than the leaders to view mental hospi-talization as a reasonable alternative (x2= 5.24, df = 1, P< 0.03). The type of
help that each group viewed as appro-priate varied. Regardless of whether they viewed the problem as psychiatric, the leaders endorsed: social worker, 26.2%; psychologist, 24.6%; psychiatrist, 18.0%; family doctor, 11.5%; family and friends, 8.2%; and mental hospitaliza-tion, 3.3%. The community-member group endorsed: family and friends, 33.3%; mental hospitalization, 15.9%; psychologist, 10.3%; psychiatrist, 8.7%; social worker, 8.7%; and family doctor, 4.8%.
Once again, among community members younger individuals viewed the problem presented as being more serious (t= 22.02, df = 124, P< 0.05).
Those who were from the low SES were more likely to view the person described in the vignette as having mental illness, 38.8% vs. 27.7% for the middle SES and none among the high SES (x2= 16.79, df = 6, P< 0.01). In
ad-dition, about half of the respondents
from the low SES thought psychiatric hospitalization was appropriate in this situation: low SES, 52.9%; middle SES, 8.0%; and high SES, 0% (x2 = 23.39,
df = 6, P< 0.001). None of the persons who had a history of emotional disor-der endorsed the use of a mental hos-pital for this vignette (x2= 5.25, df = 1,
P< 0.02).
DISCUSSION
The persons surveyed in Dominica narrowly defined a behavioral or emo-tional problem as mental illness. This was true for community members in general, as well as community leaders. Other than psychosis, the behavioral disturbances were generally not con-sidered to be either mental illness or a serious problem. However, nearly everyone thought that each of the vi-gnettes described someone who had something wrong and needed help.
In terms of such sociodemographic variables as gender, age, SES, or his-tory of an emotional disorder, there were few differences among the com-munity members in their responses to the vignettes. Consistently, however, younger individuals among the com-munity respondents were more likely to believe something was wrong with the persons described in the vignettes. Interestingly, most respondents felt that if they or their family needed as-sistance with an emotional disorder, they would seek out the medical profession.
The community leaders appeared to have more difficulty than the commu-nity members did in identifying the vi-gnettes as mental illness and even, at times, as serious problems. The low re-sponse rate among leaders could be in-terpreted as a negative attitude toward mental illness or a lack of acquaintance with surveys that require the respon-dent to return a questionnaire. This lack of mental-illness awareness among
the community leaders was of particu-lar concern, as nurses, teachers, and the police can play an integral role with individuals seeking care for their mental health problems. This limited awareness among Dominican gate-keepers may also reflect deficient knowledge of the efficacy of treat-ments for mental disorders (6). An al-ternative explanation might be the leaders’ unwillingness to stigmatize individuals by labeling them as men-tally ill.
The generalizability of this study is limited by the low response rate in both groups and the small sample size. Selection factors may also have biased the results in both groups. This issue is most notable in the leader group, where teachers made up just over half of the respondents.
The results of this study suggest that better public awareness of mental ill-ness is needed among those directly linked to the pathways to care. The 1995 mental health survey suggested that serious mental illness was as much of a public health issue in Do-minica as in other countries (1) and therefore cannot be ignored. This point is highlighted by a more recent survey among outpatients in the rural clinic at Marigot, in northeastern Domi-nica, which found a 28% prevalence of alcoholism-related symptoms, based on the CAGE questionnaire.7
Contin-ued mental health promotion activities are needed in Dominica, including training gatekeepers to recognize men-tal illnesses and to properly direct per-sons seeking care.
Acknowledgments. This study was funded by the Pan American Health Organization.
7 Sharma D, Nasiiro R. Prevalence of alcoholism in
1. Pan American Health Organization. Health conditions in the Americas, 1998 edition, vol-ume II. Washington, D.C.: PAHO; 1998. (Sci-entific publication 569).
2. Angermeyer MC, Matschinger H. Public atti-tude towards psychiatric treatment. Acta Psy-chiatr Scand 1996;94(5):326–336.
3. Phillips D. Rejection: a possible consequence of seeking help for mental disorders. Am So-ciol Rev 1963;28:961–972.
4. Scheff T. The labeling theory of mental illness. Am Sociol Rev 1974;39:444–452.
5. Levav I, Kohn R, Flaherty JA, Lerner Y, Aisen-berg E. Mental health attitudes and practices of Soviet immigrants. Isr J Psychiatry Relat Sci 1990;27(3):131–144.
6. Jorm AF, Korten AE, Jacomb PA, Christensen H, Rodgers B, Pollitt P. “Mental health liter-acy”: a survey of the public’s ability to recog-nise mental disorders and their beliefs about
the effectiveness of treatment. Med J Aust 1997;166(4):182–186.
Manuscript received on 8 August 1999. Revised version accepted for publication on 21 December 1999.
REFERENCES
Poco se sabe acerca de la percepción que tienen los habitantes del Caribe de habla in-glesa en torno a las enfermedades mentales. El presente estudio se llevó a cabo en 1995 con el fin de determinar las actitudes, los conocimientos y los comportamientos relacionados con la búsqueda de atención por trastornos mentales en la Mancomu-nidad de Dominica. Se encuestaron dos grupos en la isla: 67 líderes comunitarios, entre los cuales se encontraban personal de enfermería, maestros y policías; y 135 miembros de la comunidad divididos en cinco estratos socioeconómicos que se co-lapsaron a tres para el análisis. Todos los encuestados tuvieron que identificar y su-gerir maneras de tratar a las personas con psicosis, alcoholismo, depresión e hi-peractividad infantil, tal como se describe en los relatos de casos ilustrativos. Al protagonista del relato sobre la psicosis le diagnosticaron enfermedad mental 84,0% de los líderes y 72% de los miembros de la comunidad. No obstante, en cada uno de los otros tres relatos, menos de 30% de los encuestados identificaron un trastorno mental. Solamente poco más de la mitad de los encuestados eran de la creencia de que la persona alcohólica estuviera afectada por un problema serio. Menos de la mitad opinaban que las personas con depresión o hiperactividad tuvieran un problema grave. Los líderes de la comunidad mostraron menor capacidad para reconocer un trastorno mental que los otros miembros de la comunidad. La tendencia más acen-tuada entre los encuestados fue la de remitir a un médico a miembros de la familia con trastornos mentales. En resumen, en Dominica hacen falta programas de edu-cación sobre la enfermedad mental. La falta de conocimientos sobre las enfermedades de la mente por parte del personal de enfermería, los maestros y los policías produjo especial desconcierto, ya que estos profesionales tienen participación directa en las vías de acceso a la atención.
RESUMEN