INTRODUCTION
Open-pore sintered soda lime glasses are important in iltration and puriication systems, being used due to their stability and chemical resistance [1]. In order to apply these materials effectively, knowledge of the quantity of open-pores as well as the permeability is very important because of their inluence on the iltration eficiency. In this light, an alternative, non-invasive and non-destructive method,
which is based on the photoacoustic (PA) technique, is proposed in order to investigate the open-pore morphology. Despite the fact that the PA technique was irst discovered more than one century ago (A. G. Bell in 1880 [2]), its use in research has only received considerable attention since the 70’s [2-7]. In the PA technique the sample is placed inside a closed cell (PA cell) that contains air and a sensitive microphone. The sample is then illuminated with chopped polychromatic or monochromatic light. The incident light M. T. Yasuda1, W. L. B. Melo2
1Departamento de Engenharia de Materiais - DEMa Universidade Federal de S. Carlos - UFSCar
Rod. Washington Luiz, km 235, C.P. 676, S. Carlos, SP 13.565-905
2Embrapa Instrumentação Agropecuária
Rua XV de Novembro 1452, C.P. 741, S. Carlos, SP 13.560-970
[email protected], wlbmelo.cnpdia.embrapa.br
Abstract
The Photoacoustic (PA) technique was used to investigate the structural properties (e.g. open porosity and permeability) of open-pore sintered glasses. This work demonstrates that the photoacoustic signal of open-pore sintered glasses, which are produced with different grain sizes and several degrees of open porosity, is sensitive to the morphology of the open-pore samples. The results obtained by the PA technique were related to results obtained by the Pressure Decay technique, and an excellent correlation was obtained. This demonstrates that PA technique, which is non-intrusive and non-destructive, is promising for application in analysis of porous ceramic structures, even if the sample is semi-transparent.
Keywords: open porous, permeability, glasses, photoacoustic.
Resumo
A técnica fotoacústica (PA) foi usada para investigar as propriedades estruturais (isto é, porosidade aberta e permeabilidade) de iltros vítreos. Este trabalho demonstra que o sinal fotoacústico de iltros vítreos, os quais foram produzidos com diferentes tamanhos de grãos e vários graus de porosidade, é sensível à morfologia destes. Os resultados
obtidos pela técnica PA foram relacionados com resultados de permeabilidade obtidos pela técnica de decaimento de
pressão, resultando em uma ótima correlação. Isto demonstra que a técnica fotoacústica, a qual é não intrusiva e não
destrutiva, é promissora para análise de estruturas cerâmicas porosas, mesmo sendo essas semi-transparentes.
Palavras-chave: porosidade aberta, permeabilidade, vidros, fotoacústica.
A new method to determine open porosity and permeability constants of
open-pore sintered glasses by photoacoustic technique
(Um novo método para determinar a porosidade e as constantes de permeabilidade
may be scattered, transmitted and/or absorbed depending on the optic absorption coeficient and structure of the sample. The modulated light absorbed by the sample excites energy levels that subsequently decay. The most common decay process is non-radioactive decay (heating), and thus the periodic optical excitation of the sample results in a periodic low of heat from the sample to the surrounding air [2, 8]. This propagation results in a periodic pressure oscillation within the PA cell, which is detected by the microphone as an acoustic signal (PA signal). The transmitted light can also be used to indirectly produce the PA signal, as will be demonstrated in this paper.
The PA signal depends on the thermal and optical properties of the sample and consequently also depends on the structure of the sample. In the 1970’s theoretical models were formulated which considered these contributions [2, 8, 9-11]. In the 1980’s, studies with powdered and porous samples were performed, leading to the formulation of a theoretical model by Monchalin. [12]
EXPERIMENTAL PROCEDURE
Open-Pore Sintered Glass. Open-pore sintered soda lime glasses were prepared using the simplest manufacturing process in order to achieve open-pore vitreous bodies with reasonably deined pore-size ranges. This is called the Filler Principle and was introduced by Sibers [14]. In this process a non-sinterable and a water-soluble phase (NaCl) were added to the glass grains at percentages of 0, 10, 20, 30 and 40 wt.%. The glass grains were obtained from a transparent bottle obtained commercially and had the following chemical composition (in mol %): SiO2 (72.8 %), Na2O (13.2 %), CaO (11.2 %), Al2O3 (2.13 %), MgO (0.16 %), K2O (0.09 %), Fe2O3 (0.039 %) and FeO (0.039 %) [15]. Two different
Figure 1: Photograph of some samples, with different open porosity, used in this work: 15.04% of open porosity (produced with grains between 106 µm and 212 µm); 28.69 % of open porosity (produced with grains between 212 µm and 500 µm); 40.74% of open porosity (produced with grains between 106 µm and 212 µm); 51.64% of open porosity (produced with grains between 212 µm and 500 µm).
[Figura 1: Fotograia de algumas amostras, com diferentes
porosidades abertas, utilizadas no trabalho: 15,04% de porosidade
aberta (produzidas com grãos entre 106 µm e 212 µm); 28,69% de
porosidade aberta (produzidas com grãos entre 212 µm e 500 µm);
40,74% de porosidade aberta (produzidas com grãos entre 106 µm
e 212 µm); 51,64% de porosidade aberta (produzidas com grãos
entre 212 µm e 500 µm).]
Figure 2: Schematic representation of the PA spectrometer.
waves through the sample, while the other contributions (surrounding conditions, light power, absorption coeficient, etc.) are minimized.
RESULTS AND DISCUSSION
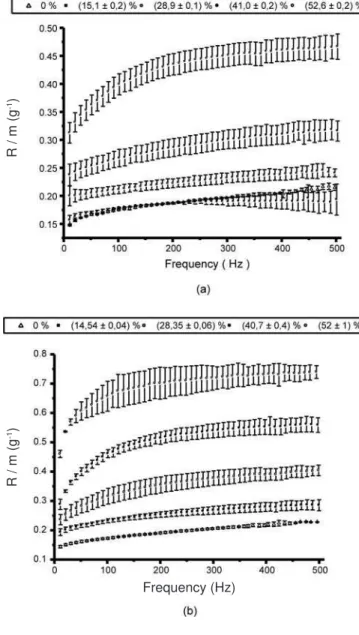
Fig. 3 shows the behavior of R/m, for both sample groups, as a function of the frequency modulation of the incident light-beam. It should be noted that R/m increases with the open pore percentage. This behavior is similar for both groups of samples with different grain sized intervals; glass grain sizes were used, one with grains between 106
µm and 212 µm and other between 212 µm and 500 µm. The samples were sintered at a temperature of 700°C for 60 min. After being washed, the thickness of the samples was standardized at 4 mm. The samples were approximately 35 mm in diameter. Fig. 1 shows some samples manufactured by the method described above [10].
PA Instrumentation. The experiment was realized in a photoacoustic spectrometer assembled in the Photothermal Laboratory of the Embrapa Instrumentation Research Center. This spectrometer consists of a halogen lamp (Oriel, 250 W), a chopper (Oriel, 75152), a microphone (B&K-model 4192) with preampliier and conditioning ampliier (B&K-Nexus), an ampliier Lock-in (Stanford-SR530) and data acquisition software. A schematic diagram of the PA spectrometer is presented in Fig. 2.
The PA cell used was constructed with a special sample holder. Two identical aluminum holders were made and one was covered with a thin layer of black ink (black holder - BH) and the other remained with its natural color (white holder – WH).
Methodology. The proposed method used in this paper consists of obtaining the different PA signals related to the open pore structure of the samples using the two different holders, as a function of modulation frequency of the light beam. The PA signal of the sample present in the WH depends on the light absorption and scattering on its surface, and also on the light relected by the WH that can be reabsorbed by the sample. The PA signal of sample on the BH depends predominantly on the light transmitted through the sample and absorbed by the support. This absorption by the support increases the PA signal in relation to that obtained using the WH. Also a difference in the behavior of the signal, as the modulation frequency is changed, is observed.
In the interface between the sample and the sample holder a thin layer of air is present due to the roughness and open pores of the sample surface. When the BH is used, acoustic waves are generated in this layer of air by the thermal waves that originate from the BH. These thermal-acoustic waves spread through the sample generating the expansion of the interstitial air and contribute to the increase of the PA signal. These effects mainly depend on the sample structure and its permeability.
Information concerning the structure of the open pores can be obtained by relating the amplitude of the PA signals that are obtained for samples using the different supports. Equation A describes this relationship:
(A)
where R is the normalized amplitude of the PA signal and
m is the mass of sample. R/m represents the contribution of the open pore structure to the propagation of the thermo-acoustic
Figure 3: Behavior of R/m for samples with grain sizes between: (a) 106 µm and 212 µm, (b) 212 µm and 500 µm. The captions
above the igures present the open porosity of the sample groups.
[Figura 3: Comportamento de R/m para amostras com tamanho
de grãos entre (a) 106 µm e 212 µm, (b) 212 µm e 500 µm. As
legendas acima dos gráicos apresentam as porosidades aberta
dos grupos de amostras.]
Frequency (Hz)
R / m (g
-1)
R / m (g
however, the group formed by bigger grains evolves more uniformly.
Note that R/m increases with the frequency and tends to a constant value. At low frequencies the thermal diffusion length of air is greater than at high frequencies and this can be used to explain the behavior of R/m in Fig. 3. When the thermal diffusion length of air is greater than the air gap in the layer between the sample and BH, the contribution to the expansion of interstitial air is due to thermal waves. However, when the thermal diffusion length of air is smaller than the air gap, the acoustic waves are generated and propagate through the sample and by interstitial air.
The PA technique is a nondestructive technique. Thus, in order to provide a comparative study the same samples were also analyzed by the Pressure Decay technique. The experimental apparatus used was that constructed by Vasques
et al. [16] Thus, using the Forchheimer equation (equation B) for a compressible luid (air) [16, 17], the Darcian (k1) and non-Darcian (k2) permeability constants were obtained according to:
(B)
where Pe and Pex are the entrance and exit pressures from sample, respectively; P0 is the atmospheric pressure; Ls is the sample thickness; υ is the luid viscosity (1,83 x 10⁻⁵ Pa.s); ν
s is the luid
velocity; and rf is the luid density (1,079 Kg/m3) [16].
The pressure-decay curves as a function of luid velocity of the samples (itted using equation B) are presented in Fig. 4. The curves demonstrate that the increase in the pressure decay is greater as the luid velocity increases and the open porosity of the sample is reduced. In igure 4a the curve of the sample with 15.04 % open porosity is not presented because it did not present a luid lux through the sample. This suggests that these samples do not have interconnected pores linking the surface, as commented previously.
The Darcian permeability constant (k1) is related to the viscous attrition between the luid and the porous structure and the molecules of the luid. The non-Darcian permeability constant (k2) is related to the effect of luid
turbulence through the open structure on the pressure decay [17, 18]. The viscous attrition effect predominates at low luid velocities and contributes to the evolution of R/m in a similar manner for both sample groups. In other words,
R/m is not suficiently sensible to distinguish this effect for
different sample groups, as shown in igure 5a.
The effect of the luid turbulence on the pressure decay depends predominantly on high luid velocities and also depends on the waviness of the interconnected open pores [17, 18]. In this case, R/m distinguishes the different sample groups and igure 5b demonstrates this fact. This difference is possibly due to periodical expansion of the interstitial air which occurs in the sound velocity region, so that it is possible
to compare the difference between the samples manufactured with different grain sizes in relation to the possible structural differences formed by interconnected open pores.
The ittings presented in Fig. 5 were obtained using an exponential function that relates R/m to the permeability constants. The equation used for itting is:
(C)
where C0 is a constant related to the impermeable sample,
Cj(i) and α(i)
j are parameters that depend on the sample
Figure 4: Pressure decay as a function of luid velocity for samples
produced with grain sizes between: a) 106 µm and 212 µm, (b) 212
µm and 500 µm.
[Figura 4: Decaimento de pressão em função da velocidade do luído para amostras produzidas com tamanhos de grãos entre: a)
106 µm e 212 µm, (b) 212 µm e 500 µm.]
Samples produced with particles diameter between 106 µm and 212 µm Samples produced with particles diameter between 212 µm and 500 µm
Pressure decay (Pa/m)
Pressure decay (Pa/m)
Fluid velocity (m/s)
the case where j=2 (Non-Darcian case) the parameter C2(1)
(723,37 g-1) is about ive times greater than the parameter
C2(2) (137,40 g-1) and the parameter α 2
(1) (2,80 m-1) is different
to α2(2) (4,86 m-1). As shown graphically and demonstrated
here, the methodology is more sensible to non- Darcian phenomena. Even so, it still is possible to verify the inluence of phenomena related to Darcian theory.
CONCLUSIONS
A novel application of the PA technique was used to investigate open-pore sintered glasses with high thickness (i.e. 4 mm) and diffuse light beam transmission. This resulted in a new methodology for the determination of open-pore characteristics and permeability properties. The PA technique was able to provide information about the different structures of the sample groups and to relate them to the permeability constants. The results were not only demonstrated to be sensitive to the open porosity but also to the interaction between the open pore structure and the expansion of the interstitial air. New studies are necessary to complement this methodology and improve the agreement between the mechanisms involving the photoacoustic effect and the porous structure.
ACKNOWLEDGEMENTS
The authors are grateful to FAPESP, CNPq and Embrapa Research Center for their support of this work. The authors also thank Dr. Odílio B. G. Assis, Dr. Murilo D. M. Innocentini and Mr. Arturo R. F. Pardo for help in the discussion of results.
REFERENCES
[1] O. B. G. Assis, L. C. Claro, J. Non-Crystalline Sol. 247 (1999) 237.
[2] A. Rosencwaig, Photoacoustic and Photoacoustics Spectroscopy, John Wiley & Sons, New York (1980) p. 309.
[3] A. Rosencwaig, Science 181, 4100 (1973) 657. [4] T. H. Maugh, Science 188, 4183 (1975) 38.
[5] J. F. McCleland, R. N. Kniseley, Appl. Opt. 15, 11 (1976) 2658.
[6] A. C. Tam, Rev. Modern Phys. 58, 2 (1986) 381. [7] W. L. B. Melo, R. M. Faria. Appl. Phys. Lett. 67, 26 (1995) 3892.
[8] A. Rosencwaig, A. J. Gersho, Appl. Phys. 47, 1 (1976) 64.
[9] F. A. Mcdonald, G. C. Wetsel Jr., J. Appl. Phys. 49, 4 (1978) 2313.
[10] M. T. Yasuda, MSc Thesis, Interunidades Eng. Ciência dos Materiais, USP, S. Carlos, SP (2003) p. 130.
[11] G. Rousset, F. Lepoutre, L. Bertrand, J. Appl. Phys. 54, 5 (1983) 2383.
structure and kj is the permeability constant, being j=1 or 2 for Darcian and Non-Darcian constants and i=1 or 2 for sample groups manufactured with smaller and larger grains, respectively.
The results obtained from the curve ittings demonstrate that for j = 1 (Darcian case) the parameter C1(1) (312,29x10³
g-1) is approximately two times greater than the parameter
C1(2) (158,94x10³ g-1). While the parameter α 1
(1) (2,32 m-2)
is practically identical to the parameter α1(2) (2,45 m-2). For
Figure 5: Correlation between R/m and the permeability constants: (a) correlation with the Darcian permeability constant (k1), (b) correlation with the non-Darcian permeability constant (k2).
[Figura 5: Correlação entre R/m e as constantes de permeabilidade: (a) correlação com a constante de permeabilidade Darciana (k1), (b)
correlação com a constante de permeabilidade não-Darciana (k2).] Samples produced with particles diameter between 106 µm and 212 µm Samples produced with particles diameter between 212 µm and 500 µm Samples produced with particles diameter between 106 µm and 212 µm Samples produced with particles diameter between 212 µm and 500 µm
R / m (g
-1)
R / m (g
-1)
Darcian permeability k1 (m2)
[12] J. P. Monchalin, L. Bertrand, G. Rousset, J. Appl. Phys. 56, 1 (1984) 190.
[13] S. J. McGovern, B. S. H. Royce, J. B. Benzier, J. Appl. Phys. 57, 5 (1985) 1710.
[14] F. B. Siebers, N. Greulich, W. Kiefer, Glastechnische Berichte 62, 2 (1989) 63.
[15] D. C. Vieira, Thesis, Interunidades Eng. Ciência dos
Materiais, USP, S. Carlos, SP (2002) p. 146.
[16] R. A. Vasques, M. D. M. Innocentini, O. B. G. Assis, Rev. Fís. Apl. Instrum. 14, 3 (1999) 1.
[17] M. D. M. Innocentini, V. R. Salvini, J. R. Coury, V. C. Pandolfelli, Am. Ceram. Soc. Bull. 78, 9 (1999) 78.