Genes in African Americans
Nicholette D. Palmer1,2,3*, Caitrin W. McDonough2,3,5, Pamela J. Hicks1,2,3, Bong H. Roh1,2,3, Maria R. Wing2,3,7, S. Sandy An1,2,3, Jessica M. Hester2,3,7, Jessica N. Cooke2,3,5, Meredith A. Bostrom1,2,3, Megan E. Rudock1,2, Matthew E. Talbert2,3,5, Joshua P. Lewis2,3,7, DIAGRAM Consortium", MAGIC Investigators",
Assiamira Ferrara11, Lingyi Lu8, Julie T. Ziegler8, Michele M. Sale9, Jasmin Divers8, Daniel Shriner10, Adebowale Adeyemo10, Charles N. Rotimi10, Maggie C. Y. Ng2,3,6, Carl D. Langefeld8, Barry I. Freedman4, Donald W. Bowden1,2,3,4
1Department of Biochemistry, Wake Forest University School of Medicine, Winston-Salem, North Carolina, United States of America,2Center Genomics and Personalized Medicine Research, Wake Forest University School of Medicine, Winston-Salem, North Carolina, United States of America,3Center for Diabetes Research, Wake Forest University School of Medicine, Winston-Salem, North Carolina, United States of America,4Department of Internal Medicine, Wake Forest University School of Medicine, Winston-Salem, North Carolina, United States of America,5Program in Molecular Medicine and Translational Science, Wake Forest University School of Medicine, Winston-Salem, North Carolina, United States of America,6Department of Pediatrics, Wake Forest University School of Medicine, Winston-Salem, North Carolina, United States of America,7Program in Molecular Genetics and Genomics, Wake Forest University School of Medicine, Winston-Salem, North Carolina, United States of America, 8Department of Biostatistical Sciences, Wake Forest University School of Medicine, Winston-Salem, North Carolina, United States of America,9Center for Public Health Genomics, University of Virginia School of Medicine, Charlottesville, Virginia, United States of America,10Center for Research on Genomics and Global Health, National Human Genome Center, Howard University, Bethesda, Maryland, United States of America,11Division of Research, Kaiser Permanente, Oakland, California, United States of America
Abstract
African Americans are disproportionately affected by type 2 diabetes (T2DM) yet few studies have examined T2DM using genome-wide association approaches in this ethnicity. The aim of this study was to identify genes associated with T2DM in the African American population. We performed a Genome Wide Association Study (GWAS) using the Affymetrix 6.0 array in 965 African-American cases with T2DM and end-stage renal disease (T2DM-ESRD) and 1029 population-based controls. The most significant SNPs (n= 550 independent loci) were genotyped in a replication cohort and 122 SNPs (n = 98 independent loci) were
further tested through genotyping three additional validation cohorts followed by meta-analysis in all five cohorts totaling 3,132 cases and 3,317 controls. Twelve SNPs had evidence of association in the GWAS (P,0.0071), were directionally consistent
in the Replication cohort and were associated with T2DM in subjects without nephropathy (P,0.05). Meta-analysis in all cases
and controls revealed a single SNP reaching genome-wide significance (P,2.561028). SNP rs7560163 (P= 7.061029, OR (95% CI) = 0.75 (0.67–0.84)) is located intergenically betweenRND3andRBM43. Four additional loci (rs7542900, rs4659485, rs2722769
and rs7107217) were associated with T2DM (P,0.05) and reached more nominal levels of significance (P,2.561025) in the overall analysis and may represent novel loci that contribute to T2DM. We have identified novel T2DM-susceptibility variants in the African-American population. Notably, T2DM risk was associated with the major allele and implies an interesting genetic architecture in this population. These results suggest that multiple loci underlie T2DM susceptibility in the African-American population and that these loci are distinct from those identified in other ethnic populations.
Citation:Palmer ND, McDonough CW, Hicks PJ, Roh BH, Wing MR, et al. (2012) A Genome-Wide Association Search for Type 2 Diabetes Genes in African Americans. PLoS ONE 7(1): e29202. doi:10.1371/journal.pone.0029202
Editor:Florian Kronenberg, Innsbruck Medical University, Austria
ReceivedAugust 31, 2011;AcceptedNovember 22, 2011;PublishedJanuary 4, 2012
This is an open-access article, free of all copyright, and may be freely reproduced, distributed, transmitted, modified, built upon, or otherwise used by anyone for any lawful purpose. The work is made available under the Creative Commons CC0 public domain dedication.
Funding:Genotyping services were provided by the Center for Inherited Disease Research (CIDR). CIDR is fully funded through a federal contract from the National Institutes of Health to The Johns Hopkins University, contract number HHSC268200782096C. This work was supported by NIH grants K99 DK081350 (NDP), R01 DK066358 (DWB), R01 DK053591 (DWB), R01 HL56266 (BIF), R01 DK070941 (BIF) and in part by the General Clinical Research Center of the Wake Forest University School of Medicine grant M01 RR07122. The funders had no role in study design, data collection and analysis, decision to publish, or preparation of the manuscript.
Competing Interests:One or more of the authors that belong to the MAGIC Investigators group and the DIAGRAM Consortium are employed by a commercial company (Gen-Info Ltd., Zagreb, Croatia; Medical Products Agency, Uppsala, Sweden; deCODE Genetics; GlaxoSmithKline; Genome Quebec Innovation Centre, Montreal, Canada); details of these commercial affiliations can be found at the end of this paper. This does not alter the authors’ adherence to all the PLoS ONE policies on sharing data and materials. There are no patents, products in development or marketed products to declare.
* E-mail: nallred@wfubmc.edu
"Membership of the DIAGRAM Consortium and MAGIC Investigators are provided in the Acknowledgments.
Introduction
African Americans have a disproportionately high risk for developing type 2 diabetes (T2DM) with an estimated prevalence twice that observed for their European-American counterparts [1].
European-derived populations [2,3,4]. Until recently, comparable studies have been difficult to perform in African Americans due to the greater complexity of their African-derived genome compound-ed by recent admixture of European-derivcompound-ed genes. With the development of high density SNP arrays that give reasonable coverage of the African-American genome and methods to account for admixture in this population, it has become possible to perform informative GWAS in the African-American population. The aim of this study was to identify loci that contribute to T2DM by GWAS and replication in multiple African-American samples.
Results
Clinical characteristics of the study samples
The clinical characteristics of the study samples used in the GWAS, Replication and Validation phases are shown inTable 1. The GWAS and Replication populations were similar. In both groups, the age at enrollment for the T2DM-ESRD subjects was older than for the control groups. However, the mean age at enrollment for the control groups in the GWAS and Replication phases was older than the mean age of T2DM diagnosis in the T2DM-ESRD and T2DM subjects. Notably, the use of population-based controls has not precluded the identification of bona fide associations in other efforts (e.g., [2]). All of the case groups with T2DM (T2DM-ESRD and T2DM) had a higher proportion of females; possibly reflecting the increased prevalence of T2DM among African-American women [5], participation bias and/or survival. On average, all of the groups were overweight or obese at the time of enrollment. Among case subjects, those with T2DM-ESRD had the lowest average body mass index (BMI; 29.7 kg/m2, Table 1), and the T2DM subjects without nephropathy (T2DM) had the highest average BMI (33.5 kg/m2,Table 1).
GWAS
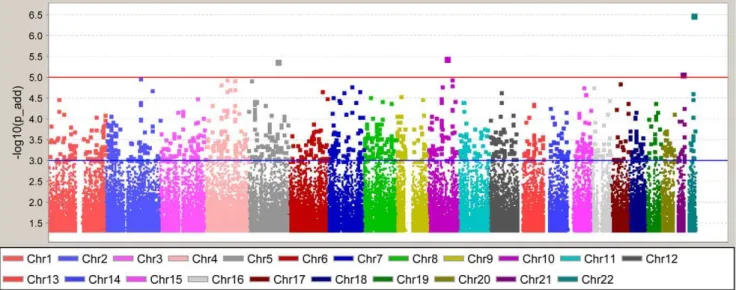
After the application of SNP and sample quality control metrics, 832,357 directly-genotyped, autosomal SNPs were analyzed in 965 American T2DM-ESRD case subjects and 1,029 African-American controls lacking T2DM and ESRD. Given the modest increase of the inflation factor with inclusion of related individuals (1.04 versus 1.06) cryptic first degree relatives were retained in the analysis. A summary of the association results is shown in Figure 1 and Figure S1. The top hit was rs5750250 located on chromosome 22 in theMYH9(non-muscle myosin heavy chain 9)
gene (P-value = 3.061027,Figure 1). This gene has been previously
associated with non-diabetic and diabetic forms of ESRD [6,7,8,9]. In total, there were 126 SNPs withP-values,1.061024(Figure 1). In addition, we also evaluated previously identified T2DM index variants and their corresponding CEU LD blocks for association with T2DM in the African-American population (Table S1). Among the 37 T2DM index variants [3,10,11,12,13,14,15,16,17,18, 19,20,21,22,23,24,25,26,27] identified to date from candidate gene studies, large scale association studies and GWAS, 35 were directly-genotyped or imputed. Among these, 20 SNPs showed consistency with the Caucasian-defined risk allele, although most were non-significant. Only rs11634397 and rs7903146 were nominally associated (P= 0.016 and 4.9E-05, respectively) although the direction of effect was inconsistent for rs11634397 with previous studies (OR = 0.86 with respect to the Caucasian risk allele G). Notably, additional signals of association were observed in CEU LD blocks containing the index SNP. After correction for multiple comparisons, only SNP rs4506565 inTCF7L2remained significant (Bonferroni-corrected P = 0.027; n = 18 SNPs (10 effective tests) contained in the CEU LD block and genotyped in the African-American GWAS). The flow of the study through the GWAS, Replication and Validation phases is outlined inTable 2.
Replication and GWAS+Replication Analysis of
T2DM-ESRD cases and controls lacking both T2DM and T2DM-ESRD
In an effort to replicate the GWAS results, the most significant 712 SNPs (n = 550 independent loci) were successfully genotyped in an additional sample of 709 African-American T2DM-ESRD cases and 690 African-American controls lacking both T2DM and ESRD (Table 2). In this replication analysis, 70 of the 712 SNPs (9.8%) showed nominal evidence of replication: aP-value,0.05 under an additive genetic model with association in the same direction. Al-though no SNP reached genome-wide significance (P-value# 2.561028),P-values ranged from 7.661024 to 6.561027(GWAS + Replication). The top hit from the GWAS, rs5750250, did not reach nominal significance in the replication cohort (P-value = 0.054).
Validation of T2DM loci
A total of 122 SNPs were genotyped in three independent cohorts comprising a total of 1,458 African-American T2DM cases and 1,598 controls lacking both T2DM and ESRD (Table 2). These included 56 of the 70 SNPs with evidence of
Table 1.Clinical Characteristics of Study Samples.
GWAS Replication Validation
T2DM Case-Control IRAS IRASFS
T2DM-ESRD Control T2DM-ESRD Control T2DM Control T2DM Control T2DM Control
n 965 1029 709 690 1246 927 115 164 97 507
Female (%) 61.2% 57.3% 55.7% 51.3% 64.0% 58.0% 53.9% 61.0% 70.1% 58.0%
Age at Enrollment (years) 61.6610.5 49.0611.9 60.2610.4 48.5612.8 57.2611.7 46.6613.1 56.868.0 54.568.4 53.9611.2 40.8613.5 Age at T2DM diagnosis
(years)
41.6612.4 _ 39.4612.5 _ 46.1612.6 51.1610.7 _ 51.2611.9 _
Age at ESRD diagnosis (years)
58.0610.9 _ 56.7610.9 _ _ _ _ _ _ _
T2DM to ESRD duration (years)
16.2610.9 _ 20.4610.5 _ _ _ _ _ _ _
BMI (kg/m2) 29.7
67.0 30.067.0 29.866.9 29.467.6 33.567.6 30.067.7 32.166.0 29.365.8 34.166.8 29.266.5 Values are presented as trait mean and standard deviation.
doi:10.1371/journal.pone.0029202.t001
Type 2 Diabetes GWAS in African Americans
replication and 66 SNPs with more nominal evidence of significance in the combined analysis (Table S2). These samples allowed differentiation between association with T2DM or T2DM-ESRD while increasing power of detection for suspected T2DM loci through meta-analysis. Meta-analysis of the five putative T2DM SNPs in Validation samples, revealed association signals with
P-values ranging from 0.011–1.861026(Table S3, Table 3). The
most significant SNP was rs7560163 (P= 1.861026, odds ratio
(OR) (95% confidence interval (95%CI) = 0.74 (0.63–0.87)) located intergenically betweenRND3(Ras homolog gene family, member E) andRBM43(RNA binding motif protein 43).
Meta-analysis of all African-American study samples
The association results of all 122 SNPs successfully genotyped in all five cohorts (GWAS, Replication, T2DM, IRAS and IRASFS) were used in a meta-analysis to compute an overall test of association (Table 3). This analysis combined results from cases
(T2DM-ESRD and T2DM;n= 3,132) and controls (lacking both T2DM and ESRD;n= 3,317) for a sample size of 6,449 individuals. As a result of this analysis, one SNP reached genome-wide significance (P-value#2.561028;Table 3 and Figure S2). SNP
rs7560163 (P= 7.061029
, OR (95% CI) = 0.75 (0.67–0.84)) is located intergenically between RND3 and RBM43. This SNP was tested for association with T2DM,in silico, by the Diabetes Genetics Replication and Meta-analysis (DIAGRAM) Consort-ium [3] however failed quality control filters and was not in-cluded in analysis likely due to being monomorphic as seen in a representative Caucasian population from the HapMap project (Table S4).
Quantitative Trait Analysis
Exploration of putative T2DM variants with quantitative glycemic traits in a subset of African-American samples (n= 671 from the IRAS and IRASFS control samples,Table S5) revealed
Table 2.Study Design.
Stage
SNPs
(Independent Loci) Cases Control Admixture Adjustment
GWAS 832,357 T2DM-ESRD Cases (n = 965) Population-based Controls (n = 1029) Principal Component 1 (PC1)
Replication 712
(550)
T2DM-ESRD Cases (n = 709) Population-based Controls (n = 690) FRAPPE (70 AIMs) GWAS+Replication 712
(550)
T2DM-ESRD Cases (n = 1,674) Population-based Controls (n = 1,719)
Validation 122
(98)
T2DM Cases (n = 1,246) Controls (n = 927) FRAPPE (76 AIMs) 122
(98)
IRAS T2DM Cases (n = 115) IRAS Controls (n = 164) FRAPPE (70 AIMs) 122
(98)
IRASFS T2DM Cases (n = 97) IRASFS Controls (n = 507) FRAPPE (70 AIMs)
Validation Meta-analysis 122 (98)
T2DM Cases (n = 1,458) Controls (n = 1,598) Overall Meta-analysis
(All 5 cohorts)
122 (98)
T2DM Cases (n = 3,132) Controls (n = 3,317)
doi:10.1371/journal.pone.0029202.t002
Figure 1. Genome-Wide Association Study Results.Results are adjusted for admixture using PC1 as a covariate in the analysis.P-values are shown under the additive model. The blue line at -log10(P-value) = 3 represents an additiveP-value = 0.001 and the red line at -log10(P-value) = 5 represents aP-value = 1.061025.
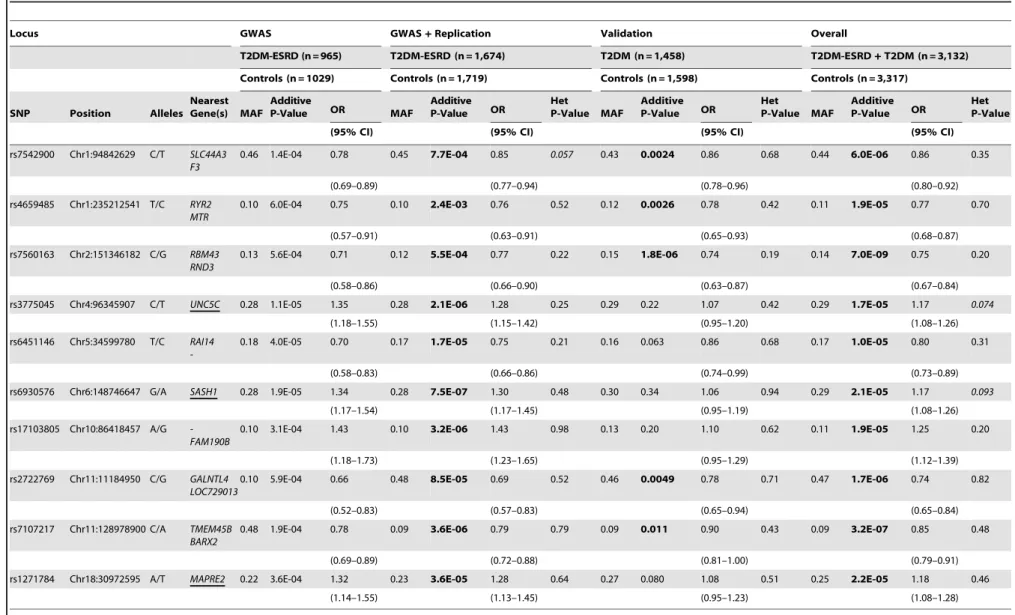
Table 3.GWAS+Replication, Validation and OverallP-values for susceptibility loci identified from the Overall meta-analysis (P,2.561025).
Locus GWAS GWAS+Replication Validation Overall
T2DM-ESRD (n = 965) T2DM-ESRD (n = 1,674) T2DM (n = 1,458) T2DM-ESRD+T2DM (n = 3,132)
Controls (n = 1029) Controls (n = 1,719) Controls (n = 1,598) Controls (n = 3,317)
SNP Position Alleles Nearest Gene(s) MAF
Additive
P-Value OR MAF
Additive P-Value OR
Het
P-Value MAF
Additive P-Value OR
Het
P-Value MAF
Additive P-Value OR
Het P-Value
(95% CI) (95% CI) (95% CI) (95% CI)
rs7542900 Chr1:94842629 C/T SLC44A3 F3
0.46 1.4E-04 0.78 0.45 7.7E-04 0.85 0.057 0.43 0.0024 0.86 0.68 0.44 6.0E-06 0.86 0.35
(0.69–0.89) (0.77–0.94) (0.78–0.96) (0.80–0.92)
rs4659485 Chr1:235212541 T/C RYR2 MTR
0.10 6.0E-04 0.75 0.10 2.4E-03 0.76 0.52 0.12 0.0026 0.78 0.42 0.11 1.9E-05 0.77 0.70
(0.57–0.91) (0.63–0.91) (0.65–0.93) (0.68–0.87)
rs7560163 Chr2:151346182 C/G RBM43 RND3
0.13 5.6E-04 0.71 0.12 5.5E-04 0.77 0.22 0.15 1.8E-06 0.74 0.19 0.14 7.0E-09 0.75 0.20
(0.58–0.86) (0.66–0.90) (0.63–0.87) (0.67–0.84)
rs3775045 Chr4:96345907 C/T UNC5C 0.28 1.1E-05 1.35 0.28 2.1E-06 1.28 0.25 0.29 0.22 1.07 0.42 0.29 1.7E-05 1.17 0.074
(1.18–1.55) (1.15–1.42) (0.95–1.20) (1.08–1.26)
rs6451146 Chr5:34599780 T/C RAI14
-0.18 4.0E-05 0.70 0.17 1.7E-05 0.75 0.21 0.16 0.063 0.86 0.68 0.17 1.0E-05 0.80 0.31
(0.58–0.83) (0.66–0.86) (0.74–0.99) (0.73–0.89)
rs6930576 Chr6:148746647 G/A SASH1 0.28 1.9E-05 1.34 0.28 7.5E-07 1.30 0.48 0.30 0.34 1.06 0.94 0.29 2.1E-05 1.17 0.093
(1.17–1.54) (1.17–1.45) (0.95–1.19) (1.08–1.26)
rs17103805 Chr10:86418457 A/G -FAM190B
0.10 3.1E-04 1.43 0.10 3.2E-06 1.43 0.98 0.13 0.20 1.10 0.62 0.11 1.9E-05 1.25 0.20
(1.18–1.73) (1.23–1.65) (0.95–1.29) (1.12–1.39)
rs2722769 Chr11:11184950 C/G GALNTL4 LOC729013
0.10 5.9E-04 0.66 0.48 8.5E-05 0.69 0.52 0.46 0.0049 0.78 0.71 0.47 1.7E-06 0.74 0.82
(0.52–0.83) (0.57–0.83) (0.65–0.94) (0.65–0.84)
rs7107217 Chr11:128978900 C/A TMEM45B BARX2
0.48 1.9E-04 0.78 0.09 3.6E-06 0.79 0.79 0.09 0.011 0.90 0.43 0.09 3.2E-07 0.85 0.48
(0.69–0.89) (0.72–0.88) (0.81–1.00) (0.79–0.91)
rs1271784 Chr18:30972595 A/T MAPRE2 0.22 3.6E-04 1.32 0.23 3.6E-05 1.28 0.64 0.27 0.080 1.08 0.51 0.25 2.2E-05 1.18 0.46
(1.14–1.55) (1.13–1.45) (0.95–1.23) (1.08–1.28)
SNPs are ordered by chromosome and position (NCBI Build 36.1, hg18) with the major/minor alleles (positive strand) and corresponding gene (underlined) or nearest annotated genes (+/2500 kb). For each phase of the study, GWAS+Replication, Validation and Overall (GWAS+Replication+T2DM+IRAS+IRASFS) analyses, the minor allele frequency (MAF) in controls, additiveP-value and odds ratio (OR) with associated 95% confidence interval (CI) with
respect to the minor allele is listed. doi:10.1371/journal.pone.0029202.t003
Type
2
Diabetes
GWAS
in
African
Americans
PLoS
ONE
|
www.plos
one.org
4
January
2012
|
Volume
7
|
Issue
1
|
limited insight into the biological mechanism associated with T2DM risk. In addition, the five putative African-American T2DM susceptibility loci were tested for association with quantitative measures of glucose homeostasis in the European Caucasian population, in silico, by the Meta-Analyses of Glucose and Insulin-related traits Consortium (MAGIC; [16]). These results did not provide further insight into the probable role these variants may have in disease susceptibility (Table S6). The most significantly associated SNP in African Americans, rs7560163, failed quality controls filters and was not included in analysis likely due to being monomorphic as seen in a representative Caucasian population from the HapMap project (Table S4).
Exploration of eQTLs for T2DM loci
Evaluation of three of the five putative African-American T2DM susceptibility loci for association with altered expression levels of neighboring genes revealed no strong evidence of association. However, SNP rs7542900 trended toward association with CNN3 (b= 0.20+/20.12, P= 0.095). Lack of association could be due to the small sample size (n = 90), ethnic differences (African vs. African American) or lack of identification of the causal variant. SNPs rs4659485 and rs2722769 were not evaluated as they are monomorphic in the YRI population.
Discussion
We performed a high-density genome-wide association study to investigate the genetic determinants of T2DM in the African-American population. Meta-analysis of five study cohorts revealed a single SNP, rs7560163, nearRND3that contributes to T2DM in the African-American population. It is noteworthy that this locus and more nominally associated loci are distinct from those implicated in previous GWAS of T2DM in primarily European-derived populations. These results are consistent with our prior observations [28,29] that ‘‘European’’ genes appear to make only modest contributions to inter-individual risk of T2DM in the African-American population.
Although the associations observed reside intergenically, several neighboring genes could be implicated and have characteristics relevant to the pathophysiology of T2DM. The nearest annotated gene to SNP rs7560163, the only SNP identified to reach stringent levels of genome-wide significance in the Overall analysis (P= 7.061029
, OR = 0.75 (0.67–0.84); Table 3), is RND3. This gene encodes the Rho family GTPase 3 which is ubiquitously expressed and has been implicated as a regulator of actin cytoskeleton organization in response to extracellular growth factors [30,31]. Additional SNPs that reached nominal significance in the Validation samples but failed to reach stringent criteria for genome-wide significance in the Overall analysis included SNP rs7542900 located upstream of coagulation factor III precursor (F3). Higher expression levels of F3 have been measured in monocytes from patients with T2DM [32] although this association could be related to unmeasured vascular complications [33,34]. In addition, SNP rs4659485 is located intergenically between the cardiac muscle ryanodine receptor (RYR2) and 5-methyltetrahydrofolate-homocysteine (MTR) genes however, a biological relationship with T2DM is not clearly evident. SNP rs2722769 resides,64 kb upstream of UDP-N-acetyl-alpha-D-galactosamine polypeptide (GALNTL4).GALNTL4is a member of the large subfamily of glycosyltransferases and although little is known about its biological function, GALNTL2 has been implicated in cholesterol metabolism in a large GWAS meta-analysis [35]. Among other top hits, rs7107217 is located downstream of BarH-like homeobox 2 (BARX2), a transcription factor expressed in smooth and skeletal muscle and involved in muscle differentiation [36,37,38].
Exploration of putative T2DM variants with quantitative glycemic traits in a subset of the samples (n= 671, Table S5) revealed limited insight into the biological mechanism associated with T2DM risk. Notably among the SNPs and traits examined, only SNP rs7107217 was nominally associated with fasting insulin (P= 0.011). Exploration of these variants in European Caucasian populations represented by the DIAGRAM Consortium [3] and MAGIC [16] revealed only nominal evidence of association with T2DM (rs7107217 P=0.086, located intergenically between
BARX2andNFRKB;Table S4) and did not provide further insight into the probable role of these variants in disease susceptibility through examination of quantitative measures of glucose homeo-stasis (Table S6), respectively.
To put these findings into context, the association ofTCF7L2
with T2DM has been widely replicated across multiple ethnicities (reviewed in [39] including prior analysis of African-American samples included in this study [28,40]). SNP rs7903146 has been the most strongly associated variant within this locus with one of the largest allelic odds ratio (OR) for a common variant, i.e. OR ,1.35 [3]. Although rs7903146 is not typed on the Affymetrix 6.0 array and given that the genomic interval is not tagged well (max r2= 0.45), only nominal evidence of association was observed in our African-American GWAS (P= 0.0015, rs4506565;Table S1). Direct genotyping of rs7903146 in the GWAS + Replication (n = 1,674 T2DM-ESRD cases and 1,719 controls lacking both T2DM and ESRD) resulted in the most strongly associated signal observed (P= 2.4661028) with an odds ratio (OR = 1.33, 95% CI = 1.19–1.48). This odds ratio is in the range of other signals which were observed (Table 3).
A notable observation common to all putative T2DM loci (Table 3) is the association of ‘‘protection’’, i.e. and odds ratio less than 1.0, with the minor allele. Comparison with data from the International HapMap Consortium [41] confirms that the major allele in all instances is more common in the representative African samples (YRI) from Ibadan, Nigeria. This could suggest that selection for diabetogenic traits is occurring and that the more common, African-derived allele is deleterious in a more western-ized environment. This is consistent with a trend we observed in prior tests of ‘‘European’’ T2DM associated variants in African Americans (20).
Since obesity is known to be a significant risk factor for the development of T2DM we explored the potential influence using a surrogate measure of adiposity, body mass index (BMI). As seen in Table 1, BMI differs significantly in the validation cohorts (P,0.0001). Given this significant difference, association analyses were repeated with inclusion of BMI as a covariate in the analysis. Adjustment for BMI did not substantially affect the strength of the associations observed. For example, the most significant hit from the validation analysis, rs7560163, was significantly associated with T2DM in the Validation cohorts (n= 1,149 T2DM cases and 919 controls with BMI data; P= 3.5961026) and remained
meta-analyses in European-derived populations, power calculations (Tables S8 and S9) show that this study has greater than 80% statistical power to detect effects for common variants (MAF = 0.20) consistent with published effect sizes (OR = 1.28) for T2DM (e.g. transcription factor 7-like 2 (TCF7L2)and potassium voltage-gated channel, KQT-like subfamily, member 1 (KCNQ1) with ORs 1.3– 1.4; reviewed by [4]) and more modest power (,70%) to detect effects for less common variants (MAF = 0.10). The power to detect and replicate moderate level contributions to T2DM susceptibility should increase with meta-analysis of this GWAS data and other GWAS currently being conducted in African-American popula-tions. In addition this study reports results from only directly genotyped SNPs. Effective imputation of additional SNPs would undoubtedly improve coverage of the African-American genome. While recent imputation methods development [42] show encour-aging progress, rigorous empirical testing continues. A potential bias of the current study design may be that the GWAS was conducted in an African-American population of individuals with type 2 diabetes with nephropathy however; there is no specific reason why this African-American population should differ substantially from African Americans with T2DM without ESRD. For example,
TCF7L2is strongly associated in our studies of African-American T2DM-ESRD subjects [28,40]. In addition it should be noted that although every precaution was taken to account for population structure, as with any GWAS or candidate gene study, there may be residual population substructure. The major strength of this study is the genotyping and replication in four additional populations, thus providing support for the evidence of association observed. In addition, the study design which includes individuals with T2DM and ESRD allows for the identification of ESRD loci which are distinct from those presented herein (Table S10; [43]).
In conclusion, we have performed a GWAS for T2DM-ESRD in an African-American population from the southeastern United States. These results were then replicated in an additional sample recruited under identical ascertainment criteria. As a second stage of replication, a Validation study was carried out in three in-dependent cohorts to confirm the association of suspected loci with T2DM. As a result, we have identified SNP rs7560163 that reached stringent levels of genome-wide significance and four additional loci with more nominal evidence of association. These findings require further replication in independent African-American populations as well as in additional ethnicities to confirm these findings and aid in the identification of the causal variant(s).
Materials and Methods
Ethics Statement
Recruitment and sample collection procedures were approved by the Institutional Review Board at Wake Forest University (GWAS, Replication, T2DM, IRAS and IRASFS samples) and Howard University (HUFS samples). Written informed consent was obtained from all study participants.
Subjects
Genome-Wide Association Study (GWAS) samples and clinical characteristics. Recruitment and sample collection procedures were approved by the Institutional Review Board at Wake Forest University and informed consent was obtained from all study participants. Patients with T2DM-ESRD were recruited from dialysis facilities. T2DM was diagnosed in African Americans who reported developing T2DM after the age of 25 and who did not receive only insulin therapy since diagnosis. In addition, cases had to have at least one of the following three criteria for inclu-sion: a) T2DM diagnosed at least 5 years before initiating renal
replacement therapy, b) background or greater diabetic retinopathy and/or c)$100 mg/dl proteinuria on urinalysis in the absence of other causes of nephropathy (T2DM-ESRD cases). Unrelated African-American controls without a current diagnosis of diabetes or renal disease were recruited from the community and internal medicine clinics (controls). All T2DM-ESRD cases and controls lacking T2DM and ESRD were born in North Carolina, South Carolina, Georgia, Tennessee or Virginia. DNA extraction was performed using the PureGene system (Gentra Systems; Minneapolis, MN).
Replication study samples and clinical charac-teristics. African-American T2DM-ESRD cases and controls lacking T2DM and ESRD were recruited using the same criteria as the case and control subjects that were used in the GWAS.
Validation study samples and clinical charac-teristics. T2DM Cases. Subjects with T2DM without evidence of nephropathy were recruited from medical clinics, churches, health fairs and community resources. Individuals were unrelated and self-described African Americans. All subjects were born in North Carolina, South Carolina, Georgia, Virginia or Tennessee. The PureGene system (Gentra Systems; Minneapolis, MN) was used for DNA extraction.Controls. The Howard University Family Study (HUFS) is a population-based study of African-American families enrolled from the Washington, D.C. metropolitan area. Families were not ascertained based on a given phenotype. In a second phase of recruitment, additional unrelated individuals from the same geographic area were enrolled to facilitate a nested case-control study design. A total of 1,976 samples remained after data cleaning. Diagnosis of T2DM was based on the criteria established by the American Diabetes Association Expert Committee: a fasting plasma glucose concentration $126 mg/ dL (7.0 mmol/l) or a 2-h postload value in the oral glucose tolerance test $200 mg/dL (11.1 mmol/l) on more than one occasion or receiving medication for T2DM. From this sample, a subset of 927 unrelated control individuals was used for analysis.
IRAS. The Insulin Resistance Atherosclerosis Study (IRAS) is a multicenter population-based cohort study that recruited men and women from 40 to 69 years of age living in four U.S. communities from 1992 to 1993 [44]. The study recruited approximately equal numbers of persons with normal glucose tolerance, impaired glucose tolerance and T2DM. Diabetes was defined by self-report or a fasting glucose measures.126 mg/dL at baseline or follow-up visits. The IRAS protocol was approved by local institutional review committees and all participants gave informed consent.
IRASFS. Study design, recruitment and phenotyping for the IRAS Family Study (IRASFS) have been described [45]. Briefly, the IRASFS is a multicenter study designed to identify the genetic determinants of quantitative measures of glucose homeostasis. Members of large families of self-reported African Americans (n= 581 individuals in 42 pedigrees from Los Angeles, California) were recruited. Diabetes was defined by self-report, use of diabetes medications or fasting glucose measures.126 mg/dL at baseline or follow-up visits. The IRASFS protocol was approved by local institutional review committees and all participants gave informed consent.
Genotyping and Quality Control
GWAS. Genotyping was performed at the Center for Inherited Disease Research (CIDR) using 1mg of genomic DNA (diluted in 16TE buffer and at 50 ng/ml) on the Affymetrix Genome-wide Human SNP array 6.0. DNA from cases and controls were equally interleaved on 96-well master plates to ensure technical uniformity during sample processing. To confirm sample identity, a SNP barcode (96 SNPs) was generated prior to Type 2 Diabetes GWAS in African Americans
genotyping on the Affymetrix arrays and confirmed on downstream released genotyping data. Genotypes were called using Birdseed version 2; APT 1.10.0 by grouping samples by DNA plate to determine the genotype cluster boundaries. All autosomal SNPs (n = 868,157) were included in analysis but classified on data quality with primary inference drawn from SNPs (n = 832,357) which had less than 5% missing data, Hardy-Weinberg P-values in cases greater than 0.0001 and in controls greater than 0.01, no significant difference in missing data rate between cases and controls and were polymorphic. The average sample call rate was 99.16% for all autosomal SNPs. Forty-six blind duplicates were included in genotyping and had a concordance rate of 99.59%. In addition, individuals whose gender call from X chromosome genotype data was discordant with the gender obtained from patient interviews were excluded from the analysis (n= 1). Cryptic relatedness was estimated by pairwise identity-by-descent (IBD) analysis implemented in the PLINK analysis software package (http://pngu.mgh.harvard.edu/ purcell/plink/). Two duplicate samples were identified, and one sample in each duplicate pair was removed. In addition, 104 individuals were identified as cryptic first degree relatives. We also assessed heterozygosity by estimating the inbreeding coefficient using PLINK. One subject had an F value.4 standard deviations; this excess of homozygosity would suggest population substructure and this subject was removed. Our final dataset consisted of 1994 individuals in which we performed the association analysis.
Replication. The replication sample consisted of a population recruited under identical ascertainment criteria to that of the GWAS. A total of 749 SNPs (including 272 SNPs captured in 104 linkage disequilibrium (LD) blocks defined by an r2.0.50 at consecutive loci as assessed in 988 unrelated GWAS control subjects; 581 independent loci) were selected for genotyping on the Sequenom MassArray platform (Sequenom; San Diego, CA). Case and control samples were genotyped and analyzed together to avoid sample-dependent SNP calling bias. SNPs were included in analysis if genotyping was greater than 90% efficient, had a Hardy-Weinberg P-value$0.001 in the replication cohort and were polymorphic (n = 712 SNPs, including 264 SNPs captured in 102 LD blocks defined by an r2.0.50 at consecutive loci as assessed in 988 unrelated GWAS control subjects; 550 independent loci). Forty five blind duplicate samples included in genotyping had a concordance rate of.99.9%.
Validation. Among the 712 SNPs genotyped during the replication phase, 122 (including 41 SNPs captured in 17 linkage disequilibrium (LD) blocks defined by an r2.0.50 at consecutive loci as assessed in 690 unrelated Replication control subjects; 98 independent loci) were genotyped using the iPLEXTMSequenom MassARRAY platform (T2DM, IRAS and IRASFS) or on the Affymetrix Genome-wide Human SNP array 6.0 (Controls) for the validation phase. Genotyping was greater than 90% efficient and the 50 blind duplicate samples included in genotyping had a concordance rate of 100%.
Analysis
GWAS. To address the effect of admixture in this African-American dataset we performed a Principal Components Analysis (PCA) which utilized all high quality data from the GWAS excluding regions of high LD and inversions. This approach was an iterative process whereby all high quality autosomal SNPs were used to calculate the top 50 principal components. Once calculated, the principal components were examined to determine if they were tied to regions of the genome. If so, those SNPs were excluded and the analysis repeated. The first principal component (PC1) explained the largest proportion of variation at
22% and was used as a covariate in all analyses. A direct comparison of the PCA with FRAPPE [46] analysis of 70 ancestry informative markers (AIMs; [47]) resulted in a high correlation between PC1 and the AIMs ancestry estimates, r2
= 0.87. The mean (SD) African ancestry proportion in 965 T2DM-ESRD cases and 1,029 controls was 0.8060.11 and 0.7860.11, respectively, as estimated by FRAPPE analysis. Other principal components were associated with regions of the genome, representing another unclassified source of variance. To test for association with T2DM-ESRD, genotypic tests of association were performed on each SNP individually using SNPGWA (www.phs.wfubmc.edu; [48]), an analytic package which includes the capability to perform association calculations adjusting for covariates. The primary inference was based on the additive genetic model; with note when there is strong evidence of a departure from additivity. The inflation factor was calculated as the observed mean of the chi squared statistic and compared to its theoretical expectation of 1 under the null hypothesis.
Imputation was performed for autosomes using MACH (version 1.0.16, http://www.sph.umich.edu/csg/abecasis/MaCH/) to ob-tain missing genotypes for previously identified T2DM index variants and to provide support for regions associated with T2DM in the African American dataset. SNPs with minor allele frequency $1%, call rate$95% and Hardy–WeinbergP-value$1024
were used for imputation. A 1:1 mixture of the HapMap II release 22 (NCBI build 36) CEU:YRI consensus haplotypes (http://math-gen.stats.ox.ac.uk/impute/) were used as a reference panel. Imputation was performed in two steps. For the first step, 484 unrelated African-American samples were randomly selected to calculate recombination and error rate estimates. In the second step, these rates were used to impute all samples across the SNPs in the entire reference panel. Imputation results were filtered at an rsq threshold of$0.3 and a minor allele frequency$0.05.
We examined previously identified T2DM loci for association with T2DM in the African American GWAS dataset. For SNPs not available on the Affymetrix 6.0 array or from direct genotyping (n = 10), genotypes were determined from imputation. In addition to the index variant, we identified the corresponding LD block using the HapMap phase II CEU data as defined by Gabrielet al.[49] and implemented in Haploview. These intervals were then extracted from the African-American GWAS and the most significant SNP identified. These results were corrected for the effective number of SNPs (independent SNPs) in each locus counted using the Li and Ji method implemented in SOLAR [50]. The empirical locus-specific P-values were adjusted for multiple comparisons by Bonferroni correction for the effective number of SNPs (Table S1).
Replication in T2DM-ESRD cases and controls lacking T2DM and ESRD. To account for admixture in the replication cohort, ancestral allele proportions were estimated by comparing allele frequencies to 70 AIMs [47] genotyped in 44 Yoruba Nigerians and 39 European Americans. Individual ancestral proportions were generated for each subject using FRAPPE [46], an EM algorithm-based approach, under a two-population model and used as covariates in all analyses. The mean (SD) African ancestry proportion in 709 T2DM-ESRD cases and 690 controls was 0.8060.12 and 0.7660.13, respectively. Association analysis was performed as described for the GWAS.
Sequenom MassArray (T2DM cases) or Affymetrix 6.0 array (controls) to frequencies reported in the HapMap CEU and YRI populations (unrelated samples only). Individual ancestral proportions were generated for each subject using FRAPPE [46] under a two-population model and used as covariates in all analyses. The mean (SD) African ancestry proportion in T2DM cases and controls was 0.7860.11 and 0.7660.12, respectively. Association analysis was performed as described for the GWAS. For the IRAS and IRASFS cohorts, ancestral allele frequencies were estimated using 70 AIMs genotyped in 44 Yoruba Nigerians and 39 European Americans. Individual ancestral proportions were generated for each subject using FRAPPE [46] under a two-population model and used as covariates in all analyses. For the IRASFS cohort, each SNP was examined for Mendelian inconsistencies using PedCheck [51]. Genotypes inconsistent with Mendelian inheritance were converted to missing. Maximum likelihood estimates of allele frequencies were computed using the largest set of unrelated African-American individuals (n= 58), and then genotypes were tested for departures from Hardy-Weinberg proportions. For the IRAS (unrelated individuals) and IRASFS (related individuals) cohorts, data was analyzed using a variance component measured genotype model [50]. To model T2DM as the outcome, a threshold model of the variance component measured genotype model was used. Likelihood ratio tests were computed for the tests of association with the individual SNP, modeling the correlation structure suggested by the familial relationships as appropriate, i.e. IRASFS. The family data has already been examined in detail and familial relationships corrected based on a linkage panel. P-values were calculated from the threshold model while the odds ratios were calculated from a logistic regression model.
Meta-Analyses. In order to perform GWAS+ Replication, Validation (T2DM, IRAS and IRASFS) and Overall (GWAS+ Replication +Validation) analyses a meta-analysis approach was taken. Meta-analysis was performed using the weighted Z-method implemented in METAL (www.sph.umich.edu/csg/abecasis/ metal). This approach allows P-values and direction of effect to be combined independent of b-estimates, allowing for incompatibility between phenotype units as in the Fisher method [52], but with improved power and precision over Fisher’s test [53]. The Z-statistic was derived from the sample-specificP-values and directionality of effect which were then summed with weights proportional to the square root of the sample size for each sub-study.
Quantitative Trait Analysis. To test for association between individual SNPs and quantitative measures of glucose homeostasis in the IRAS and IRASFS cohorts, differences in trait values by genotype were tested using the variance components model that explicitly models the correlation among related individuals as implemented in SOLAR (12). For statistical testing, trait values were transformed to best approximate the distributional assumptions of the test and to minimize heterogeneity of the variance. The primary statistical inference was the additive genetic model. All tests were computed after adjustment for age, gender, BMI and admixture adjustment.
Exploration of eQTLS for T2DM loci
To identify potential T2DM-susceptibility genes we explored association of the putative African-American T2DM loci with transcript levels for flanking genes using gene expression profiles from the publically available HapMap Yoruba (YRI) dataset [54]. Coupling the YRI expression dataset with genotypes from the most associated loci we explored the association of SNPs with flanking genes using the variance components model and
accounting for correlation among related individuals as imple-mented in SOLAR (12).
Supporting Information
Figure S1 Quartile-Quartile plot of the genome-wide association study results.
(DOC)
Figure S2 African-American T2DM candidate regions. A) rs7542900 region. B) rs4659485 region. C) rs7560163 region. D) rs2722769 region. E) rs7107217 region.2log10additiveP-value
from the GWAS are plotted versus position (NCBI Build 36.1, hg18). The large red diamond indicates the additiveP-valuefrom the GWAS of the marker(s) displayed. The large blue diamond and corresponding P-value indicates the additive P-values from the Overall analysis of the marker(s) displayed. r2based on the control samples is color-coded with respect to the most significant SNP: red (0.8–1.0), orange (0.5–0.8), yellow (0.2–0.5) and white (,0.2). Gene annotations were obtained from UCSC Genome Browser (RefSeq Genes, b36). Arrows represent direction of transcription.
(DOC)
Table S1 GWAS P-values for previously associated T2DM loci. Loci are ordered by chromosome and position (NCBI Build 36.1, hg18) and referenced (Ref) by the initial publication. The African American major/minor alleles are presented on the positive strand with the Caucasian risk allele underlined. For each T2DM Index SNP, results from the African American GWAS (the minor allele frequency (MAF) for the T2DM-ESRD and control populations or combined for imputed SNPs with the corresponding additiveP-valueand odds ratio (OR) with associated 95% confidence interval (CI)) are presented with respect to the published risk allele (underlined). In addition, association results (additive P-value and odds ratio (OR) with associated 95% confidence interval (CI)) from recent Caucasian large-scale meta-analyses with associated references (Ref) are listed for comparison. For each index SNP, the corresponding LD block was identified using the HapMap phase II CEU data as defined by Gabrielet al.and implemented in Haploview. These intervals were then extracted from the African-American GWAS and the most significant SNP listed. From the GWAS, the minor allele frequency (MAF) for the T2DM-ESRD and control populations are listed with the corresponding additiveP-value (nominal and corrected for the effective number of tests at the locus (number of SNPs genotyped in the GWAS and effective number of SNPs determined from the Li and Ji method and implemented in SOLAR)) and odds ratio (OR) with associated 95% confidence interval (CI) with respect to the African-American minor allele. (DOC)
Table S2 GWAS, Replication, T2DM, IRAS and IRASFS P-values for 122 GWAS SNPs genotyped on replication and validation samples. SNPs are ordered by chromosome and position (NCBI Build 36.1) with the major/minor alleles (positive strand). For each cohort, minor allele frequency (MAF) for case and control populations are listed with the reference allele (minor allele) and corresponding additive P-value and odds ratio (OR) with associated 95% confidence interval (CI) with respect to the minor allele. Note: For IRAS-FS MAFs are derived from the overall sample including relatives. In addition, allele frequencies has been extracted from HapMap Yoruba (YRI) and CEPH (CEU) samples for comparison. Rows in red type represent the five loci which are the focus of the manuscript.
(XLS)
Type 2 Diabetes GWAS in African Americans
Table S3 ValidationP-valuesfor T2DM loci across the genome.SNPs are ordered by chromosome and position (NCBI Build 36.1, hg18) with the major/minor alleles (positive strand) and corresponding gene (underlined) or nearest annotated gene. For the T2DM, IRAS and IRASFS analyses, the minor allele frequency (MAF) for T2DM and control populations are listed with the corresponding additiveP-value. Note: For IRASFS MAFs are derived from the overall sample including relatives. For the Validation meta-analysis the additiveP-valueand odds ratio (OR) with associated 95% confidence interval (CI) are presented with respect to the minor allele.
(DOC)
Table S4 Association results for African-American T2DM loci in the Diabetes Genetics Replication and Meta-analysis (DIAGRAM) Consortium.SNPs are ordered by chromosome and position (NCBI Build 36.1, hg18) and the nearest annotated gene is listed. For each SNP the major/minor alleles identified in the Overall African-American meta-analysis are indexed on the forward strand. Results from the association analysis in the Overall African-American cohort and DIAGRAM Consortium include the allele frequency (AF), odds ratio (OR) with associated 95% confidence interval (CI) andP-valuewith respect to the minor allele identified in the African-American population. SNP rs7560163 did not pass quality control filters in the DIAGRAM Consortium and was not included in analysis. (DOC)
Table S5 Quantitative trait meta-analysis for African-American T2DM loci across the genome.SNPs are ordered by chromosome and position (NCBI Build 36.1, hg18) with the major/minor alleles (positive strand) and the nearest annotated gene is listed. For the IRAS and IRASFS samples, thebcoefficient with respect to the minor allele is listed with the corresponding additiveP-value. For the meta-analysis, the z-statistics is listed with the corresponding additiveP-value.
(DOC)
Table S6 Association results for African-American T2DM loci in the Meta-Analyses of Glucose and Insulin-related traits Consortium (MAGIC). SNPs are ordered by chromosome and position (NCBI Build 36.1, hg18) with the alleles on the positive strand (African American risk alleles are underlined) and the nearest annotated gene is listed. For each SNP and trait combination, the effect size and standard error are listed with the correspondingP-value.
(DOC)
Table S7 Gender stratified association analysis with T2DM. SNPs are ordered by chromosome and position (NCBI Build 36.1, hg18) with the major/minor alleles (positive strand) and corresponding gene (underlined) or nearest annotated genes (+/2500 kb). For males and females, the additive P-value and odds ratio (OR) with associated 95% confidence interval (CI) with respect to the minor allele and heterozygosity P-value are listed. (DOC)
Table S8 Power Calculations. Table S8a. Genome-wide association study power analysis for causal variant in complete and incomplete linkage disequilibrium with a typed variant given minor allele frequency (p) in 965 cases and 1029 controls. Table S8b. Replication power analysis for causal variant in complete and incomplete linkage disequilibrium with a typed variant given minor allele frequency (p) in 709 cases and 690 controls. Table S8c. GWAS + Replication sample power analysis for causal variant in complete and incomplete linkage disequilibrium with a typed variant given minor allele frequency (p) in 1674 cases and
1719 controls. Table S8d. T2DM power analysis for causal variant in complete and incomplete linkage disequilibrium with a typed variant given minor allele frequency (p) in 1246 cases and 927 controls. Table S8e. IRAS power analysis for causal variant in complete and incomplete linkage disequilibrium with a typed variant given minor allele frequency (p) in 115 cases and 164 controls. Table S8f. IRASFS power analysis for causal variant in complete and incomplete linkage disequilibrium with a typed variant given minor allele frequency (p) in 97 cases and 507 controls. Table S8g. Validation meta-analysis power analysis for causal variant in complete and incomplete linkage disequilibrium with a typed variant given minor allele frequency (p) in 1458 cases and 1598 controls. Table S8h. Overall power analysis for causal variant in complete and incomplete linkage disequilibrium with a typed variant given minor allele frequency (p) in 3132 cases and 3317 controls.
(DOC)
Table S9 IRAS and IRASFS power analysis to detect a causal variant with the effect size observed in the T2DM cohort.
(DOC)
Table S10 P-values for putative ESRD loci across the genome. SNPs selected from the GWAS (P,0.001) and associated in the Replication cohort (P,0.05 and directionally consistent) but which were not associated in the Validation cohort (P.0.05) and could represent putative ESRD loci. SNPs are ordered by chromosome and position (NCBI Build 36.1) with the major/minor alleles (positive strand) and corresponding gene (underlined) or nearest annotated gene. For each phase of the study, GWAS+Replication, Validation and Overall analyses, the additive P-value and odds ratio (OR) with associated 95% confidence interval (CI) with respect to the minor allele is listed. (DOC)
Acknowledgments
We wish to thank the patients, their relatives and staff of the Southeastern Kidney Council, Inc./ESRD Network 6 for their participation.
List of authors and affiliations for the DIAGRAM Consortium Benjamin F Voight1,2,3, Laura J Scott4, Valgerdur Steinthorsdottir5,
Andrew P Morris6, Christian Dina7,8, Ryan P Welch9, Eleftheria Zeggini6,10, Cornelia Huth11,12, Yurii S Aulchenko13, Gudmar Thorleifs-son5, Laura J McCulloch14, Teresa Ferreira6, Harald Grallert11,12, Najaf Amin13, Guanming Wu15, Cristen J Willer4, Soumya Raychaudhuri1,2,16, Steve A McCarroll1,17, Claudia Langenberg18, Oliver M Hofmann19, Jose´e
Dupuis20,21, Lu Qi22–24, Ayellet V Segre`1,2,17, Mandy van Hoek25, Pau
Navarro26, Kristin Ardlie1, Beverley Balkau27,28, Rafn Benediktsson29,30,
Amanda J Bennett14, Roza Blagieva31, Eric Boerwinkle32, Lori L Bonnycastle33, Kristina Bengtsson Bostro¨m34, Bert Bravenboer35, Suzan-nah Bumpstead10, Noe¨l P Burtt1, Guillaume Charpentier36, Peter S Chines33, Marilyn Cornelis24, David J Couper37, Gabe Crawford1, Alex SF Doney38,39, Katherine S Elliott6, Amanda L Elliott1,17,40, Michael R Erdos33, Caroline S Fox21,41, Christopher S Franklin42, Martha Ganser4, Christian Gieger11, Niels Grarup43, Todd Green1,2, Simon Griffin18,
Christopher J Groves14, Candace Guiducci1, Samy Hadjadj44, Neelam
Hassanali14, Christian Herder45, Bo Isomaa46,47, Anne U Jackson4, Paul
RV Johnson48, Torben Jørgensen49,50, Wen HL Kao51,52, Norman Klopp11, Augustine Kong5, Peter Kraft22,23, Johanna Kuusisto53, Torsten Lauritzen54, Man Li51, Aloysius Lieverse55, Cecilia M Lindgren6, Valeriya Lyssenko56, Michel Marre57,58, Thomas Meitinger59,60, Kristian Mid-thjell61, Mario A Morken33, Narisu Narisu33, Peter Nilsson56, Katharine R Owen14, Felicity Payne10, John RB Perry62,63, Ann-Kristin Petersen11,
Carl Platou61, Christine Proenc¸a7, Inga Prokopenko6,14, Wolfgang
Rathmann64, N William Rayner6,14, Neil R Robertson6,14, Ghislain
Qi Sun22,23, Amy J Swift33, Barbara Thorand11, Jean Tichet71, Tiinamaija Tuomi46,72, Rob M van Dam24, Timon W van Haeften73, Thijs van Herpt25,55, Jana V van Vliet-Ostaptchouk74, G Bragi Walters5, Michael N Weedon62,63, Cisca Wijmenga75, Jacqueline Witteman13, Richard N
Bergman76, Stephane Cauchi7, Francis S Collins77, Anna L Gloyn14, Ulf
Gyllensten78, Torben Hansen43,79, Winston A Hide19, Graham A Hitman80, Albert Hofman13, David J Hunter22,23, Kristian Hveem61,81, Markku Laakso53, Karen L Mohlke82, Andrew D Morris38,39, Colin NA Palmer38,39, Peter P Pramstaller83, Igor Rudan42,84,85, Eric Sijbrands25, Lincoln D Stein15, Jaakko Tuomilehto86, Andre Uitterlinden25, Mark
Walker87, Nicholas J Wareham18, Richard M Watanabe76,88, Goncalo R
Abecasis4, Bernhard O Boehm31, Harry Campbell42, Mark J Daly1,2, Andrew T Hattersley62,63, Frank B Hu22–24, James B Meigs3,70, James S Pankow89, Oluf Pedersen43,90,91, H.-Erich Wichmann11,12,92, Ineˆs Bar-roso10, Jose C Florez1,2,3,93, Timothy M Frayling62,63, Leif Groop56,72, Rob
Sladek65–67, Unnur Thorsteinsdottir5,94, James F Wilson42, Thomas Illig11,
Philippe Froguel7,95, Cornelia M van Duijn13, Kari Stefansson5,94, David
Altshuler1,2,3,17,40,93, Michael Boehnke4, Mark I McCarthy6,14,96 1. Broad Institute of Harvard and Massachusetts Institute of Technology (MIT), Cambridge, Massachusetts 02142, USA
2. Center for Human Genetic Research, Massachusetts General Hospital, 185 Cambridge Street, Boston, Massachusetts 02114, USA
3. Department of Medicine, Harvard Medical School, Boston, Massachusetts 02115, USA
4. Department of Biostatistics, University of Michigan, Ann Arbor, Michigan 48109-2029, USA
5. deCODE Genetics, 101 Reykjavik, Iceland
6. Wellcome Trust Centre for Human Genetics, University of Oxford, Oxford, OX3 7BN, UK
7. CNRS-UMR-8090, Institute of Biology and Lille 2 University, Pasteur Institute, F-59019 Lille, France
8. INSERM UMR915 CNRS ERL3147 F-44007 Nantes, France 9. Bioinformatics Program, University of Michigan, Ann Arbor, MI USA 48109
10. Wellcome Trust Sanger Institute, Hinxton, CB10 1HH, UK 11. Institute of Epidemiology, Helmholtz Zentrum Muenchen, 85764 Neuherberg, Germany
12. Institute of Medical Informatics, Biometry and Epidemiology, Ludwig-Maximilians-Universita¨t, 81377 Munich, Germany
13. Department of Epidemiology, Erasmus University Medical Center, P.O. Box 2040, 3000 CA Rotterdam, The Netherlands.
14. Oxford Centre for Diabetes, Endocrinology and Metabolism, University of Oxford, OX3 7LJ, UK
15. Ontario Institute for Cancer Research, 101 College Street, Suite 800, Toronto, Ontario M5G 0A3, Canada
16. Division of Rheumatology, Immunology and Allergy, Brigham and Women’s Hospital, Harvard Medical School, Boston, Massachusetts 02115, USA
17. Department of Molecular Biology, Harvard Medical School, Boston, Massachusetts 02115, USA
18. MRC Epidemiology Unit, Institute of Metabolic Science, Adden-brooke’s Hospital, Cambridge CB2 0QQ, UK
19. Department of Biostatistics, Harvard School of Public Health, Boston, Massachusetts 02115, USA
20. Department of Biostatistics, Boston University School of Public Health, Boston, Massachusetts 02118, USA
21. National Heart, Lung, and Blood Institute’s Framingham Heart Study, Framingham, Massachusetts 01702, USA
22. Department of Nutrition, Harvard School of Public Health, 665 Huntington Ave, Boston, MA 02115, USA
23. Department of Epidemiology, Harvard School of Public Health, 665 Huntington Ave, Boston, MA 02115, USA
24. Channing Laboratory, Dept. of Medicine, Brigham and Women’s Hospital and Harvard Medical School, 181 Longwood Ave, Boston, MA 02115, USA
25. Department of Internal Medicine, Erasmus University Medical Centre, PO-Box 2040, 3000 CA Rotterdam, The Netherlands
26. MRC Human Genetics Unit, Institute of Genetics and Molecular Medicine, Western General Hospital, Edinburgh, EH4 2XU, UK
27. INSERM U780, F-94807 Villejuif, France 28. University Paris-Sud, F-91405 Orsay, France 29. Landspitali University Hospital, 101 Reykjavik, Iceland 30. Icelandic Heart Association, 201 Kopavogur, Iceland
31. Division of Endocrinology, Diabetes and Metabolism, Ulm University, 89081 Ulm, Germany
32. The Human Genetics Center and Institute of Molecular Medicine, University of Texas Health Science Center, Houston, Texas 77030, USA 33. National Human Genome Research Institute, National Institute of Health, Bethesda, Maryland 20892, USA
34. R&D Centre, Skaraborg Primary Care, 541 30 Sko¨vde, Sweden 35. Department of Internal Medicine, Catharina Hospital, PO-Box 1350, 5602 ZA Eindhoven, The Netherlands
36. Endocrinology-Diabetology Unit, Corbeil-Essonnes Hospital, F-91100 Corbeil-Essonnes, France
37. Department of Biostatistics and Collaborative Studies Coordinating Center, University of North Carolina at Chapel Hill, Chapel Hill, North Carolina, 27599, USA
38. Diabetes Research Centre, Biomedical Research Institute, University of Dundee, Ninewells Hospital, Dundee DD1 9SY, UK
39. Pharmacogenomics Centre, Biomedical Research Institute, Univer-sity of Dundee, Ninewells Hospital, Dundee DD1 9SY, UK
40. Department of Genetics, Harvard Medical School, Boston, Massachusetts 02115, USA
41. Division of Endocrinology, Diabetes, and Hypertension, Brigham and Women’s Hospital, Harvard Medical School, Boston, Massachusetts 02115, USA
42. Centre for Population Health Sciences, University of Edinburgh, Teviot Place, Edinburgh, EH8 9AG, UK
43. Hagedorn Research Institute, DK-2820 Gentofte, Denmark 44. Centre Hospitalier Universitaire de Poitiers, Endocrinologie Diabetologie, CIC INSERM 0801, INSERM U927, Universite´ de Poitiers, UFR, Me´decine Pharmacie, 86021 Poitiers Cedex, France
45. Institute for Clinical Diabetology, German Diabetes Center, Leibniz Center for Diabetes Research at Heinrich Heine University Du¨sseldorf, 40225 Du¨sseldorf, Germany
46. Folkha¨lsan Research Center, FIN-00014 Helsinki, Finland 47. Malmska Municipal Health Center and Hospital, 68601 Jakobstad, Finland
48. Diabetes Research and Wellness Foundation Human Islet Isolation Facility and Oxford Islet Transplant Programme, University of Oxford, Old Road, Headington, Oxford, OX3 7LJ, UK
49. Research Centre for Prevention and Health, Glostrup University Hospital, DK-2600 Glostrup, Denmark
50. Faculty of Health Science, University of Copenhagen, 2200 Copenhagen, Denmark
51. Department of Epidemiology, Johns Hopkins University, Baltimore, Maryland 21287, USA
52. Department of Medicine, and Welch Center for Prevention, Epidemiology, and Clinical Research, Johns Hopkins University, Balti-more, Maryland 21287, USA
53. Department of Medicine, University of Kuopio and Kuopio University Hospital, FIN-70211 Kuopio, Finland
54. Department of General Medical Practice, University of Aarhus, DK-8000 Aarhus, Denmark
55. Department of Internal Medicine, Maxima MC, PO-Box 90052, 5600 PD Eindhoven, The Netherlands
56. Department of Clinical Sciences, Diabetes and Endocrinology Research Unit, University Hospital Malmo¨, Lund University, 205 02 Malmo¨, Sweden
57. Department of Endocrinology, Diabetology and Nutrition, Bichat-Claude Bernard University Hospital, Assistance Publique des Hoˆpitaux de Paris, 75870 Paris Cedex 18, France
58. INSERM U695, Universite´ Paris 7, 75018 Paris , France 59. Institute of Human Genetics, Helmholtz Zentrum Muenchen, 85764 Neuherberg, Germany
60. Institute of Human Genetics, Klinikum rechts der Isar, Technische Universita¨t Mu¨nchen, 81675 Muenchen, Germany
61. Nord-Trøndelag Health Study (HUNT) Research Center, Depart-ment of Community Medicine and General Practice, Norwegian University of Science and Technology, NO-7491 Trondheim, Norway
62. Genetics of Complex Traits, Institute of Biomedical and Clinical Science, Peninsula Medical School, University of Exeter, Magdalen Road, Exeter EX1 2LU, UK
63. Diabetes Genetics, Institute of Biomedical and Clinical Science, Peninsula Medical School, University of Exeter, Barrack Road, Exeter EX2 5DW, UK
Type 2 Diabetes GWAS in African Americans
64. Institute of Biometrics and Epidemiology, German Diabetes Center, Leibniz Center for Diabetes Research at Heinrich Heine University Du¨sseldorf, 40225 Du¨sseldorf, Germany
65. Department of Human Genetics, McGill University, Montreal H3H 1P3, Canada
66. Department of Medicine, Faculty of Medicine, McGill University, Montreal, H3A 1A4, Canada
67. McGill University and Genome Quebec Innovation Centre, Montreal, H3A 1A4. Canada
68. Department of Metabolic Diseases, Heinrich Heine University Du¨sseldorf, 40225 Du¨sseldorf, Germany
69. Department of Endocrinology and Diabetes, Norfolk and Norwich University Hospital NHS Trust , Norwich, NR1 7UY, UK.
70. General Medicine Division, Massachusetts General Hospital, Boston, Massachusetts, USA
71. Institut interre´gional pour la Sante´ (IRSA), F-37521 La Riche, France
72. Department of Medicine, Helsinki University Hospital, University of Helsinki, FIN-00290 Helsinki, Finland
73. Department of Internal Medicine, University Medical Center Utrecht, 3584 CG Utrecht, The Netherlands
74. Molecular Genetics, Medical Biology Section, Department of Pathology and Medical Biology, University Medical Center Groningen and University of Groningen, 9700 RB Groningen, The Netherlands
75. Department of Genetics, University Medical Center Groningen and University of Groningen, 9713 EX Groningen, The Netherlands
76. Department of Physiology and Biophysics, University of Southern California School of Medicine, Los Angeles, California 90033, USA
77. National Institute of Health, Bethesda, Maryland 20892, USA 78. Department of Genetics and Pathology, Rudbeck Laboratory, Uppsala University, S-751 85 Uppsala, Sweden.
79. University of Southern Denmark, DK-5230 Odense, Denmark 80. Centre for Diabetes, Barts and The London School of Medicine and Dentistry, Queen Mary University of London, London E1 2AT, UK
81. Department of Medicine, The Hospital of Levanger, N-7600 Levanger, Norway
82. Department of Genetics, University of North Carolina, Chapel Hill, North Carolina 27599, USA
83. Institute of Genetic Medicine, European Academy Bozen/Bolzano (EURAC), Viale Druso 1, 39100 Bolzano, Italy
84. Croatian Centre for Global Health, Faculty of Medicine, University of Split, Soltanska 2, 21000 Split, Croatia
85. Institute for Clinical Medical Research, University Hospital ‘‘Sestre Milosrdnice’’, Vinogradska 29, 10000 Zagreb, Croatia
86. Department of Chronic Disease Prevention, National Institute for Health and Welfare, Helsinki FIN-00300, Finland,
87. Diabetes Research Group, Institute of Cellular Medicine, Newcastle University, Framlington Place, Newcastle upon Tyne NE2 4HH, UK
88. Department of Preventitive Medicine, Keck Medical School, University of Southern California, Los Angeles, CA, 90089-9001, USA
89. Division of Epidemiology and Community Health, University of Minnesota, Minneapolis, Minnesota 55454, USA
90. Department of Biomedical Science, Panum, Faculty of Health Science, University of Copenhagen, 2200 Copenhagen, Denmark
91. Faculty of Health Science, University of Aarhus, DK–8000 Aarhus, Denmark
92. Klinikum Grosshadern, 81377 Munich, Germany
93. Diabetes Unit, Massachusetts General Hospital, Boston, Massachu-setts 02144, USA
94. Faculty of Medicine, University of Iceland, 101 Reykjavı´k, Iceland 95. Genomic Medicine, Imperial College London, Hammersmith Hospital, W12 0NN, London, UK
96. Oxford National Institute for Health Research Biomedical Research Centre, Churchill Hospital, Old Road Headington, Oxford, OX3 7LJ, UK List of authors and affiliations for the MAGIC Investigators Jose´e Dupuis1,2,178, Claudia Langenberg3,178, Inga Prokopenko4,5,178, Richa Saxena6,7,178, Nicole Soranzo8,9,178, Anne U Jackson10, Eleanor Wheeler11, Nicole L Glazer12, Nabila Bouatia-Naji13, Anna L Gloyn4, Cecilia M Lindgren4,5, Reedik Ma¨gi4,5, Andrew P Morris5, Joshua Randall5, Toby Johnson14–16, Paul Elliott17,176, Denis Rybin18, Gudmar
Thorleifsson19, Valgerdur Steinthorsdottir19, Peter Henneman20, Harald
Grallert21, Abbas Dehghan22, Jouke Jan Hottenga23, Christopher S Franklin24, Pau Navarro25, Kijoung Song26, Anuj Goel5,27, John R B
Perry28, Josephine M Egan29, Taina Lajunen30, Niels Grarup31, Thomas
Sparsø31, Alex Doney32, Benjamin F Voight6,7, Heather M Stringham10, Man Li33, Stavroula Kanoni34, Peter Shrader35, Christine Cavalcanti-Proenc¸a13, Meena Kumari36, Lu Qi37, Nicholas J Timpson38, Christian Gieger21, Carina Zabena39, Ghislain Rocheleau40,41, Erik Ingelsson42,43, Ping An44, Jeffrey O’Connell45, Jian’an Luan3, Amanda Elliott6,7, Steven A
McCarroll6,7, Felicity Payne11, Rosa Maria Roccasecca11, Franc¸ois
Pattou46, Praveen Sethupathy47, Kristin Ardlie48, Yavuz Ariyurek49,
Beverley Balkau50, Philip Barter51, John P Beilby52,53, Yoav Ben-Shlomo54, Rafn Benediktsson55,56, Amanda J Bennett4, Sven Bergmann14,16, Murielle Bochud15, Eric Boerwinkle57, Ame´lie Bonnefond13, Lori L Bonnycastle47, Knut Borch-Johnsen58,59, Yvonne Bo¨ttcher60, Eric Brunner36, Suzannah J Bumpstead8, Guillaume Charpentier61, Yii-Der Ida Chen62, Peter Chines47, Robert Clarke63, Lachlan J M Coin17, Matthew N Cooper64,
Marilyn Cornelis37, Gabe Crawford6, Laura Crisponi65, Ian NM Day38,
Eco J Cde Geus23, Jerome Delplanque13, Christian Dina13, Michael R Erdos47, Annette C Fedson64,66, Antje Fischer-Rosinsky67,68, Nita G Forouhi3, Caroline S Fox2,69, Rune Frants70, Maria Grazia Franzosi71, Pilar Galan72, Mark OGoodarzi62, Ju¨rgen Graessler73, Christopher J Groves4, Scott Grundy74, Rhian Gwilliam8, Ulf Gyllensten75, Samy
Hadjadj76, Go¨ran Hallmans77, Naomi Hammond8, Xijing Han10,
Anna-Liisa Hartikainen78, Neelam Hassanali4, Caroline Hayward25, Simon C
Heath79, Serge Hercberg80, Christian Herder81, Andrew A Hicks82, David R Hillman66,83, Aroon D Hingorani36, Albert Hofman22, Jennie Hui52,84, Joe Hung85,86, Bo Isomaa87,88, Paul R V Johnson4,89, Torben Jørgen-sen90,91, Antti Jula92, Marika Kaakinen93, Jaakko Kaprio94–96, Y Antero Kesaniemi97
, Mika Kivimaki36, Beatrice Knight98, Seppo Koskinen99, Peter Kovacs100, Kirsten Ohm Kyvik101, G Mark Lathrop79, Debbie A
Lawlor38, Olivier Le Bacquer13, Ce´cile Lecoeur13, Yun Li10, Valeriya
Lyssenko102, Robert Mahley103, Massimo Mangino9, Alisa K Manning1, Marı´a Teresa Martı´nez-Larrad39, Jarred B McAteer6,104,105, Laura J McCulloch4, Ruth McPherson106, Christa Meisinger21, David Melzer28, David Meyre13, Braxton D Mitchell45, Mario A Morken47, Sutapa Mukherjee66,83, Silvia Naitza65, Narisu Narisu47, Matthew J Neville4,107,
Ben A Oostra108, Marco Orru`65, Ruth Pakyz45, Colin NA Palmer109,
Giuseppe Paolisso110, Cristian Pattaro82, Daniel Pearson47, John F
Peden5,27, Nancy L Pedersen42, Markus Perola96,111,112, Andreas F H Pfeiffer67,68, Irene Pichler82, Ozren Polasek113, Danielle Posthuma23,114, Simon C Potter8, Anneli Pouta115, Michael A Province44, Bruce M Psaty116,117, Wolfgang Rathmann118, Nigel W Rayner4,5, Kenneth Rice119, Samuli Ripatti96,111, Fernando Rivadeneira22,120, Michael
Roden81,121, Olov Rolandsson122, Annelli Sandbaek123, Manjinder
Sandhu3,124, Serena Sanna65, Avan Aihie Sayer125, Paul Scheet126, Laura
J Scott10, Udo Seedorf127, Stephen J Sharp3, Beverley Shields98, Gunnar Sigurdsson55,56, Eric J G Sijbrands22,120, Angela Silveira128, Laila Simpson64,66, Andrew Singleton129, Nicholas L Smith130,131, Ulla Sovio17, Amy Swift47, Holly Syddall125, Ann-Christine Syva¨nen132, Toshiko Tanaka133,134, Barbara Thorand21, Jean Tichet135, Anke To¨njes60,136,
Tiinamaija Tuomi87,137, Andre´ G Uitterlinden22,120, Ko Willems van
Dijk70,138, Mandy van Hoek120, Dhiraj Varma8, Sophie Visvikis-Siest139,
Veronique Vitart25, Nicole Vogelzangs140, Ge´rard Waeber141, Peter J Wagner96,111, Andrew Walley142, G Bragi Walters19, Kim L Ward64,66, Hugh Watkins5,27, Michael N Weedon28, Sarah H Wild24, Gonneke Willemsen23, Jaqueline CM Witteman22, John WG Yarnell143, Eleftheria Zeggini5,8, Diana Zelenika79, Bjo¨rn Zethelius43,144, Guangju Zhai9, Jing
Hua Zhao3, MCarola Zillikens120, DIAGRAM Consortium145, GIANT
Consortium145, Global BPgen Consortium145, Ingrid B Borecki44, Ruth J F
Loos3, Pierre Meneton80, Patrik KE Magnusson42, David M Nathan104,105, Gordon H Williams69,105, Andrew T Hattersley98, Kaisa Silander96,111, Veikko Salomaa146, George Davey Smith38, Stefan R Bornstein73, Peter Schwarz73, Joachim Spranger67,68, Fredrik Karpe4,107, Alan R Shuldi-ner45, Cyrus Cooper125, George V Dedoussis34, Manuel Serrano-Rı´os39,
Andrew DMorris109, Lars Lind132, Lyle J Palmer64,66,84, Frank B
Hu147,148, Paul W Franks149, Shah Ebrahim150, Michael Marmot36, WH
Linda Kao33,151,152, James S Pankow153, Michael J Sampson154, Johanna Kuusisto155, Markku Laakso155, Torben Hansen31,156, Oluf Peder-sen31,59,157, Peter Paul Pramstaller82,158,159, H Erich Wichmann21,160,161, Thomas Illig21, Igor Rudan24,162,163, Alan F Wright25, Michael Stumvoll60, Harry Campbell24, James F Wilson24, Anders Hamsten on behalf of
Procardis Consortium128, Richard N Bergman164, Thomas A