~ 1 ~
DESIGN AND IMPLEMENTATION OF
3D BUILDINGS INTEGRATION FOR A
WEBGL-BASED VIRTUAL GLOBE
A Case Study of Valencian Cadastre and FIDE Building Model
~ ii ~
D
ESIGN AND
I
MPLEMENTATION OF 3D
B
UILDINGS
I
NTEGRATION FOR A
W
EB
GL
-BASED
V
IRTUAL
G
LOBE
A Case Study of Valencian Cadastre and FIDE Building Model
Dissertation supervised by:
PhD Óscar Belmonte Fernández PhD Joaquín Huerta Guijarro
PhD Pedro Cabral
~ iv ~
ACKNOWLEDGMENTS
I wish to express my deep gratitude to my supervisor PhD Joaquín Huerta for the time and effort he dedicated supporting me. I am also grateful to PhD Óscar Belmonte and PhD Pedro Cabral for their support and for accepting the responsibility of reviewing and commenting this document. I am grateful as well to Prodevelop workmates because of their general expertise working with JavaScript and GIS technologies.
My appreciation also goes to my Erasmus Mundus colleagues, for making this experience such a valuable and pleasant one.
Finally my appreciation and thanks go to my dearest parents and brothers, uncles Luis and J. Antonio, friends and girlfriend for their support, comprehension and help, which make this thesis possible.
~ vi ~
D
ESIGN AND
I
MPLEMENTATION OF 3D
B
UILDINGS
I
NTEGRATION FOR A
W
EB
GL
-BASED
V
IRTUAL
G
LOBE
A Case Study of Valencian Cadastre and FIDE Building Model
ABSTRACT
~ viii ~
KEYWORDS
3D
Building Information Model
Building representation
Cadastre
Constrained Delaunay Triangulation
Extrusion
FIDE
Geo-process
Geographical Information System
Geospatial
GIS
HTML5
JavaScript
OpenGL ES
OpenSceneGraph
OSG
OSGEarth
OSGJS
ReadyMap
Scene Graph
Tile Map Service
Virtual Globe
WebGL
~ ix ~
ACRONYMS
3D Three dimensional
AJAX Asynchronous JavaScript And XML
BOE Official State Gazette (Spanish)
CAD Computer-Aided Design
CDT Constrained Delaunay Triangulation
COLLADA COLLAborative Design Activity
CSS Cascading Style Sheets
DEM Digital Elevation Model
DOM Document Object Model
EPSG European Petroleum Survey Group
FIDE Edification Exchange Data Format (Spanish)
fps frames per second
GDAL Geospatial Data Abstraction Library
GIS Geographic Information System
GPL General Public License
GPS Global Positioning System
HTML HyperText Markup Language
HTTP Hypertext Transfer Protocol
IGN National Geographic Institute
~ x ~
JSON JavaScript Object Notation
LGPL Lesser General Public License
LOD Level Of Detail
MIT Massachusetts Institute of Technology (License)
OGC Open Geospatial Consortium
OOL Object Oriented Language
OpenGL Open Graphics Library
OSG OpenSceneGraph
OSGJS OpenSceneGraph JavaScript
PHP Hypertext Preprocessor
SDK Software Development Kit
TMS Tile Map Service
UTM Universal Transverse Mercator
VBO Vertex Buffer Object
WebGL Web-based Graphics Library
WGS World Geodetic System
WMS Web Map Service
~ xi ~
INDEX
CHAPTER 1 - INTRODUCTION ... 1
1.1 Background ... 1
1.2 Hypothesis ... 5
1.3 Objectives and Limitations ... 5
1.4 Dissertation Organization ... 7
1.5 Chapter Review ... 8
CHAPTER 2 - STATE OF THE ART ... 9
2.1 Introduction ... 9
2.2 3D Map Toolkits ... 10
2.2.1 ReadyMap ... 10
2.2.2 WebGL Earth ... 12
2.2.3 OpenWebGlobe ... 13
2.3 3D on the Web ... 14
2.3.1 Google WebGLGlobe ... 14
2.3.2 PhiloGL ... 15
2.4 WebGL Globes Comparison ... 16
2.5 JavaScript 3D Render Engine Frameworks ... 18
2.5.1 OSGJS ... 19
2.5.2 PhiloGL ... 19
2.5.3 SceneJS ... 19
2.5.4 Three.js ... 19
2.5.5 SpiderGL ... 20
2.5.6 C3DL ... 20
2.5.7 CopperLicht ... 20
2.5.8 CubicVR ... 20
2.5.9 GammaJS ... 20
2.5.10 GLGE ... 21
2.5.11 Jax ... 21
2.5.12 O3D ... 21
2.5.13 Oak3D ... 21
2.5.14 X3DOM ... 21
2.5.15 Inka3D ... 22
2.5.16 KickJS ... 22
2.6 Reasons for ReadyMap Choice ... 22
2.7 Chapter Review ... 23
~ xii ~
3.1 Introduction ... 25
3.2 Requirements ... 25
3.2.1 Introduction ... 25
3.2.2 Data acquisition ... 25
3.2.3 Data requirements ... 26
3.2.4 Software and hardware requirements ... 27
3.2.4.1 Tested unit’s hardware ... 27
3.2.4.2 Tested unit’s software ... 28
3.3 Use Case Model ... 28
3.4 High Level Architecture ... 30
3.5 Planning (Gantt diagram) ... 32
3.6 Budget... 34
3.7 Chapter Review ... 35
CHAPTER 4 - DESIGN AND IMPLEMENTATION ... 37
4.1 Introduction ... 37
4.2 Pre-processing (Data preparation) ... 37
4.2.1 Introduction ... 37
4.2.2 Data and Software ... 38
4.2.3 Data Preparation (gvSIG & QGIS) ... 41
4.2.3.1 Reprojection and exportation ... 43
4.2.4 Data Preparation (JavaScript) ... 46
4.2.4.1 Server communication... 46
4.2.4.2 Constru.csv processing ... 48
4.2.4.3 Masa.json processing ... 50
4.2.4.4 Building’s JSON creation ... 52
4.3 Processing (Data visualization) ... 55
4.3.1 Introduction ... 55
4.3.2 Application Structure ... 55
4.3.3 Application Behaviour ... 57
4.3.4 File Organization ... 60
4.3.5 Data Management ... 60
4.3.6 Data Preparation (ReadyMap) ... 62
4.3.6.1 Server data loading and parsing ... 62
4.3.6.2 Buildings extrusion ... 63
4.3.6.3 VBO management ... 63
4.3.7 Data Visualization (ReadyMap) ... 65
4.3.7.1 Preliminary Concepts ... 65
4.3.7.2 Drawable Geometry ... 67
4.3.7.2.1 Primitive Arrays ... 69
Polygons rendering mode (GL_TRIANGLES) ... 69
Building’s side faces wrapping ... 69
Building roof wrapping ... 70
~ xiii ~
Building vertices connection ... 72
Points Sprites rendering mode (GL_POINTS)... 73
Simple vertices representation ... 73
4.3.7.2.2 Attribute Arrays ... 73
Colour gradient ... 74
Scene normals ... 75
4.3.7.3 Referenced Geometry ... 75
4.3.7.3.1 Matrix Transformation ... 75
Anchor point processing ... 76
Ordinary point processing ... 77
4.3.7.4 Drawable and Referenced Geometry Insertion ... 78
4.4 Chapter Review ... 79
CHAPTER 5 - RESULTS ... 81
5.1 Results Review ... 81
CHAPTER 6 - CONCLUSIONS ... 87
6.1 Research Summary ... 87
6.2 Research Contributions ... 89
6.3 Future Work ... 90
BIBLIOGRAPHY ... 93
APPENDIX A ... 99
A1 Introduction ... 99
A2 Captures ... 100
A2.1 R1 Amax Test ... 101
A2.2 R1 Amed Test ... 101
A2.3 R1 Amin Test ... 102
A2.4 R5 Amax Test ... 103
A2.5 R5 Amed Test ... 103
A2.6 R5 Amin Test ... 104
A2.7 R01 Amax Test ... 105
A2.8 R01 Amed Test ... 105
A2.9 R01 Amin Test ... 106
A2.10 Summary table ... 107
APPENDIX B ... 109
B1 Introduction ... 109
B2 Pre-processing (Data Preparation) ... 109
B2.1 Data Preparation (Java) ... 110
~ xiv ~
B2.3 Application Behaviour ... 112
B3 Processing (Data Visualization) ... 116
B3.1 File Organization ... 116
B3.2 Data Visualization (ReadyMap) ... 117
B3.2.1 Preliminary Concepts ... 117
B3.2.2 Drawable Geometry ... 118
B3.2.2.1 Primitive Arrays... 120
Polygons rendering mode (GL_TRIANGLES) ... 120
Building faces wrapping ... 120
Lines rendering mode (GL_LINE_STRIP) ... 122
Building vertices connection ... 122
Points Sprites rendering mode (GL_POINTS)... 122
Simple vertices representation ... 122
B3.2.2.2 Attribute Arrays ... 122
Face Colouring ... 122
B3.2.3 Referenced Geometry ... 125
B3.2.4 Drawable and Referenced Geometry Insertion ... 125
~ xv ~
INDEX OF TABLES
Table 1. WebGL globes’ comparison table ... 17
Table 2. Gantt diagram ... 33
Table 3. Budget table ... 35
Table 4. Shapefiles geometry comparison ... 43
Table 5. Data preparation’s script execution time ... 47
Table 6. Heights attribute codification II ... 49
Table 7. Rendering performance ... 84
~ xvi ~
INDEX OF FIGURES
Figure 1. ReadyMap WebGL globe’s appearance ... 10
Figure 2. ReadyMap’s architecture ... 11
Figure 3. WebGL Earth globe’s appearance ... 12
Figure 4. OpenWebGlobe globe's appearance ... 13
Figure 5. Google WebGL globe's appearance ... 14
Figure 6. PhiloGL globe's appearance ... 15
Figure 7. Web application's use case diagram ... 28
Figure 8. Web application's high level architecture diagram ... 30
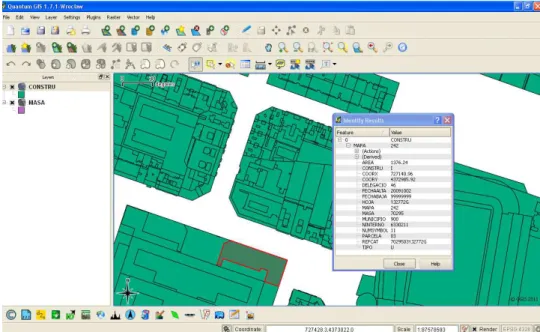
Figure 9. Constru.shp details ... 39
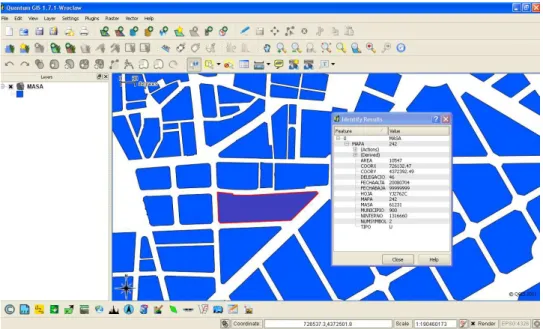
Figure 10. Masa.shp details ... 40
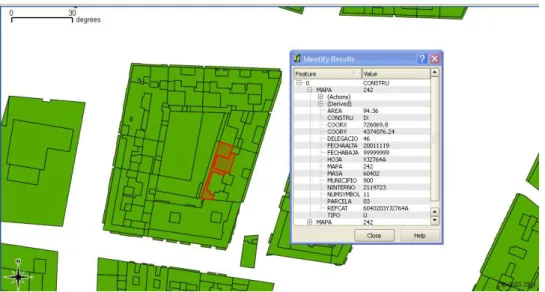
Figure 11. Constru.shp composition (closer detail) ... 42
Figure 12. Reprojection's work flow ... 44
Figure 13. Masa.json code sample ... 45
Figure 14. Constru.csv sample code ... 45
Figure 15. Data preparation's AJAX requests ... 47
Figure 16. Data preparation heights attribute values ... 48
Figure 17. Height attribute codification I ... 49
Figure 18. Heights attribute codification III ... 49
Figure 19. Heights definition algorithm code extraction ... 50
Figure 20. Area of triangle processing ... 52
Figure 21. Data preparation’s final output... 53
Figure 22. Prepared JSON sample ... 53
Figure 23. Data preparation process diagram ... 54
Figure 24. Application's structure diagram ... 56
Figure 25. Application's process flow diagram ... 58
Figure 26. Application's process flow diagram detail ... 59
Figure 27. Buildings extrusion diagram ... 63
Figure 28. Array of structures graphical example ... 64
Figure 29. Structure of arrays graphical example ... 65
Figure 30. osg.BuildingNode object ... 66
Figure 31. osg.Geometry object ... 67
Figure 32. osg.DrawElements geometry insertion ... 68
Figure 33. osg.BufferArray binding ... 68
Figure 34. Triangle creation processing ... 69
Figure 35. Complex roof shape triangulation ... 71
Figure 36. Lines creation processing ... 72
Figure 37. Building's colour gradient general perspective ... 74
Figure 38. osg.MatrixTransform object ... 76
Figure 39. Anchor vertex geometric transformations ... 77
Figure 40. Ordinary vertex geometric transformations ... 78
Figure 41. Geometry and Matrix Transformation merging ... 78
Figure 42. Dialogue boxes details ... 81
~ xvii ~
Figure 44. Line rendering mode representation ... 82
Figure 45. Points rendering mode representation ... 83
Figure 46. Cadastre area membership colour theme ... 83
Figure 47. Height colour theme ... 84
Figure 48. Graphic statistics panel ... 85
Figure 49. R1 Amax test ... 101
Figure 50. R1 Amed test ... 101
Figure 51. R1 Amin test... 102
Figure 52. R5 Amax test ... 103
Figure 53. R5 Amed test ... 103
Figure 54. R5 Amin test... 104
Figure 55. R01 Amax test ... 105
Figure 56. R01 Amed test ... 105
Figure 57. R01 Amin test... 106
Figure 58. FIDE model representation ... 110
Figure 59. Java application's structure ... 111
Figure 60. Java application's behaviour ... 113
Figure 61. Java application's behaviour detail ... 114
Figure 62. FIDE geometrical structure ... 115
Figure 63. osg.Geometry object ... 118
Figure 64. osg.DrawElements geometry insertion ... 119
Figure 65. osg.BufferArray binding ... 119
Figure 66. Vertical plane projections ... 121
Figure 67. Height colour theme ... 123
Figure 68. Solar incidence greyscale colour theme ... 124
~ 1 ~
Chapter 1
Introduction
1.1 Background
The widespread adoption of the World Wide Web has greatly changed the way that the current software is being developed, to the point that a big amount of new desktop-based software applications, are written for the Web instead of conventional computing architectures. Perhaps, the most common case where this trend is clearly noticed is Google Docs, which is a perfect example of how a traditional desktop application has successfully migrated to a Web-based environment.
In general terms, the software industry is shifting towards Web-based architectures (Taivalsaari, Mikkonen, Anttonen, & Salminen, 2011). In this type of Web-based software, applications rest on the Web as services; consisting of data, from a general point of view, that might be located anywhere in the world and not particularly in each of the computers as a conventional desktop approach.
~ 2 ~
The trend for applications to shift to web-based software is gaining plausibility as new Web application features are introduced, that enrich the web browser with additional programming functionalities and interfaces.
An especially important step in this direction, along with the arrival of the HTML5 standard (W3C, 2011), is the introduction of WebGL (Khronos Group, 2012) as a standardized part of HTML5 (Lubbers, Albers, & Salim, 2010). WebGL is a graphic standard that enables the creation of three dimensional (3D) content that can natively run efficiently in a standard Web browser without any plug-in components or extensions (Taivalsaari, Mikkonen, Anttonen, & Salminen, 2011).
The possibility to natively add and graphically display 3D objects into existing Web applications is probably, the most outstanding change the Web is going to adopt for quite a while (Bochicchio, Longo, & Vaira, 2011). Displaying 3D graphics content on the Web has been possible in the past with APIs such as Flash, O3D, VRML and X3D (Ortiz, 2010), but only with certain browsers or if the necessary browser plugin was installed.
Nonetheless, considering the adoption of WebGL by most major browser developers, 3D capabilities are integrated directly into the web browser from now on. This means that 3D content can run smoothly in any standard compliant browser without the installation of applications or additional components. WebGL support has already been implemented and included in some of the forthcoming new versions of the most well-known browsers. However, most browsers demonstrate a lack of full functionality, with just Google Chrome and Mozilla Firefox providing the best support to date.
In the long term, the most important impact of WebGL may be its capabilities as a gaming environment. Even if most of people have began migrating to web-based content, up to the present it has been very difficult to convince hard-core game developers and players to take web-based software seriously. This is partly owing to suitable development APIs were not available, and partly because, up to this time, the execution speed of web-based software was completely inadequate for CPU-hungry gaming applications.
~ 3 ~
2011), expecting 70$ billion dollars by 2015 (DFC Intelligence, 2010)), and the widespread user immersion it entails, a fast and productive development of WebGL-based Web applications is expected.
Nevertheless, the use of WebGL is not explicitly limited to game applications. Concerning the area this project deals with, Geographic Information Systems (GIS), yet again WebGL is present. Web GIS has become a cheap and easy way to promote the wide-spread use of geospatial data, thus many software developers have paid attention and interest, to the distribution of both maps and tools that the general public can use without restrictions.
One of the most impressive and clarifying examples is the case of the outstanding Nokia
Maps (Nokia, 2012). Nokia Maps —also known as Ovi Maps— is a free mapping
service developed by Nokia for its mobile phones and Smartphone multimedia devices, which is also available on a website for all major browsers. In the earlier stages of development, it was released with a direct end-user obligation to download and install a
proprietary plug-in —provided that such a plug-in was browser-compatible— in order
for the user to properly visualize 3D content in the browser. However, due to the extensive work of both browser software developers and graphic cards driver updates,
Nokia Maps —although still in beta version to date— has already migrated to WebGL,
so as to show the same 3D content in a more optimized way.
It should be noted that the use of WebGL is not only limited to the development of 3D applications. WebGL will serve as an important feature in the development of more conventional desktop-style 2D applications as well. In fact, it is quite possible that WebGL will effectively replace the use of the earlier 2D canvas drawing API that has been supported by many Web browsers. Yet again, and similar to previous Nokia Maps
example, Google Maps has migrated —within a 2D context this time— to WebGL
(Google, 2012) Considering the calibre of high profile companies that have directly bet
for WebGL-compliant applications’ development, this once again demonstrates the
importance of this graphic standard.
~ 4 ~
demand in computer science today, and OpenSceneGraph (OSG), as a 3D graphics toolkit, is being widely used in fields such as virtual reality, scientific visualization, visual simulation, modelling games, mobile applications and GIS, which is the case in this present research.
OSG is, in fact, a rendering middleware application. It is a solution that raises the level of abstraction and eases the complexity of using a low-level WebGL 1.0 API, at the cost of flexibility. The concepts of modularity and object oriented programming are often applied to manage graph primitives, materials, and different data sets in visual user applications as the one concerning in this project. The application of these concepts saves much development time and makes it possible to combine new functionalities, such as modules and plug-ins.
Furthermore, OSG is actually a deferring rendering system based on the theory of scene graph, which records rendering commands and data in buffers, for a posterior rendering (Policarpo & Fonseca, 2005). This fact permits the system to perform several optimizations before rendering, as well as implementing a multithreading strategy for handling complex scenes (Wang & Quian, OpenSceneGraph, 2010).
A scene graph is a tree data structure that defines both a spatial and logical relationship of a graphical scene, for efficient management and rendering of graphic data (Guangwei & Zhitao, 2009). It is typically represented as a hierarchical graph, which contains a collection of graphic nodes including a top-level root node. A typical scene graph does
not allow a directed cycle —where some nodes are connected in a closed chain— or an
isolated element —a node that has no child or parent— inside itself.
Consequently, the use of scene graphs, and particularly the use of OSG, fits completely in the accomplishment of this project, not only for the current project development, but also for forthcoming releases. Expressly for the aim of this project, OSG perfectly fits in rendering big amount of buildings in real-time, which is actually a crucial part of this research.
This research focuses on an innovative way of building’s attribute representation based
~ 5 ~
also on the analysis of 3D buildings locations in which this research has given solution.
Consequently, the estimated building’s energy consumption and corresponding
emissions to the atmosphere are obtained, helping to minimize energetic consumption from a passive point of view.
Both commercial and residential edifications represent nearly a 40% of the world’s
energy consumption and in a similar level of CO2 emissions (Rodriguez, 2010).
Nevertheless, regarding ―Contribution of Working Group III to the Fourth Assessment
Report of The Intergovernmental Panel on Climate Change‖; the mentioned buildings
sector represents the energetic sector with the highest potential in terms of energy reduction —estimation of 29% for 2020—(Barker T., 2007). Additionally, it is cited that is possible to achieve a 75% of energy savings, in individual new buildings compared with recent current practice, and generally at little or no extra cost (Barker T., 2007).
Such achievement requires the adoption of additional methodologies and technologies. The cited report enumerates the main ones, pointing out that the most energy saving occurs in new edifications. Among the cited technologies, it is stated in the first place the importance of a passive solar energy production as a technology with a highest applicability nowadays. According to that, this research will notably help on the analysis of solar incidence, implementing the representation stage of a building energetic demand processing.
1.2 Hypothesis
The development of a WebGL-based building’s visualization application will provide a
new Web-based geo-processing platform publicly accessible; creating a new GIS processing architecture based on a Web browser interactivity, interoperability and improved graphical performance.
1.3 Objectives and Limitations
Considering the mentioned background, and based on the hypothesis, this research is going to focus on the way to integrate and visualize 3D buildings coming from cadastre and FIDE data, into a WebGL-based globe.
~ 6 ~
To study in-depth the adopted Earth globe solution based on the WebGL standard.
To use public cadastre data of the city of Valencia (Spain) provided by Spanish Authorities.
To study, understand and use WebGL standard, based on OpenGL ES 2.0, for low-level instructions accessing.
To study, understand and use GLSL as graphical language.
To study, understand and use JavaScript language.
To study, understand and use OSG and OSG Earth framework based on scene graph representations.
To study, understand and use HTML and CSS as supporting languages for the suitable Web content visualization.
To study, understand and use WMS and TMS protocols for request tiles to the correspondent servers.
To propose a model to prepare, analyze and filter the data coming from the Spanish cadastre.
To propose a model to represent 3D buildings derived from 2D geo-data, on the surface of a WebGL-based virtual globe.
To represent not only the buildings’ geometry but any interesting parameter present or not present on the treated data.
To develop a fully functional Web application prototype for both testing and representing the buildings present in obtained cadastre data.
To develop a complete solution for representing the FIDE buildings’ models in
the same way as done for cadastre data (See Appendix B).
GIS data representation and the consequent end-user interaction, is a large topic itself that has many issues to be considered. However, mainly due to the time reasons, many of these issues are not included into this research scope. Following, it is presented some of the limitations considered towards this research:
This research does not intend to develop a complete GIS system, but an implementation of geo-data representation in a WebGL-compliant way.
~ 7 ~
establishes the way to represent any kind of results originated in third geo-processing, in a WebGL environment.
This research focuses on using already implemented scene navigation functionalities, instead of developing new ones besides the firstly mentioned.
1.4 Dissertation Organization
The structure of this research consists of six major chapters which are distributed as
Introduction, State Of The Art, Analysis, Design and Implementation, Results and
finally Conclusions. Additionally, it has been included Appendix A and Appendix B to
this research.
Introduction chapter reviews current and forthcoming technologies intrinsically related
with foreseeable use trends, in addition to the reasons and objectives of this research.
Straight after, State Of The Art chapter introduces current WebGL-based globes and a
group of available JavaScript-based libraries that may give support to WebGL-based GIS developments.
Analysis chapter provides the technical reasoning about the application’s requirements
and processing the system needs to accomplish, as well as the temporal-economical
planning. Design and Implementation chapter explains in-depth, the implemented
solution making extensive use of graphical contents in order for the reader to clear
understand it. Additionally, it is further divided in Data Preparation and Data
Visualization sections, in consequence of relying on different used and implemented
applications.
Results chapter describes in detail the obtained application’s outputs, giving solutions to
the hypothesis and research’s objectives posed in this Introduction chapter. Finally
Conclusions chapter presents the general achievements of the research. It summaries the
contributions in knowledge provided by the research and suggests future directions and recommendations for the developed system.
Additionally, Appendix A describes the resulting outputs coming from different tested
configurations. And finally, Appendix B describes the entire FIDE approach which
~ 8 ~
1.5 Chapter Review
This chapter begins with a brief background strengthening the importance of WebGL graphic standard and based applications, followed by the importance of Web-based geo-processes. Finally, explains that the background behind this research is the processing of precise buildings energetic demand, relying on the buildings geo-location.
Additionally it describes a set of research’s objectives, concluding with a section on the
~ 9 ~
Chapter 2
State Of The Art
2.1 Introduction
General purpose Web applications, and more specifically GIS Web applications, have become more important around the world due to the existence of an interesting and useful geographical component. This is attached in some way to most of the data that an end-user either directly or indirectly deals with.
The recent appearance of HTML5 and WebGL standards, provide a wide range of new possibilities and market researches in mainly all sectors and areas, including GIS as this research does (Taivalsaari & Mikkonen, The Web as an Application Platform: The Saga Continues, 2011).
There are several applications where the ability to capture, display, and visualize 3D images comfortably would confer real benefits. Examples from the professional domain include CAD design, medical diagnostics, scientific-purpose visualization, and GIS visualization methods.
In the long term, the third dimension provides a better comprehension and modelling of the world around us, adding both an extra modern looking and an ability to represent specific parameters such as building or terrain elevations, which cannot be visualized from a conventional top-down view.
As GIS concepts are getting accepted and assimilated by the society, more Web applications are released, describing in many cases fully operational 3D globes. Until now, the only way to achieve such 3D representation, was implementing a Web application relying on the private-source Google Earth API, which as usual, required a plugin installation as a browser extension.
~ 10 ~
framework. That is one of the reasons why some other solutions are increasingly appearing. The principal aim of most of the appearing Software Development Kits (SDK), is simply to provide an alternative solution, implemented mostly in JavaScript to be available in all WebGL-compliant browsers within open source environments.
Nevertheless, since WebGL is a rather recent standard specification, there is a little research found, encountering no fully complete solution done so far. However, due to market needs, trends, and technologies progressing, some WebGL globes are timidly appearing to date.
Each of selected and following presented WebGL globes adopts different structure and design, letting either an end-user or software developer to choose the one which fits the most his requirements, likings or purposes.
The encountered solutions are further divided into two separated groups in order to
clarify the State Of The Art of this research. The first part, 3D Map Toolkits, concerns
Map Toolkits and their particular characteristics, detailing as well some other 3D related tools available on the Web, 3D on the Web. The second part, JavaScript 3D Render
Engine Frameworks, mentions and details the main 3D JavaScript libraries existent on
the market, regarding special attention on the library selected in this research.
2.2 3D Map Toolkits
2.2.1
ReadyMap
(Pelican Mapping, 2011)
~ 11 ~
ReadyMap globe has been developed under GNU LGPL license, by Pelican Mapping, a company settled in Fairfax, (USA). ReadyMap is a complete suite of tools for publishing and viewing maps in 2D and 3D, designed for desktop, mobile and Web environments. This last one is where WebGL SDK takes place.
ReadyMap WebGL SDK is a free JavaScript library that can be used to embed maps in a web page. It supports both 2D and 3D global maps, letting the user to geo-locate any
kind of event on the map —GeoRSS or Flickr i.e.—, as well as manipulate the data and
the on-screen camera perspective. Additionally it works well with open Web-mapping standards like TMS (Tile Map Service) and WMS (OGC Web Map Service), leveraging WebGL technology in order to render high-performance 3D maps.
The toolkit is built over OpenSceneGraph (OSG) library (OSG, 2012) (see Figure 2). OSG is an open source high performance 3D graphics toolkit, used by several
applications’ developers in fields so varied as visual simulation, games, virtual reality,
scientific visualization, modelling and GIS.
Detailed next, it is presented a general schema of the ReadyMap structure.
OSG relies on the scene graph groundings. A scene graph is a tree data structure that defines the spatial and logical relationship of a graphical scene, for efficient management and rendering of graphic data. It is typically represented as a hierarchical graph, which contains a collection of graphic nodes; including a top-level root node, and a number of group nodes that serve together as the bottom layer of the tree. Additionally, each group node may have any number of children. Thus, these children nodes gather the information of their parent and can treated therefore as one independent unit.
OSGEarth
OSGJS + jQuery
WebGL
~ 12 ~
OSG is written entirely in Standard C++ and OpenGL, running on a wide range of operating systems including Windows, OSX, GNU/Linux and Solaris
Due to OSG widespread, and also to both market research and trends, OSG has been
gradually migrated to JavaScript being renamed ―OSGJS‖. OSGJS is a WebGL
framework based on OSG groundings, which makes possible firstly, to use an
―OpenSceneGraph-like‖ toolbox which interacts with OpenGL via JavaScript calls, and
secondly to export data models to the OSGJS format (OSGJS, 2012). Additionally, on top of OSGJS, ReadyMap makes extensive use of OSGEarth.
OSGEarth is a C++ terrain rendering toolkit that supports several kinds of data providing visualization and manipulation functionalities in many different ways. Concurrently as OSG, OSGEarth has been gradually ported to JavaScript as well, getting fully integrated into ReadyMap solution (OSGEarth, 2012).
Both, library and toolkit are fully merged with jQuery, the third component that ReadyMap relies on. jQuery is a JavaScript library that provides to ReadyMap a full-HTML-element processing binding ReadyMap objects to HTML5 tag elements.
2.2.2
WebGL Earth
(Klokan Technologies, 2011)
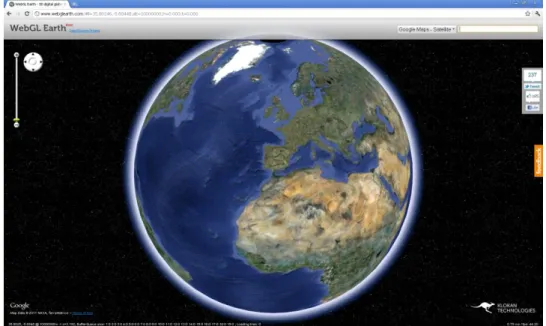
Figure 3. WebGL Earth globe’s appearance
~ 13 ~
visualization of maps, satellite imagery and aerial photography on top of a virtual terrain using WebGL standard specification similarly as ReadyMap.
WebGL Earth provides some camera-dependent functionalities like rotation, zooming, or tilting which notably increases the user interactivity. Additionally it provides map
visualization capabilities making the display of existing map solutions —
OpenStreetMap and Bing i.e. — possible. Additionally, it is implemented a full support
to custom Earth’s map tiles loading. It also includes marker addition capabilities and viewpoint animation likewise the rest of solutions.
WebGL Earth is prepared to be used on third party websites in a very easy way, since developers have two options on how to use the source code for custom Web applications. On the one hand, it is possible to use the API so as to obtain a full customized application, alternatively on the other hand, it can be used the codebase with an aim of inserting a simple default map into a desired Web page.
In order to get ready to use WebGL Earth’s SDK it is compulsory a prior setup of a Python Interpreter and Java Virtual Machine in order to successfully compile WebGL Earth source code, as well as the latest Closure Library.
2.2.3
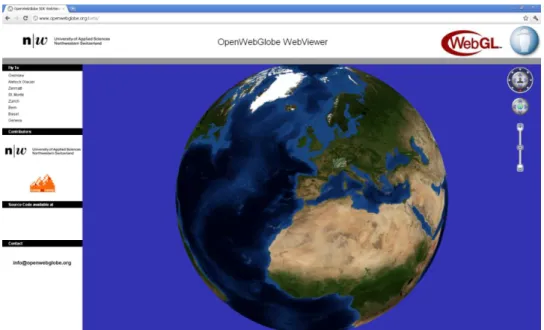
OpenWebGlobe
(Geomatics Engineering departement at the University of Applied Sciences Northwestern Switzerland, 2011)
~ 14 ~
OpenWebGlobe has been created under MIT license by the Geomatics Engineering department at the University of Applied Sciences North-western Switzerland, settled in Basel, Switzerland.
OpenWebGlobe SDK is designed in an object oriented manner. The SDK is written entirely in C++ and has bindings to other languages like Python, C# and Visual Basic or JavaScript.
The solution the Geomatics Engineering department offers consists of, a WebGL globe that encompasses the software for processing very large volumes of geospatial data, in highly parallel and scalable computing environments. Additionally, it provides support for several data categories such as image data, elevation data, point of interest, vector data, and 3D objects.
Before streaming over the Internet, this data must be pre-processed, usually by comprising a transformation from a local to a global reference system, creating a set of pyramid layers, setting up levels of detail or tiling the data.
The latest released version to date is essentially a beta version with some of the functionalities spread out over the code not considered as a full complete solution.
2.3 3D on the Web
2.3.1
Google WebGLGlobe
~ 15 ~
In this section, the principal globe for data representation purposes based on WebGL is Google WebGL globe, within Chrome experiments framework.
WebGL Globe is an open platform for strictly geographic data visualization, created by the Google Data Arts Team, having as main features Latitude / longitude data spikes, colour gradients based on data value or type, and mouse panning and zooming functionalities.
In terms of technological dependence, WebGL Globe is based on both Three.js
JavaScript 3D render engine, and ―requestAnimationFrame.js‖ JavaScript file.
On top of the mention dependence, both JSON-described data and JavaScript-based shader files are loaded by the application, providing the globe the necessary data and the
way the graphic card behaves to finally represent the processed data (Google, 2011).
Unlike previous mentioned Web applications, Chrome experiments, and WebGL globe involves a controversial terms of use, where by uploading code, the developer
acknowledges and agrees that Google, or Google’s licensors, own all legal right,
including any intellectual property rights which subsist in the services (Google, 2012).
2.3.2
PhiloGL
Figure 6. PhiloGL globe's appearance
~ 16 ~
creative coding and game development. PhiloGL code is highly abbreviated compared to low level WebGL specification. This helps the users to build simple applications in a
very little time only for data representation purposes(Sencha Labs, 2011).
2.4 WebGL Globes Comparison
Next, it is detailed a comparison’s table between the main functionalities present in the
variety of explained WebGL globes’ solutions, followed by an explanation of each of introduced terms.
ReadyMap WebGL
Earth OpenWebGlobe
WebGLGlobe PhiloGL
Viewer Functionality
WebGL
compatibility Yes Yes Yes Yes Yes
Navigation
Zoom In / Out Yes Yes Yes Yes yes
Zoom Area No No No No No
Zoom Full
Extent Yes No No No no
Zoom
Predefined Yes No No No no
Zoom Layer Extent, Next, Previous, Selected, X/Y
No No No No No
Bookmarks Yes Yes No No no
Tilt Yes Yes Yes No No
Pan Yes Yes Yes Yes Yes
Data
Add Local
Layer No No No No No
Add WMS Yes Yes N/A No No
Add TMS Yes Yes Yes No No
JSON Yes Yes Yes Yes Yes
Other Data Formats
Yes
(OSGJS) No No
Yes
(COLLADA) No
Selection
~ 17 ~
Measuring
Distance No No No No No
Area No No No No No
Angle No No No No No
Coordinate
display Yes Yes No No No
Display Units yes Yes No No No
Querying
View Attributes Yes Yes Yes Yes Yes
Find Address Yes Yes No No No
Find Feature No No No No No
Locate Feature
by Query No No No No Yes
Create Custom
Query No No No No No
Terms of Use
License GNU
LGPL
GNU
GPLv3 MIT
Owns all legal
rights MIT
Table 1. WebGL globes’ comparison table
Navigation
Zoom In / Out: zooms in and out to a specified centre point by a predefined
magnification factor.
Zoom Area: zooms in to a specified rectangular area extent.
Zoom Full Extent: redraws so that the full extents of the map are displayed in the
current window.
Zoom Predefined: redraws so that a particular preselected zoom is applied.
Zoom Layer Extent, Next, Previous, Selected, X/Y: additional zoom operations.
Bookmarks: adds a bookmark to save the place with its particular coordinates.
Tilt: moves the map so that the normal to user’s view perspective is changed.
Pan: moves the map around the map window in order to display areas that are
outside of the current view extent, without changing magnification, just by
dragging or by specifying a new view’s centre point.
Data
Add Local Layer: adds a new layer to the map from the local machine or
network.
Add WMS: Web Map Service support.
Add TMS: Tile Map Service support.
~ 18 ~
Other Formats: availability of other data exchange formats.
Selection
Picking: selects a feature on-map based on geographic coordinates, relying upon
screen coordinates selection.
Measuring
Distance: measures a polyline (segments and total distance) drew by the user.
Area: measures a polygon drawn by the user.
Angle: measures an angle drawn by the user.
Coordinate Display: displays X - Y coordinates of a specified point or points.
Display Units: specifies units for displaying screen cursor position (e.g.
Lat/Long or Projected).
Querying
View Attributes: displays attribute data (from database) for a selected feature.
Find Address: zooms to a location based on street address matching.
Find Feature: zooms to a feature with a database attribute value matching a
user-specified value.
Locate Feature by Query: zooms to a feature with a database attributes matching
a predefined query.
Create Custom Query: builds database query to find features matching
user-specified criteria.
Terms of Use
License: concerns the terms for each of the Web applications.
2.5 JavaScript 3D Render Engine Frameworks
In this section it is explained the State Of The Art regarding to WebGL-based JavaScript libraries. Considering that many of the following JavaScript libraries are very recent releases, and the majority are still under early development, in many cases the information they have provided has been sparse or even inexistent.
~ 19 ~
2.5.1
OSGJS
OpenSceneGraph-JavaScript (OSGJS) is a library for modelling scenes as graphs. It attempts to transport the C++ based OpenSceneGraph functionality to JavaScript. Nevertheless, the support is incomplete. This can lead to difficulties in implementation when developers port code utilizing this library from C++ to JavaScript (OSGJS, 2012).
2.5.2
PhiloGL
PhiloGL is a JavaScript WebGL-based framework which tries to be as close to low level OpenGL instructions as possible, providing a yet tight abstraction to WebGL, focusing particularly on performance. PhiloGL also provides a module system covering Program and Shader management, JSON support, Web Worker management, Effects and Tweening (Garcia Belmonte, 2011).
2.5.3
SceneJS
SceneJS is a WebGL-based 3D engine geared towards the rendering of large numbers of individually pickable and articulated objects as required for engineering and data visualization applications.
On the inside, SceneJS is a fast draw list that is optimized for things like fast redraw and picking, while on the outside it is a convenient JSON-based scene graph API, that is easy to hook into the rest of the application stack (Kay, 2009).
SceneJS is a lean rendering kernel which omits functionality such as physics and visibility culling. However, its leanness makes it very efficient to update the scene state, making it practical to bolt on your choice of third-party toolkits such as TweenJS, JSBullet and jsBVH.
2.5.4
Three.js
Three.js is a lightweight 3D engine with a very low level of abstraction. Currently the
~ 20 ~
2.5.5
SpiderGL
SpiderGL is a JavaScript 3D graphics library which relies on WebGL for real-time rendering. The philosophy behind SpiderGL use, is to provide typical structures and algorithms for real-time 3D graphics rendering to Web developers, neither forcing them
to comply with some specific paradigm —i.e. scene graphs— nor preventing low level
access to WebGL (Visual Computing Laboratory at CNR Research Area of Pisa, 2012).
2.5.6
C3DL
The Canvas 3D JS Library (C3DL) is a JavaScript library that makes possible for software developers to write 3D applications relying on WebGL specification. It provides a set of math, scene, and 3D object classes, that makes WebGL more accessible, implementing the access to low level WebGL instructions (CATGames Research network at Seneca College, 2010).
2.5.7
CopperLicht
CopperLicht is a JavaScript 3D engine for game’s design purposes ultimately focused to
Web browser environments. CopperLicht includes a 3D world editor supporting the major 3D file formats as 3ds, obj or lwo for instance. Considering license terms, CopperLicht is free to use excepting for commercial purposes (Ambiera, 2010).
2.5.8
CubicVR
CubicVR is a lightweight, high-performance and implicit WebGL engine with a versatile collection of built-in features for quick implementations, providing functionality from a low-level use to full managed scenes and events with physics. It includes support for COLLADA format in both XML and JSON format; additionally it imports a variety of 3D models, animations and asset libraries (Cliffe, 2011).
2.5.9
GammaJS
~ 21 ~
2.5.10
GLGE
GLGE is a JavaScript library which wraps low level instructions into predefined instruction, easing the designing and developing of 3D content (Brunt, 2010).
2.5.11
Jax
Jax is a JavaScript development toolkit, which provides a wide range of functionalities,
from code’s generators to test suites designed specifically for WebGL applications
development. It also provides support for both low-level WebGL instructions and JavaScript user interface interactivity, such as keyboard input or mouse handling (Jax, 2012).
2.5.12
O3D
O3D is a JavaScript API for creating Web applications in the browser. Originally built by Google as a browser plug-in (deprecated nowadays), this new implementation of O3D has been converted into a JavaScript library implemented on top of WebGL. Additionally, O3D provides a sample COLLADA converter, which can be used to both import files in the COLLADA format and write converters for other formats (Google, 2011).
2.5.13
Oak3D
Oak3D is a JavaScript framework for 3D graphics development based on
WebGL standard. It is focused on optimizing the graphic 3D Web application’s
performance with GPU acceleration as the rest of mentioned libraries. Oak3D provides a set of simple and easy-to-use API interface which makes possible to software developers to implement 3D Web-based applications without considering the details that any low-level 3D graphics implementation entails (Oak3D, 2012).
2.5.14
X3DOM
~ 22 ~
2.5.15
Inka3D
Inka3D is an export plugin for Autodesk Maya. A wide range of features is supported including driven keys, shading networks, lighting and skinning, adding extra
functionality to the scene’s geometry. Moreover, all exported Maya parameters such as
positions, rotations, scales, colours or even user defined extra attributes can be controlled using JavaScript (Inka3D, 2012).
2.5.16
KickJS
KickJS is an open source WebGL-based game engine built for modern web browsers such as the most recent version of Chrome and Firefox. KickJS provides a game oriented abstraction of WebGL, and makes game programming simpler and more accessible (KickJS, 2012).
2.6 Reasons for ReadyMap Choice
At this point, it is important to clarify that all the introduced solutions have been under early development by the time of this research, so that it has not been an easy task to choose one solution among many, also considering the amount and kind of similarities.
Nevertheless, relying on scene graphs concept has finally carried more weight since it has been considered a turning point for future releases, based on an increasing scene complexity (Wang & Quian, Why OSG?, 2010). Consequently, ReadyMap solution has been finally chosen mainly relying on:
Improved performance: A set of scene graph techniques are already implemented in OSGJS, including view-frustum or occlusion culling besides a complete encapsulation of WebGL extensions and Graphics Library Shading Language (GLSL). Being able to treat the whole scene as a tree turns out into a great advantage since both parent and children hierarchical management is possible, optimizing costly graphical operations and WebGL changes of state.
~ 23 ~
has had previous experience with jQuery, carrying more weight this option among many.
Active community: An active ReadyMap developer community makes possible to use the latest released functionalities as well as resolving eventual difficulties that may appear while implementing customized applications.
License: Since it is an open source application, users and companies do not have to worry about software patent violations when using ReadyMap. This particular feature is also present in the majority of introduced solutions.
GIS capabilities: It is expected a gradually migration of all the well-known OSGEarth functionalities to ReadyMap SDK. So far, GIS functions and transformations have been extensively implemented, nevertheless, a full migration would let ReadyMap gain more GIS support, defining a wide range of new geo-processing for client-side and server-side.
2.7 Chapter Review
~ 25 ~
Chapter 3
Analysis
3.1 Introduction
In this chapter it is presented the analysis process accomplished at the beginning of this research, in order to establish which are the competences, features and functionalities that ReadyMap-based buildings’ application has to provide to end-users. This section
firstly describes application’s requirements with regards to hardware, software and used data; straight after, it presents the corresponding use case model, followed by the high
level architecture diagram where overall applications’ dependences are featured.
Additionally, it is presented the Gantt diagram and the research’s budget diagrams,
describing major and minor terms with regard to both time development and cost parameters.
3.2 Requirements
3.2.1
Introduction
For the correct development of this research, it has been necessary to satisfy the series of requirements following explained in this chapter. These requirements have mainly
involved data and hardware-software user’s configuration.
Additionally, it has been described in-depth the configuration set on the tested unit, in order to for the reader to help reproducing the testing environment, just in case it might be interesting.
3.2.2
Data acquisition
Considering that the case study has been located in the Valencian community, it has been necessary to obtain from the Spanish cadastre, the corresponding dataset with the
area extent that fitted research’s purposes. This data have been described as the cadastre
~ 26 ~
Considering that it was expected a huge amount of information present in the obtained dataset, it has been required to pre-process the data before represent it on-screen. Pre-processing has implicated the retrieving of necessary attributes for forthcoming processing.
Post-processed data must be stored in the server-side, and defined in an easy-well understood file format that a browser could recognize and later process. Thus, it has been expected that the browser once had retrieved the corresponding data from the server, it had internally converted it into JavaScript-based objects that the Web application could understand.
Application’s user interface must provide the following set of functionalities:
Render of ReadyMap WebGL globe within a 3D context view, embedded into a
Canvas HTML5 element.
User’s interface must display several instances of buildings on the globe’s
surface in sync.
Data retrieved from the server-side must be loaded in an asynchronous way in the client-side, aiming to provide real-time dynamism to the Web application.
The data necessarily must be loaded and processed in a reasonable time considering the volume of data that Web application has to manage.
ReadyMap WebGL globe’s interface must provide pan, zoom, rotation and tilt
as minimum movements’ requirements for a correct scene exploration.
Additionally, it has been expected some kind of helper —HTML element i.e. —,
which would have let the end-user to move the camera-based perspective towards any present area or point of interest.
Concerning source code, it has been highly important to reuse as much source code as possible, avoiding reimplementation and redesigning, therefore making the Web application as light and clear as possible.
3.2.3
Data requirements
With respect to cadastre data volume, likely to be recorded in Shapefile (SHP) format, it has been necessary to adopt a lightweight data exchange format conversion where to
store the attributes and values coming from both topologic and semantic buildings’
~ 27 ~
Considering that this research has taken place in a Web environment, JavaScript Object Notation (JSON) has been the most suitable data exchange format for previously mentioned purpose, being much easier to load, read, parse and manipulate than Extensive Markup Language (XML) for instance. In view of JSON format is faster (Wang G. , 2011) and more convenient than XML (Azad, 2007), it has been adopted as exchange data format.
3.2.4
Software and hardware requirements
WebGL has not been designed to work on equipments based on antiquated graphic
cards, so that ultimately both user’s hardware and software configuration will determine
whether the Web application will properly run or not.
Lately, graphic cards builders have realized about the importance of WebGL, and the new forthcoming range of market possibilities, so that graphic card drivers have begun to be updated in order to handle, if possible, the new graphic standard. For that reason, at last instance is user’s responsibility to keep graphic card’s drivers updated in order to properly visualize WebGL-based content.
Additionally, browser’s choice will directly determine the way the Web application will
render graphics on-screen. In order to provide the best user experience, some particular
browsers —Google Chrome or Mozilla Firefox i.e.— are able to selectively enable or
disable customized WebGL implementation support within its internal configuration. This has a clear aim to make new WebGL-based prototypical applications as compatible
and trustworthy to developer’s designs as possible. Furthermore, Khronos Group
provides a real WebGL State of The Art with regard to browser graphic support (Khronos Group, 2011).
Next, it is detailed in the following Test unit’s hardware and Test unit’s software
sections, the tested unit’s configuration used along the development of this research.
3.2.4.1
Tested
unit’s h
ardware
Regarding the hardware’s configuration present in tested unit, it is described as
following.
Dell Vostro 1510
~ 28 ~ NVIDIA GeForce 8400M GS
Driver version 6.14.12.6658
3.2.4.2
Tested
unit’s s
oftware
Regarding the software’s configuration present in tested unit, it is described as
following.
Windows XP Professional SP3 Notepad++ v9.5.4
Apache HTTP Server 2.2 PHP 5.3.8.0
Quantum GIS 1.7.2 gvSIG 1.11
Google Chrome v16.0.912.63 m (WebGL: Hardware accelerated) Mozilla Firefox v9.0.1 (WebGL: Hardware accelerated)
Opera v11.60 (not compatible with WebGL)
Safari v5.1.2 (7534.52.7) (not compatible with WebGL) Internet Explorer v7.0.5730.13 (not compatible with WebGL)
3.3 Use Case Model
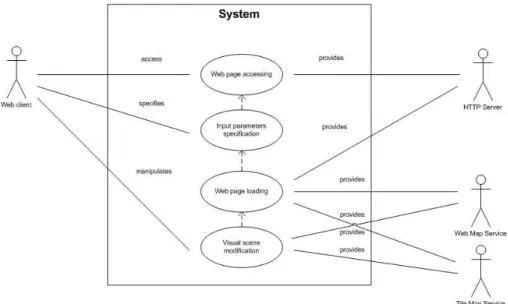
The Use Case model is a collection of diagrams and text that together document how users expect to interact with the system. Based on (A. Pender, 2002) , next figure depicts system’s behaviour, highlighting who have been the actors within the system and which have been their goals, also showing the dependencies between elements.
Figure 7. Web application's use case diagram
~ 29 ~ Regarding actors, they have been depicted as next:
Web Client: Web Client has been defined as the end-user of the Web application
designed along this research. All processes have started due to the triggering action of this actor. It has been the responsible of accessing to the Web application, specifying input parameters and modifying visual parameters by exploring the scene.
HTTP Server:This actor has been characterized along this project as an Apache
HTTP local server mainly used for testing purposes. It is expected, in a close future, to further develop the Web application relying on remote server architecture. Additionally, HTTP server actor has been the responsible of providing, straight after a Web client request, the corresponding HTML file in
addition to the associated files —such as CSS and JavaScript ones— which has
provided full functionality and embellishment to the Web application. Furthermore, HTTP server is in charge of sending to Web client the JSON file
with the building’s geometries.
Web Map Service (WMS): Web Map Service actor has been the responsible of
serving to the Web client, georeferenced map images over the Internet. Such images have been previously generated by a map server, and ultimately gathered from the corresponding geospatial database. Along this present research this actor will be shaped as PNOA WMS.
Tile Map Service (TMS): Tile Map Service actor has been the responsible of
serving to the Web client, georeferenced map tiles over the Internet. Those tiles have been previously generated by a map server which ultimately gathered data from the corresponding geospatial database. Along this present research this actor will be defined as ReadyMap TMS, serving both Landsat 7 ETM and OpenStreetMaps imagery.
Regarding use cases, there have been depicted the following:
Web page accessing: The end-user would request to HTTP server, a single
~ 30 ~
specify the set of input parameters that would determine the Web application’s
behaviour.
Input parameters specification: This particular use case has been exclusive for
the end-user. Depending on the input, the application would behave in some different ways. The end-user would specify the desired WebGL rendering mode, a thematic colour visualization, and the desired number of children to add to the scene graph for testing purposes.
Web page loading: At this point, the servers would provide to the Web
application the requested data accordingly to the visual map extents. HTTP server would provide a pre-processed JSON file where the buildings topology and semantics would be defined. WMS server would provide the corresponding PNOA imagery, rather the same as TMS server which would provide the corresponding tiles of both Landsat and OSM sources.
Visual scene modification: Finally, the end-user, once all the input data would
have been loaded, processed and represented on-screen, would be able to explore and visualize the scene.
3.4 High Level Architecture
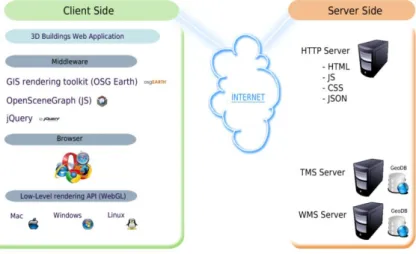
In this section it is described the high-level application’s architecture diagram, so as to
have a better understanding of the necessary components used on the development of this research. Next, it is presented the general schema:
~ 31 ~
As seen, the communication schema has been divided in two principal parts: client-side and server-side. It should be noted that, even if it has been depicted that HTTP server is
located on the server side (see Figure 8), client’s side software and HTTP Server have
been actually located and executed on the same local machine for testing purposes,
while rest of server types —TMS and WMS— have been located in a remote location.
Additionally it has been planned a migration of HTTP server, from local to remote a
location when this research’s work would have completely finished, being therefore accessible to general public.
Client-side has been responsible of the user’s interface presentation which has been expected to be a simple and clear interface, where it was going to be required that the end-user would fulfil a set of application parameters to manage Web application behaviour.
The main tool that the end-user would need to have installed in advance on his machine would be a Web browser. Unfortunately, not all range of browsers on market have been
WebGL standard compliant to date; nevertheless, it is expected that browser’s
architecture will provide sooner or later a complete WebGL standardization, no matter which operating system the end-user would use.
Once the end-user had accessed the Web application, a series of compiled JavaScript
files would be downloaded into de Web browser, which is actually the middleware’s
implementation. Middleware is computer software that connects software components trying to increase interoperability between systems with different architectures, simplifying therefore complex distributed applications (Verissimo & Rodrigues, 2001). In the context of this research, using middleware has been a crucial step to integrate and manage information coming from both graphical (OSG) and geographical (OSGEarth) sources.
In addition to the use of OSG and OSGEarth, it has been necessary to include jQuery JavaScript library in order to simplify HTML document traversing, event handling and
AJAX requests. On top of this structure the buildings’ Web application —that is
~ 32 ~
Server-side is something out of the boundaries of this research, yet it has been be explained along this document due to the existing interrelation between the server-side and the client-side.
As mentioned, HTML server has run on a local machine during implementation and testing time, which is expected to be ported to a remote location once the Web application had finished. When referring to HTML server, it is referred in fact to a combination of Apache HTTP server and PHP, which is in fact the responsible of resolving the requests for corresponding set of tiles.
Thus, HTTP server has provided HTML, JSON, CSS and JavaScript files to the Web application requested via the corresponding AJAX requests from the client-side. Due to browser security restrictions, most AJAX requests are subject to the same origin policy, so that the request cannot successfully retrieve data from a different domain, sub domain, or protocol. For this reason, it has been used a local HTTP server which has solved such issues, besides to provide access to the Web application to external computers connected to the same network. Alternatively, it is possible to solve the
mentioned origin policy issue by halting full browser’s security processing —accessing
to the deep internal configuration—, yet this is a discouraged solution due to both security and back-door reasons.
WMS and TMS servers have been neither designed nor implemented at all, nevertheless both would be accessed when the Web application would request the corresponding set
of tiles and map imagery so as to place them on top of the globe’s surface.
3.5 Planning (Gantt diagram)
~ 33 ~
Table 2. Gantt diagram
Project management: it has concerned all generalized assignments derived from
the project’s planning.
Documentation and Testing: it has concerned documentation’s labours such as
reference books and thematic articles readings so as to define solid groundings
for the rest of project’s stages. Within this Documentation and Testing stage, it
has been settled the basics of later used programming languages, being expected general improvements on programming skills at this point. A special effort has been given at learning JavaScript programming language considering that most
of this research’s functionalities are based on such language. Additionally both