Haul-outs
Pavanato, H.
a,*, Silva, KG.
b, Estima, SC.
b, Monteiro, DS.
band Kinas, PG.
ca
Pós-Graduação Oceanografia Biológica, Instituto de Oceanografia, Universidade Federal do Rio Grande, km 8, Carreiros, CEP 96201-900, Rio Grande, RS, Brazil
bNúcleo de Educação e Monitoramento Ambiental, CEP 96207-480, Rio Grande, RS, Brazil c
Grupo de Pesquisa em Estatística Ambiental, Instituto de Matemática, Estatística e Física, Universidade Federal do Rio Grande, km 8, Carreiros, CEP 96201-900, Rio Grande, RS, Brazil
*e-mail: heloisepavanato@gmail.com
Received July 31, 2012 - Accepted November 7, 2012 - Distributed November 29, 2013 (With 5 figures)
Abstract
Along the Brazilian coast only two haul-outs of South American sea lions (Otaria flavescens) are known: Ilha dos
Lobos and Molhe Leste, both located in the southernmost state of Brazil, Rio Grande do Sul. Most sea lions observed in these haul-outs are adult and sub-adult males. It is supposed that the species’ presence in these areas is due to food supply and absence of parental assistance by males. This study analysed the use of these haul-outs byO. flavescens
between 1993 and 2002 based on counting data of observed individuals. Bayesian generalised linear mixed models were used to evaluate differences in abundance between areas, long term trends and seasonal patterns. Results showed that forO. flavescensabundance had a long term trend of increased average occupancy over the study pe-riod, with seasonal variation reaching the highest within-year value in August (Ilha dos Lobos) and October (Molhe Leste). The novel application of this powerful statistical modelling approach resulted in a useful tool to quantify oc-cupancy dynamic.
Keywords: Otaria flavescens, Bayesian generalised linear mixed models, covariates, abundance.
Dinâmica de Ocupação do Leão-Marinho-do-Sul no Brasil
Resumo
Ao longo da costa do Brasil apenas duas colônias não-reprodutivas de leões-marinhos-do-sul (Otaria flavescens) são conhecidas: Ilha dos Lobos e Molhe Leste, ambas localizadas no estado do Rio Grande do Sul. A maioria dos leões-marinhos observados nestas colônias são machos adultos e sub-adultos. Supõe-se que a presença da espécie nestas áreas está relacionada ao forrageamento e a ausência de cuidado parental pelos machos. Este estudo analisou a dinâmica de ocupação e abundância deO. flavescensnas colônias não-reprodutivas entre 1993 e 2002, baseado em
uma série temporal de dados de contagens de indivíduos. Modelos lineares generalizados mistos Bayesianos foram usados para avaliar diferença na abundância entre áreas, tendência de uso em longo prazo e padrões sazonais. Os resultados mostram que a abundância deO. flavescensvariou sazonalmente, atingindo pico intra-anual em agosto (Ilha dos Lobos) e outubro (Molhe Leste), acompanhado de um aumento da ocupação média dos refúgios ao longo do período de estudo. A nova aplicação desta poderosa forma de modelagem estatística mostrou-se útil para quantificar a dinâmica de ocupação.
Palavras-chave: Otaria flavescens, modelos lineares generalizados mistos Bayesianos, covariáveis, abundância.
1. Introduction
South American sea lionsOtaria flavescens(Shaw,
1800) are widely distributed, occurring along approxi-mately 10,000 km of the South American Atlantic and Pacific coasts from Torres (Brazil) (Vaz-Ferreira, 1981) to Cape Horn (Chile) and from Cape Horn to Zorritos (Peru) (Cappozzo, 2002). The species’ distribution is characterised by features which allow breeding and
for-aging activities, such as solid substrate and food availability (Bowen et al., 2009; Cappozzo and Perrin, 2009).
and Puerto Quequén (Westergaard et al., 1979) where they form stable colonies. In these haul-outs, individuals dwell most part of the year with displacement to rooker-ies only during the breeding season. Mating occurs from December to January with a few births in February. Hence, the breeding dynamics of the species is character-ised by an intra-annual peak (Vaz-Ferreira, 1981; Cam-pagna, 1985).
Similar colonies are also found in two haul-outs on the coast of Rio Grande do Sul state (RS), Brazil: Ilha dos Lobos (29°20’ S, 52°06’ W) and Molhe Leste (32°11’ S, 52°04’ W) (Vaz-Ferreira, 1981; Rosas et al., 1994) (Fig-ure 1). It is presumed that individuals present in these sites come from the rookeries in Uruguay in search of food (Castello and Pinedo, 1977).
Most sea lions found in both areas are adult and sub-adult males (Rosas et al., 1994; Silva, 2002). Adult males, due to the absence of parental care, move away from the rookeries to return in the next breeding season (Rosas et al., 1994). Females divide their time between foraging trips and fasting periods at nursing, therefore presenting more limited movements (Vaz-Ferreira, 1981, Campagna et al., 2001). Preliminary results of Giardino et al. (2009) in a capture-recapture study suggested that males with high site-fidelity to the haul-out of Puerto Quequén in winter developed a particular strategy of mating that kept them connected with rookeries of Uru-guay and Patagonia.
According to Rosas et al. (1994), young individuals have less swimming skills and strength than older ani-mals, which limit their movements to shorter distances
and explain the small number of young animals (£3 years of age) found in southern Brazil during winter months.
After heavy exploitation of sea lions in the first half of the twentieth century, protection measures aiming at population recovery were established. Meanwhile, the abundance of populations in Argentina is increasing (Dans et al., 2004). However, population abundances in the Malvinas Islands and in Uruguay seem to be decreas-ing (Thompson et al., 2005; Páez, 2005). Therefore, a better understanding on population dynamics is impor-tant to design effective conservation strategies.
Based on the possible Uruguayan origin of the sea lions occurring in southern Brazil and the availability of a considerable database of animal counting accumulated over a decade, we analysed the occupancy dynamics and abundance trends ofO. flavescensin both haul-outs of
Rio Grande do Sul, Brazil.
2. Materials and Methods
2.1. Study area and data collection
The coast of Rio Grande do Sul comprises a 618 km long stretch of sandy beach that is interjected only by the Tramandaí River mouth, on the north coast, and by the Patos Lagoon Estuary mouth, on the south coast (Figu-re 1).
The Patos Lagoon Estuary has a 20 km long entrance channel which is fixed by a 4 km long granite dike into the ocean (Seeliger et al., 1997), known as “Molhe Leste (ML)”. The structure which was built to enable a safe navigation also became a suitable resting place for South American sea lions (Rosas et al., 1994). The other site, named “Ilha dos Lobos (IL)”, is the only coastal island of Rio Grande do Sul deriving from the Mesozoic era ba-saltic spill. This island is located 2 km from the beach at Torres and has an area of 1,700 km2comprising a lev-elled ground (Leinz and Amaral, 1966, Vieira, 1984). Both areas are conservation units named “Refúgio da Vida Silvestre” (REVIS) and legally protected by Brazil-ian federal laws.
Between January 1993 and December 2002, 188 sur-veys were conducted comprising both locations. Moni-toring activities consisted of one to four visits per month. Whenever possible, both sites were surveyed the same day and hour. Due to limitations in logistic and financial support, from ten years of monthly data collection, visits to ML and IL were not possible in 12 and 39 months, re-spectively.
In most pinniped populations, one cannot assume that all individuals are available at the time of local count (Buckland and York, 2002). If ignored, this fact will re-sult in underestimation due to availability bias. However, since at ML and IL the maximum number of individuals occurs in the early morning hours, with a decrease during the day to increase again at dawn (Rosas et al., 1994; Sanfelice et al., 1996), all field counts were set for 8:00 am.
Figure 1- Study area: the coastline of Rio Grande do Sul,
Visits to both sites were made by boat, with the ex-ception at ML on days with strong winds from the south-ern quadrant when the animals rested at the dike’s central interspace, less visible from boats. On these occasions visits were made by walking the dike from land. We as-sumed same sighting efficiency for both approaches and used the data without distinction. Animals were counted by naked eye in one path transect with approximate dura-tion of 15 min, simultaneously by two observers to en-sure that animals were neither missed nor double counted. The animals in the water and near to the boat were counted as well.
2.2. Data analysis
We defined as the response variabley[i]= “maximum number individuals observed at a given REVIS in month
i”, (i= 0, 1, 2,...,n), and considered it to follow a Poisson distribution with meanl[i].
We further assumed a linear relation between log (l[i]) and the explanatory variables ‘Site’, ‘Month’, ‘Month2’ and ‘Year’. The only categorical variable ‘Site’ was specified as:
x x i i 0 0 1 0 [ ] [ ] , , = =
for "Molhe Leste" (ML) for "Ilha dos Lobos" (IL)
The other covariates were numerical and, for compu-tational convenience, rescaled to have mean zero and standard deviation equal to one.
The hierarchical structure of the model was as fol-lows:
y i i
i i
i
[ ] ~ ( ) log( ) ~ ( , )
[ [ ] [ ] [ ] [ ] Poisson Normal l
l m s
m =b01]x0[ ] 0[ ](2 1 x0[ ]) 1 1x 2 2x
x i i n n i i i + - + + + +
b b b
b
K
whereb0is the intercept and b1, b2, bnare the coeffi-cients of the explanatory variables.
Since datay[i] may show extra-variation character-ised as an over-dispersed Poisson, we added a random ef-fect with standard deviationsto deal with this situation. Whens= 0 we fall back to a standard General Linear
Model (GLM) or Poisson regression model. Fors> 0 we have a General Linear Mixed Models (GLMM) (Far-away, 2006). Over-dispersion is often addressed by con-sidering only fixed effects (s= 0) but using a negative
binomial distribution fory[i]instead (Kinas et al., 2005). However, the choice taken here is better suited to explore the intended hierarchical model structure (Royle and Dorazio, 2008).
Twelve models with different combinations of ex-planatory variables, including interaction terms between ‘Month’ or ‘Month2’ with ‘Site’, and with or without ran-dom effect were fitted to the data. Model parameters were estimated through Bayesian analysis (Gelman et al., 1995) using Markov chain Monte Carlo (MCMC) algo-rithms to obtain the posterior distribution (McCarthy,
2007). We usedOpenBUGSin combination withR soft-warethrough librariesR2WinBUGSandBRugs(Sturtz et
al., 2005; Thomas et al., 2006) to run the MCMC. Priors were chosen to be weakly informative. For eachbjthis prior had a normal distribution with mean zero and vari-ance equal to 103. The prior for the over-dispersion pa-rameterswas a uniform distribution between 0 and 10.
Models were compared by the Deviance Information Criterion (DIC) (Spiegelhalter et al., 2002).
DIC D 2p= $ + D,
whereD, is the expected posterior deviance and$
pDthe ef-fective number of estimated parameters. In hierarchical models the effective number of parameters can be much smaller than the actual number of parameters due to the build-in dependence structure among parameters. Fur-thermore, models for which differences in DIC and the DIC of the best fit (DDIC) are up to about 10 cannot be ranked with confidence (Spiegelhalter et al., 2002). Therefore, to choose among models within this range of
DDIC, considerations about the descriptive capacity of ecological important features should be taken into ac-count as well. We used this approach here. A Bayesian residual analysis was also performed on the chosen model, based on the Pearson residuals (Dobson, 2002).
r y e e i i i i [ ] [ ] [ ] [ ] = -l l
wherey[i]is the individual’ counts andel[ ]i is the mean predict abundance.
Within the Bayesian context we can obtain the poste-rior distribution for each Pearson residual and calculate the corresponding 95% posterior probability intervals. Only intervals which exclude zero indicate a bad fit. This objective residual check is unique to a Bayesian residual analysis and facilitates the identification of potential out-liers.
Occupation probabilityj[i]is defined as the probabil-ity that at least one individual is present at monthi(i.e.
y[i]> 0) and is therefore a function of the predict abun-dancel[i]:
j j l [ ] [ ] [ ] [ ] ( ) ( ) [ ]
i i i
i
P y P y
e i
= > = - =
= -
-0 1 0
1
Using this formula and the posterior distributions of eachl[i]over the period 1993 to 2002, posterior distribu-tions and 95% probability intervals for occupation proba-bilities were also obtained.
3. Results
The number of surveys per season is summarised in Table 1. The total number of counted individuals per sur-vey varied from 0 to 121.
sample of 10,500 values. Statistical diagnostic tools showed good convergence properties of the chains in all models and were omitted. Posterior means for the param-eters in all proposed models are given in Table 2.
By adding covariates the DIC decreased indicating a better fit. However, strong downward changes in DIC values occurred consistently whenever, for a given model, the over-dispersion parameterswas added, as
can be seen when comparing models 1, 3, 4, 6 and 7 with 1d, 3d, 4d, 6d and 7d, respectively. This is a strong evi-dence that data are over-dispersed and that a mixed model is appropriate. According to DIC, the best fit (model 6d) included covariates ‘Month’, ‘Year’, ‘Month2’ and over-dispersion
s. However, model 7d
with month-site interaction includes important ecologi-cal features which are helpful to distinguish the abun-dance oscillation between sites. For being acceptably close to the best model (i.e:DDIC = 11) we chose model 7d for the remaining analysis.
The high posterior probability P(b0[1] > b0[2]) = 0.996 is strong evidence that the site-effect favours larger average numbers at IL in comparison to ML (Bayes
fac-tor (BF) = 249 indicating that this hypothesis is 249 times more probable than its alternative). In absolute values, this difference represents about 18 individuals (95% probability interval 5.5 to 32.6).
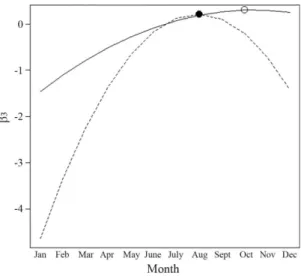
Since the quadratic term (Month2) (Table 2) is smaller than zero (the posterior 95% probability intervals do not include zero) there is statistical evidence that abundance increases from January up to a maximum. This maximum is reached at different times in both sites, in August (winter) and October (early spring) for IL and ML, respectively. After reaching its intra-year maxima, abundance at both sites behave differently. While at IL it
Figure 2- Monthly 95% probability intervals for the
loga-rithm of expected abundance ofOtaria flavescens(vertical lines) and the logarithm of observed counts (points) at Molhe Leste REVIS (above) and Ilha dos Lobos REVIS (be-low). Model 7d.
Table 1- Number of surveys per season to Molhe Leste
(ML) and Ilha dos Lobos (IL), southern Brazil, from January 1993 to December 2002.
Surveys/seasons Summer Autumn Winter Spring
ML 37 43 47 45
IL 29 31 32 42
Table 2- Models with different parameters combinationsb0([1] = ML or [2] = IL),b1(Month),b2(Year),b3(Month2) ands
(over-dispersion) ranked in decreasing order of DIC (exception 7(d)). Values are posterior means.
Parameters
b0 b1 b2 b3 s
Models ML IL Month Year Month2 Over-dispersion DIC
1 3.282 3.242 - - - - 5035
2 3.247 3.208 - 0.263 - - 4701
3 3.211 3.166 0.386 - - - 4341
4 3.175 3.133 0.385 0.261 - - 4015
5 3.546 3.526 0.534 - -0.435 - 3848
6 3.499 3.485 0.529 0.252 -0.422 - 3552
7 3.241 3.841 0.371 (ML)
1.010 (IL)
0.255 -0.061 (ML) -1.217 (IL)
- 2936
1d 2.777 2.523 - - - 1.334 1210
3d 2.767 2.501 0.697 - - 1.136 1209
4d 2.762 2.519 0.694 0.424 - 1.059 1209
6d 3.382 3.157 0.728 0.397 -0.642 0.921 1208
7d(*) 3.045 3.652 0.539(ML)
1.012(IL)
0.392 -0.240(ML) -1.111(IL)
decreases, at ML high abundance is maintained until De-cember.
The posterior 95% probability intervals (Pr.I.) of log(l[i]) obtained for model 7d and the corresponding ob-served log-counting log (l[i]) are further shown for ML and IL (Figure 2). The quadratic relation to abundance (Figure 3) and the marked seasonal trend (Figures 2), which is different for each site, are expressions of the Month-Site interaction.
A positive coefficient for ‘Year’ (Table 1, Figure 2) indicates a long-term increasing trend of abundance for both sites.
The residual analysis for model 7d is shown in Figu-re 4. Points indicate the Figu-residuals and vertical lines aFigu-re the 95% Pr.I. Intervals above the line indicate months with
model underestimates, while intervals below the line in-dicate model overestimates. All remaining points are within acceptable error range. Hence, for 86.1% of the data the model provides a good description of abundance, with overestimation in 11.1% and underestimation in the remaining 2.8% of the data.
Finally, the estimated occupancy probabilities for model 7d (Figure 5) define periods of the year in which area use was certain (probability 1). But, the increase over the years, in the smallest occupancy probability is a very clear indication that these sites are becoming more intensely occupied year after year.
4. Discussion
4.1. Covariates
The success of data analysis and inference depends of the choice of a statistical model that best approximates the data structure and the underlying ecological process. The principle of parsimony states that a good model should thrive for the smallest number of parameters able to represent the relevant features of data (Burnham and Anderson, 2002). The choice among covariates to incor-porate is, therefore, an important part in model selection and DIC a useful criterion to choose from competing can-didates.
As with other penalised likelihood criteria (e.g., Akaike Information Criterium or Bayesian Information Criterium), we caution that DIC is not intended for iden-tification of the “correct” model, but rather designed to merely compare a collection of alternative formulations (Carlin, 2000). In ecology there is often a great deal of ambiguity about the process involved in determining the true value of the response. If a number of possible model structures fit the observed data similarly, then there will be considerable uncertainty about which model is in fact the best one. If a plausible alternative model structure re-sults in predictions that are different from those of the chosen best model, then there is some risk involved in bravely ignoring the alternative (Wintle et al., 2003).
Figure 3- Quadratic effect of covariate Month on the
abun-dance ofOtaria flavescensas represented by the coefficient b3; continuous line represents Molhe Leste (ML) and dotted line Ilha dos Lobos (IL); maxima are represented by the open dot for ML and the solid dot for IL.
Figure 4- Posterior standard residuals means (points) with
95% probability intervals (vertical lines) for Molhe Leste REVIS (above) and Ilha dos Lobos REVIS (below). The horizontal lines represent posterior mean equal to zero. Model 7d.
Figure 5 - Monthly occupancy probability of Otaria
In our analysis all selected covariates contributed to the decrease in DIC indicating that they help to explain the abundance variation. But, only the inclusion of the over-dispersion parameter was able to cause a decisive reduction in DIC. Similar preference for an over-dis-persed model fit was achieved by Kinas et al. (2005) us-ing a negative binomial distribution of the response vari-able in a conventional generalized linear model (GLM).
Despite the fact that DIC indicated 6d as the best fit, we opted for choosing the sub-optimal model 7d to make our inferences because this model describes important aspects of the distinctions between both sites. Although slightly over-parameterised, we believe that the ecologi-cal features that emphasise such distinction between the haul-outs is a fair price to pay.
The hypothesis formulated by Silva (2002) that sea lions, when leaving Uruguay after the reproductive sea-son first arrive at ML, divide themselves between the two sites in a later time and return to Uruguay after a final “pit-stop” at ML, is corroborated by the distinct monthly occupancy patterns in both haul-outs.
The residual analysis was presented in the form of probability intervals. This is a unique feature of the Bayesian approach to residual analysis and a helpful tool to easily identify unacceptable discrepancies. Since in a Poisson regression variances are proportional to means, different residuals have to be analysed distinctively. This explains why some small residuals are considered unac-ceptable (short probability interval) in comparison to oth-ers that are much larger but associated to wide probability intervals.
4.2. Seasonality
Observed counts are useful as relative indexes of population size and indicators of abundance patterns (Márquez et al., 2006). Due to a possible availability bias, the resulting abundance estimates should be treated as “minimal average abundance”. But, provided that the number of animals absent from the haul-out at time of counting represents an approximately stable percentage of total abundance, seasonal variation and long-term trends should be analysed as if they were bias-free.
The seasonal movements observed in our data may be partially attributed to changes in the availability of food resources near the rookeries (Rosas et al., 1994; Stern, 2002), since food distribution in the ocean may be heavily influenced by physical properties like water tem-perature and nutrient availability (Bowen et al., 2002). The location of biologically productive sites and associ-ated physical fronts may result in high abundance of prey that compound the diet of pinnipeds (Bowen et al., 2002). The south Brazilian coast suffers influence of the Subtropical Convergence consisting of the confluence of tropical waters provided by the Brazil Current (BC) and sub-Antarctic waters provided by the Malvinas Current (MC). Wind-driven circulation can cause latitudinal dis-placement of this mixture zone (Palma et al., 2004). These waters are also influenced by the continental water discharges of the La Plata and Patos Lagoon estuaries
which support high biological productivity (Castro and Miranda, 1998). All these factors are important features that impact fish abundance on the continental shelf, mainly demersal teleosts (familySciaenidae) (Haimovici et al., 1997), the preferred prey ofO. flavescens.
Another important productivity source, ensuring high fish catches in the region, is the intrusion of nutrient through the South Atlantic Central Water along the bot-tom of the shelf reaching sub-superficial layers. This upwelling occurs mostly in the border region between the states Santa Catarina and Rio Grande do Sul, specifically at Torres where IL is located (Brandini, 1988).
Furthermore, stochastic events likeEl Niño Southern Oscillation(ENSO) may carry out prey to the adjacent area of the Patos Lagoon estuary (Garcia et al., 2003), causing the South American sea lions displacement in or-der to feed elsewhere. Thus, strong discharges caused by theENSOmay change the foraging behaviour including longer trip period and distances and increase of foraging effort (Bowen et al., 2002). This hypothesis corroborates the observations of Silva (2002) who described low abundance forO. flavescensin 1998 at ML, a year with
strong El Niño. However, none of the covariates related toENSO, likeSouthern Oscillation Index,Oceanic Niño IndexandMultivariate ENSO Indexhad significant ef-fect and were therefore omitted from the text.
Further influence on the foraging of pinnipeds is wa-ter temperature, which seems to condition the arrival of sea lions at the Rio Grande do Sul shelf. According to Pinedo (1990), the displacement ofO. flavescensis sup-ported by the cold waters of the MC inner branch. The mean latitude at which the BC meets the MC depends on season (Reid et al., 1977). The winter average latitude is 25.8° S and has been reported to reach the minimal lati-tude of 25.2° S in August (Souza and Robinson, 2004). The Southern sea lions also reached the highest abun-dance at RS in winter and beginning of spring and specif-ically in August at IL which also agrees with the hypothe-sis put forward by Pinedo (1990).
This study allows the conclusion that abundance of
O. flavescenson haul-outs of Rio Grande do Sul varied
seasonally reaching maximum numbers in winter and early spring with peaks in August and October for Molhe Leste and Ilha dos Lobos, respectively. This cyclic pat-tern is combined with a long-term linear increasing trend in abundance. This trend is further supported by the long-term increase observed for minimum intra-year oc-cupation probability byO. flavescens. Finally, the hierar-chical Bayesian inference of an over-dispersed Poisson model was able to provide a good fit to data and to con-tribute to better understand the interplay of various co-variates in abundance and occupancy patterns.
Acknowledgments
Meio Ambiente, Fundação O Boticário de Proteção à Natureza, Superintendência do Porto de Rio Grande and Universidade Federal do Rio Grande (FURG). The cited Program was established in 1991 to promote integration among research groups, implement actions aimed at the conservation of pinnipeds in Rio Grande do Sul, and pro-vide environmental education to communities involved. The authors gratefully acknowledge the suggestions pro-vided by Alexandre M. Garcia. The Conselho Nacional de Desenvolvimento Científico e Tecnológico (CNPq) provided a scholarship to the first author who worked un-der the guidance of the last.
References
BOWEN, WD., BECK, CA. and AUSTIN, DA., 2009. Pinniped Ecology. In PERRIN, WF., WURSIG, B. and
THEWISSEN, JGM. (Eds.). Encyclopedia of Marine
Mammals. San Diego: Academic Press. p. 852-860.
BRANDINI, FP., 1988. Hydrography, phytoplankton biomass and photosynthesis in shelf and oceanic waters off
south-eastern Brazil during autumn (May/June, 1983).Braz. J.
Oceanogr., vol. 36, no. 1-2, p. 63-72.
BUCKLAND, ST. and YORK, AE., 2009. Abundance Estima-tion. In PERRIN, WF., WURSIG, B. and THEWISSEN,
JGM. (Eds.).Encyclopedia of Marine Mammals. San
Die-go: Academic Press. p. 1-6.
BURNHAM, KP. and ANDERSON, DR., 2002.Model
Selec-tion and Multimodel Inference: A Practical InformaSelec-tion – Theoretic Approach. New York: Springer Science+Busi-ness Media. 488 p.
CAMPAGNA, C., 1985. The breeding cycle of the southern sea
lion, Otaria byronia. Mar. Mam. Sci., vol. 1, no. 3,
p. 210-218.
CAMPAGNA, C., WERNER, R., KARESH, W., MARÍN, MR., KOONTZ, F. and COOK, R. and KOONTZ, C., 2001. Movements and location at sea of South American sea lions (Otaria flavescens).J. Zool., vol. 255, no. 2, p. 205-220.
CASTELLO, JP. and PINEDO, MC., 1977. Os visitantes
oca-sionais do nosso litoral.Natureza em Revista, vol. 2,
p. 40-46.
CASTRO, BM. and MIRANDA, LB., 1998. Physical oceanog-raphy of the western Atlantic continental shelf located be-tween 4°N and 34°S. In ROBINSON, AR. and BRINK,
KH. (Eds.). The Sea. Oxford: John Wiley & Sons.
p. 209-251.
DANS, SL., CRESPO, EA., PEDRAZA, SN. and ALONSO, MK., 2004. Recovery of the South American sea lion (Otaria flavescens) population in northern Patagonia.
Can. J. Fish. Aquatic Sci., vol. 61, no. 9, p.1681-1690.
DOBSON, AJ., 2002.An Introduction to Generalized Linear
Models. Florida: Chapman and Hall; CRC. 221 p.
FARAWAY, JJ., 2006.Extending the Linear Model with R.
Florida: Chapman and Hall; CRC. 332 p.
GARCIA, AM., VIEIRA, JP. and WINEMILLER, KO., 2003. Effects of 1997-1998 El Niño on the dynamics of the shal-low-water fish assemblage of the Patos Lagoon Estuary (Brazil).Est., Coast. Shelf Sci., vol. 57, no. 3, p. 489-500. GELMAN, A., CARLIN, JB., STERN, HS. and RUBIN, DB.,
1995.Bayesian Data Analysis. New York: Chapman and
Hall; CRC. 668 p.
GIARDINO, G., MANDIOLA, MA., BASTIDA, R. and RO-DRÍGUEZ, D., 2009. Movimientos estivales de machos deOtaria flavescensentre Puerto Quequén (Argentina),
Uruguay y Patagonia. In Proceedings of the workshop
Estado de situación del lobo marino común en su área de distribución. p. 35.
HAIMOVICI, M., CASTELLO, JP. and VOOREN, CM., 1997. Fisheries. In SEELIGER U., ODEBRECHT C. and
CAS-TELLO JP. (Eds.).Subtropical Convergence
Environ-ments: the Coast and Sea in the Southwestern Atlantic.
New York: Springer-Verlag. p.1-17.
KINAS, PG., SILVA, KG., ESTIMA, SC. and MONTEIRO, DS., 2005. Generalized linear models applied to stranding data of South American sea lions (Otaria flavescens) and
South American fur seals (Arctocephalus australis) in
southern Brazil. Lajam., vol. 4, no. 1, p. 7-14.
LEINZ, V. and AMARAL, SE., 1966.Geologia Geral. São
Paulo: Nacional. 512 p.
MÁRQUEZ, J., YATACO, G., ALZA, L. and VAN OORDT, F., 2006. Changes in population size and distribution of the fur sealArctocephalus australis, and sea lionOtaria flavescens, off Peru, from 1971-2006. InProceedings of the Humboldt Current System International Conference: Climate, ocean dynamics, ecosystem processes, and fish-eries. p. 193.
MCCARTHY, MA., 2007.Bayesian Methods for Ecology. New
York: Cambridge University Press. 296 p.
PÁEZ, E., 1996. Simulaciones estocásticas en la población de
Otaria flavescensen Uruguay. InProceedings of the VII Reunión de Trabajo de Expertos en Mamíferos Acuáticos de América del Sur. p. 116.
PALMA, ED., MATANO, RP., PIOLA, AR. and SITZ, LE., 2004. A comparison of the circulation patterns over the Southwestern Atlantic Shelf driven by different wind
stress climatology. Geophys. Res. Lett., vol. 31,
no. L24303, p. 1-5.
PINEDO, MC., 1990. Ocorrência de pinípedes na costa
brasi-leira.Garcia de Orta, série de Zoologia, vol. 15, no. 2,
p. 37-38.
REID, JL., NOWLIN, WDJR. and PATZERD, WC., 1977. On the characteristics and circulation of the Southwestern At-lantic Ocean. J. Phys. Oceanogr., vol. 7, no. 1, p. 62-91.
RODRÍGUEZ, DH., 1990. Aspectos biológicos, ecológicos e
históricos de la colonia de lobos marinos de un pelo, Otaria flavescens (Shaw, 1800), el puerto Mar del Plata. Mar del Plata: Universidad Nacional de Mar del Plata. 168 p. Tesis de Doctorado en Ciencias.
ROSAS, FCW., PINEDO MC., MARMONTEL M. and HAI-MOVICI M., 1994. Seasonal movements of South Ameri-can sea lion (Otaria flavescens, Shaw) off the Rio Grande do Sul coast, Brazil.Mammalia, vol. 58, no. 1, p. 51-59.
ROYLE, JA. and DORAZIO, RM., 2008. Hierarchical
Modeling and Inference in Ecology. San Diego: Aca-demic Press. 444 p.
SANFELICE, D., VASQUES, VC. and CRESPO, EA., 1996.
Ocupação sazonal porOtariidae(Mammalia-Pinnipedia)
da Reserva Ecológica da Ilha dos Lobos, Município de
Torres, Rio Grande do Sul, Brasil. InProceedings of the
VII Reunión de Trabajo de Expertos en Mamíferos Acuáticos de América del Sur. p. 46.
SEELIGER, U., ODEBRECHT, C. and CASTELO, JP., 1997.
Subtropical Convergence Environments: The coast and the Sea in the Southwestern Atlantic. New York:
Sprin-ger-Verlag. 398 p.
SILVA, KG., 2004.Os Pinípedes no Brasil. Ocorrências,
SOUZA, RB. and ROBINSON, IS., 2004. Lagrangian and Sat-ellite Observations of the Brazilian Coastal Current.Cont. Shelf Res.,vol. 24, no. 2, p. 241-262.
SPIEGELHALTER, DJ., BEST, NJ., CARLIN, BP. and VAN DER LINDE, A., 2002. Bayesian measure of model com-plexity and fit.Jour. Royal Stat., vol. 64, no. 4, p. 583-639.
STERN, SJ., 2009. Migration and Movements Patterns. In PERRIN, WF., WURSIG, B. and THEWISSEN, JGM.
(Eds.). Encyclopedia of Marine Mammals. San Diego:
Academic Press. p. 742-748.
STURTZ, S., LIGGES, UE. and GELMAN, A., 2005. R2WinBUGS: A Package for Running WinBUGS from R.Journal of Statistical Software, vol. 12, no. 3, p. 1-16. THOMAS, A., O’HARA, B., LIGGES, U. and STURTZ, S.,
2006. Making BUGS Open.R news, vol. 6, no. 1, p 12-17.
THOMPSON, D., STRANGE, I., RIDDY, M. and DUCK, CD., 2005. The size and status of the population of southern sea
lions Otaria flavescens in the Falkland Islands. Biol.
Cons., vol. 121, no. 3, p. 357-367.
VAZ-FERREIRA, R., 1981. South American sea LionOtaria
flavescens(Shaw). In RIDGWAY S. and HARRISON R.
(Eds.).Handbook of Marine Mammals. New York:
Aca-demic Press. p. 39-66.
VIEIRA, EF., 1984.Rio Grande do Sul: geografia física e
vegetação. Porto Alegre: Sagra. 184 p.
WESTERGAARD, G., RODRIGUEZ, D., RIVERO, L. and BASTIDA, R., 1999. Dinámica y estructura de edades del
apostadero de lobos marinos de un pelo (Otaria
flavescens) de Puerto Quequén, Argentina. In Proceed-ings of the VIII Congreso Latinoamericano de Ciencias del Mar. p. 265-266.