GENETIC LINKAGE MAPS OF CHICKEN
CHROMOSOMES 6, 7, 8, 11 AND 13 FROM A BRAZILIAN
RESOURCE POPULATION
Marcel Ambo1; Raquel de Lello Rocha Campos1; Ana Sílvia Meira Tavares Moura4; Clarissa Boschiero4; Millor Fernandes do Rosário2; Mônica Corrêa Ledur5; Kátia Nones6; Luiz Lehmann Coutinho3*
1
USP/ESALQ - Programa de Pós-Graduação em Ciência Animal e Pastagens. 2
USP/ESALQ - Programa de Pós-Graduação em Genética e Melhoramento de Plantas. 3
USP/ESALQ - Depto. de Zootecnia, C.P. 09 - 13418-900 - Piracicaba, SP - Brasil. 4
UNESP/FMVZ - Depto. de Produção Animal - 18618-000 - Botucatu, SP - Brasil. 5
Embrapa Suínos e Aves, C.P. 21 - 89700 - 000 - Concórdia, SC - Brasil. 6
Crop & Food Research, Private Bag 4704 - Christchurch 8140 - New Zealand. *Corresponding author <llcoutin@esalq.usp.br>
ABSTRACT:A linkage map is essential not only for quantitative trait loci (QTL) mapping, but also for the organization and location of genes along the chromosomes. The present study is part of a project whose major objective is, besides from construction the linkage maps, the whole genome scan for mapping QTL for performance traits in the Brazilian experimental chicken population. Linkage maps of chicken chromosomes 6 to 8, 11 and 13 were constructed based on this population. The population was developed from two generations of crossbreeding between a broiler and a layer line. Fifty-one microsatellite markers were tested, from which 28 were informative: 4, 8, 7, 4 and 5 for chromosomes 6, 7, 8, 11 and 13, respectively. A SNP located in the leptin receptor gene was included for chromosome 8. Ten parental, 8 F1 and 459 F2 chickens from five full-sib families were genotyped with these markers. The number of total informative meioses per locus varied from 232 to 862, and the number of phase-known informative meioses from 0 to 764. Marker orders in the chromosomes coincided with those of the chicken consensus map, except for markers ADL0147 and MCW0213, on chromosome 13, which were inverted. The reduced number of phase-known informative meioses for ADL0147 (150) may be pointed out as a possible cause for this inversion, apart from the relative short distance between the two markers involved in the inversion (10.5 cM).
Key words: Gallus gallus, quantitative trait loci (QTL), genetic maps, microsatellite markers, animal breeding
MAPAS DE LIGAÇÃO DOS CROMOSSOMOS 6, 7, 8, 11 E 13 DE
UMA POPULAÇÃO BRASILEIRA DE GALINHA
RESUMO: O mapa de ligação além de ser fundamental no mapeamento de locos de características quantitativas (QTLs) é importante na organização e localização de genes distribuídos ao longo dos cromossomos. O presente estudo é parte de um trabalho cujo objetivo maior, é a análise de mapeamento de QTLs para características de desempenho no genoma de uma população experimental desenvolvida no Brasil. Com base nesta população foram construídos os mapas de ligação dos cromossomos 6 a 8, 11 e 13 da galinha. A população foi desenvolvida a partir de duas gerações de cruzamentos entre uma linhagem de corte e uma de postura. Foram testados 51 marcadores microssatélites, dos quais 28 foram informativos: 4, 8, 7, 4 e 5 dos cromossomos 6, 7, 8, 11 e 13, respectivamente. Um SNP localizado no gene do receptor da leptina foi incluído no cromossomo 8. Os 10 parentais, 8 F1 e um total de 459 aves F2 de cinco famílias de irmãos completos foram genotipados com estes marcadores. O número de meioses informativas totais por loco variou de 232 a 862 e o de meioses informativas de fase conhecida de 0 a 764. A ordem dos marcadores nos cromossomos coincidiu com a do mapa consenso da galinha, com exceção dos marcadores ADL0147 e MCW0213 do cromossomo 13 que tiveram sua ordem invertida. O número reduzido de meioses informativas de fase conhecida para o marcador ADL0147 (150) pode ser apontado como uma possível causa para a inversão, além da relativa proximidade entre os dois marcadores envolvidos na inversão (10,5 cM).
INTRODUCTION
Economically important traits are genetically controlled by many genes, and the genetic linkage map (LM) construction is essential for mapping quantita-tive trait loci (QTL). Microsatellite markers are commonly used in animal genetic mapping, due to easy amplification by PCR, a high polymorphic degree, and their codominant characteristic (Ferreira & Grattapaglia, 1998).
Several aspects regarding chickens makes this species extremely well suited to experiments aimed at the localization of QTLs, such as a short generation interval, the ability to generate large full-sib pedigrees, and the ease of obtaining large quantities of DNA from the nucleated blood cell (Groenen et al., 1998). Cur-rently 2,306 loci on 53 linkage groups from a total size of 4,200 cM were identified in chickens (Schmid et al., 2005). Two of three reference populations are ac-tively used for LM: East Lansing (EL) and Wageningen (WAU) (Schmid et al., 2005). However, the first sensus chicken LM (Groenen et al., 2000) was con-structed based on these three populations. The first of them, Compton (C), was genotyped with 100 mark-ers on 18 linkage groups, covering 585 cM (Bumstead & Palyga, 1992). The second map used the EL popu-lation and 98 markers in 19 linkage groups, generat-ing a linkage map of 590 cM (Levin et al., 1994). And the last population, WAU, used 430 markers, compris-ing 28 linkage groups containcompris-ing 3,062 cM (Groenen et al., 1998). The consensus linkage maps is constantly reviewed and updated, helping as a source for the sci-entific community.
Our group is conducting the whole chicken genome scanning to identify QTLs in an F2 population generate by crossing a broiler line and a layer line. However, before QTL mapping analyses it is neces-sary to identify informative markers and construct the LM. A linkage map based on genotyping information from 27 microsatellite markers positioned on chromo-somes 6, 7, 8, 11 and 13 in the intercross is reported here, and will be used for mapping QTL controlling performance and carcass traits.
MATERIAL AND METHODS
Experimental population
To generate an F2 population, seven males from a broiler line (TT) were mated to seven females from a layer line (CC). Each male was mated to three unrelated females selected randomly to generate 21 F1 families, with approximately 100 chicks per family, in 17 incubations, totalizing 2,063 F2 animals. The con-struction of the genetic linkage map of chromosomes
6, 7, 8, 11 and 13, used the five informative families indicated in a previous selective genotyping study of chromosomes 1 to 5 in this population (Baron, 2004; Nones et al., 2005; Ruy et al., 2005). TT was selected for various generations for growth related traits, such as body weight, whereas CC was selected for egg pro-duction traits (Nones et al., 2006).
DNA isolation
Animal’s blood samples were collected in tubes containing EDTA 10% and stored in a -70ºC freezer. Blood samples were extracted from brachial vein in parents, and through bleeding at slaughter in F1 and F2 animals. Genomic DNA isolation was
con-ducted using the DNAzol® reagent following
manufacturer’s protocol with minor modifications. DNA concentration in each sample was assessed by spectrophotometer and standardized to a final concen-tration of 20 ηg µL-1.
Genotyping
Fluorescent primers were used in PCR to am-plify DNA fragments, provided by United States Poul-try Genome Project and Roslin Institute, UK. Fragment lengths were determined by the automatic sequencer
MEGABace1000 (GE HealthCare®
). Each PCR sample was prepared using 100 ηg µL-1 of DNA, 4.0 mmol L-1 MgCl2, 50 mmol L-1 KCl, 10 mmol Tris-HCl (pH 8.5), 400 µM of each dNTP, 5 U Taq DNA Polymerase and 5 pmol of each primer, totalizing final volume of 25 µL. The program used in the thermocycler for PCR reactions consisted in an initial denaturation at 95ºC for 5 minutes, and 30 cycles of: 1 minute at 95°C, 1 minute at 50 to 67ºC (annealing temperature) depend-ing on primers sequence, and an extension of 1 minute at 72ºC. After the 30 cycles, an extension at 72ºC for 10 minutes was conducted.
Three to four markers were combined accord-ing to amplicon size and primer fluorescence. Samples were precipitated and ressuspended with 4.75 µL load-ing solution and 0.25 µL internal standard ET-ROX400. Genotyping data were checked and corrected manu-ally. A total of 28 markers (out of 51 tested) were used to genotype approximately 459 F2 individuals from five full-sib families, 10 parental and 8 F1 animals on chro-mosomes 6, 7, 8, 11 and 13 (4, 8, 7, 4 and 5, respec-tively) were genotyped.
Linkage analysis
Initially, the Twopoint option of CRIMAP was used for two-point linkage analysis in which the re-combination rate between each of the two most in-formative linked markers of a chromosome and each one of the other markers was estimated. The order of loci was obtained with the Build option. A pair of highly polymorphic linked loci was chosen to start marker’s ordering. The other loci were progressively added to the map, placed in each possible position with respect to the loci already ordered. The best position was based on the highest log10 likelihood and LOD > 3.0.
The order of different loci was checked using the Flips2 option, to look for an erroneous order. Fi-nally the Chrompic option was used to verify every combination event amount order markers and to iden-tify errors and potential double-crossing overs. The maps were draw with the MapChart software version 2.1(Voorrips, 2002).
RESULTS AND DISCUSSION
From 16 markers tested on chromosome 6, 11 could not be used because no amplification products were obtained, and one (ADL0040) was not informa-tive (only one allele). Four markers were used in the construction of the linkage group. On chromosome 7, eight markers were informative, out of 15 tested. Six markers did not generate amplification products, and marker ADL0180 showed only one allele. On chromo-some 8, 12 markers were tested, but only seven were informative. The leptin receptor (LEPR) SNP marker identified and genotyped by Ninov et al. (2006) was informative in three full-sib families, presenting two al-leles. Chromosomes 11 and 13 counted with four and six markers respectively, and only for MCW0322 on chromosome 13 no amplification products were
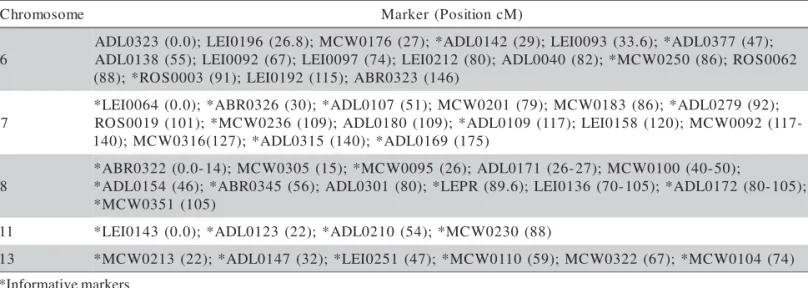
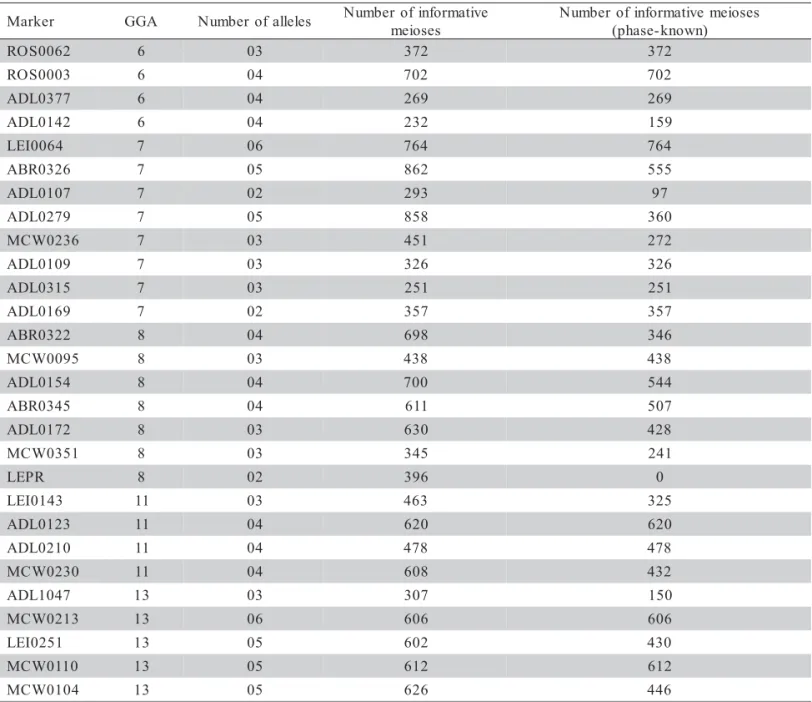
ob-tained. Table 1 lists all markers used on these five chro-mosomes and their positions (cM) on the consensus map (Schmid et al., 2005). A total of 28 informative markers were employed on the construction of the linkage maps and the respective number of informa-tive meioses and of phase-known informainforma-tive meioses are shown on Table 2.
Map distances between markers given in this paper are sex-averaged distances in cM. An initial LODscore= 0.0 was accepted in Twopoint option to es-timate the recombination rate between the pairs of markers. Recombination fractions between all mark-ers from each of the five chromosomes were calcu-lated.
The linkage group of chromosome 6 (Figure 1) covered 38 cM out of 146 cM from the consensus map (Schmid et al., 2000), and the average distance between markers was 12.7 cM, varying from 2.8 to 20 cM. Marker positions on the linkage group were concentrated in the central region, leaving gaps on chromosomes extremities. An effort to increase marker density in gap regions was made, but no in-formative markers were identified. A larger number of informative markers on these regions would contrib-ute to a complete QTL analysis.
Linkage map of chromosome 7 (Figure 1) had 131.2 cM and average distance of markers was 18.7 cM (varying from 5.9 to 35.4 cM). In comparison, the consensus map (Schmid et al., 2000) had 165 cM and 19 fixed position markers were typed. The low information content of marker ADL0107 precluded the inclusion of this marker with a LOD > 3.0. A LOD = 2.0 was accepted to allow linkage between markers ADL0107 (33% informative meioses phase known compared to total meioses, Table 2) and ADL0279. The markers followed the same order of the consensus map.
Table 1 - Markers selected for linkage map construction of chromosomes 6, 7, 8, 11 and 13.
*Informative markers e m o s o m o r h
C Marker(PositioncM)
6 ; ) 7 4 ( 7 7 3 0 L D A * ; ) 6 . 3 3 ( 3 9 0 0 I E L ; ) 9 2 ( 2 4 1 0 L D A * ; ) 7 2 ( 6 7 1 0 W C M ; ) 8 . 6 2 ( 6 9 1 0 I E L ; ) 0 . 0 ( 3 2 3 0 L D A 2 6 0 0 S O R ; ) 6 8 ( 0 5 2 0 W C M * ; ) 2 8 ( 0 4 0 0 L D A ; ) 0 8 ( 2 1 2 0 I E L ; ) 4 7 ( 7 9 0 0 I E L ; ) 7 6 ( 2 9 0 0 I E L ; ) 5 5 ( 8 3 1 0 L D A ) 6 4 1 ( 3 2 3 0 R B A ; ) 5 1 1 ( 2 9 1 0 I E L ; ) 1 9 ( 3 0 0 0 S O R * ; ) 8 8 ( 7 ; ) 2 9 ( 9 7 2 0 L D A * ; ) 6 8 ( 3 8 1 0 W C M ; ) 9 7 ( 1 0 2 0 W C M ; ) 1 5 ( 7 0 1 0 L D A * ; ) 0 3 ( 6 2 3 0 R B A * ; ) 0 . 0 ( 4 6 0 0 I E L * ; ) 9 0 1 ( 6 3 2 0 W C M * ; ) 1 0 1 ( 9 1 0 0 S O
R ADL0180 (109);*ADL0109(117);LEI0158(120);MCW0092(117 -9 6 1 0 L D A * ; ) 0 4 1 ( 5 1 3 0 L D A * ; ) 7 2 1 ( 6 1 3 0 W C M ; ) 0 4
1 (175)
8 ; ) 0 5 -0 4 ( 0 0 1 0 W C M ; ) 7 2 -6 2 ( 1 7 1 0 L D A ; ) 6 2 ( 5 9 0 0 W C M * ; ) 5 1 ( 5 0 3 0 W C M ; ) 4 1 -0 . 0 ( 2 2 3 0 R B A * ; ) 5 0 1 -0 8 ( 2 7 1 0 L D A * ; ) 5 0 1 -0 7 ( 6 3 1 0 I E L ; ) 6 . 9 8 ( R P E L * ; ) 0 8 ( 1 0 3 0 L D A ; ) 6 5 ( 5 4 3 0 R B A * ; ) 6 4 ( 4 5 1 0 L D A * ) 5 0 1 ( 1 5 3 0 W C M * 1
1 *LEI0143(0.0);*ADL0123(22);*ADL0210(54);*MCW0230(88) 3
Means of total and phase-known informative meioses of chromosome 8 were 545 and 358, respec-tively. Three out of seven markers are fixed in the sensus map and followed the same order of the con-sensus map (ADL0154, ABR0345 e MCW0351). The number of phase known informative meioses for MCW0095 (not fixed) was 100%. The remaining markers showed variation from 68% to 83% for phase known informative meioses compared to total meioses, with the exception of marker ABR0322 that showed 49.6%.
The average marker interval on chromosome 8 was 14.9 cM (Figure 1), varying between 0.5 and 40.3 cM, and the total length was 89.6 cM. The larg-est gap was between markers ABR0345 and ADL0172. Linkage map of chromosome 11 (Figure 1) was in good agreement with the consensus linkage
map, showed the same marker order and a total length of 105.5 cM. The average distance between adjacent markers was 35.2 cM. The consensus map length was 88 cM. Differences in length could be explained by the use of different population crosses and number of markers (four were used in the present study, comparing to nine on the consensus map). These factors result in different estimates of recombination rates that contribute to map diver-gences.
The linkage map of chromosome 13 showed 57 cM, whereas the consensus map had 74 cM. An inversion of marker positions occurred between mark-ers ADL0147 and MCW0213. In the study by Jennen et al. (2004) the linkage map for chromosome 13 had 54.8 cM and the first and last markers were MCW0104 and MCW0213, similar to this study.
Table 2 - Informative microsatellite markers used in the linkage analysis, respective number of alleles, number of informative meioses and phase-known informative meioses.
r e k r a
M GGA Numberofalleles Numberofinformative s e s o i e m
s e s o i e m e v i t a m r o f n i f o r e b m u N
) n w o n k -e s a h p ( 2
6 0 0 S O
R 6 03 372 372
3 0 0 0 S O
R 6 04 702 702
7 7 3 0 L D
A 6 04 269 269
2 4 1 0 L D
A 6 04 232 159
4 6 0 0 I E
L 7 06 764 764
6 2 3 0 R B
A 7 05 862 555
7 0 1 0 L D
A 7 02 293 97
9 7 2 0 L D
A 7 05 858 360
6 3 2 0 W C
M 7 03 451 272
9 0 1 0 L D
A 7 03 326 326
5 1 3 0 L D
A 7 03 251 251
9 6 1 0 L D
A 7 02 357 357
2 2 3 0 R B
A 8 04 698 346
5 9 0 0 W C
M 8 03 438 438
4 5 1 0 L D
A 8 04 700 544
5 4 3 0 R B
A 8 04 611 507
2 7 1 0 L D
A 8 03 630 428
1 5 3 0 W C
M 8 03 345 241
R P E
L 8 02 396 0
3 4 1 0 I E
L 11 03 463 325
3 2 1 0 L D
A 11 04 620 620
0 1 2 0 L D
A 11 04 478 478
0 3 2 0 W C
M 11 04 608 432
7 4 0 1 L D
A 13 03 307 150
3 1 2 0 W C
M 13 06 606 606
1 5 2 0 I E
L 13 05 602 430
0 1 1 0 W C
M 13 05 612 612
4 0 1 0 W C
Figure 1 - Linkage group of chromosome 6 and linkage maps of chromosomes 7, 8, 11 and 13, and their updated linkage consensus maps (Schmid et al., 2000).
Marker ADL0147, involved in the order version, presented a low number of phase known in-formative meioses compared to other markers (Table 2). This can make it difficult to determine the order of the marker in the linkage map. Nevertheless, the other marker involved in the order inversion (MCW0213) was highly informative. Additionally, the interval between these two markers was small (10.5 cM), which may have caused difficulties in
determin-ing the relative position of these two markers in the linkage map.
backcrosses) showed even lower number of informa-tive meioses, varying from 20 to 50, respecinforma-tively. Therefore, the resource population used in this study provided a high number of informative meioses, gen-erating reliable linkage maps for QTL mapping. The average numbers of informative meioses and of phase-known informative meioses of each chromosome (6, 7, 8, 11 and 13) were: 393.7 and 375.5; 520.2 and 372.8; 545.4 and 357.7; 542.2 and 463.7; 550.6 and 448.8, respectively. The addition of microsatellite mark-ers, especially in the intervals that exceeded 20 cM, would greatly aid in the saturation and utility of this genetic map for QTL mapping.
CONCLUSIONS
The procedures used on linkage map construc-tion for this resource populaconstruc-tion showed valuable re-sults when compared with data from the chicken con-sensus map. Average numbers of informative meioses were high, indicating that results were reliable.
ACKNOWLEDGEMENTS
The current study was funded by Embrapa/ PRODETAB and Fapesp (Fundação de Amparo à Pesquisa do Estado de São Paulo) that has also granted scholarships to Marcel Ambo, R.L.R. Campos, C. Boschiero, K. Nones and M.F. do Rosário. A scholarship from CNPq was granted to A.S.A.M.T. Moura. L.L. Coutinho is a recipient of a research pro-ductivity scholarship from CNPq.
REFERENCES
BARON, E.E. Identificação de QTLs nos cromossomos 2 e 4 que controlam características de desempenho e carcaça em aves (Gallus gallus). Piracicaba: USP/ESALQ, 2004. 96p. Tese (Doutorado).
BUMSTEAD, N.; PALYGA, J. A preliminary linkage map of the chicken genome. Genomics,v.13, p.690-697, 1992. FERREIRA, M.E.; GRATTAPAGLIA, D. Introdução ao uso de
marcadores em análise genética. 3 ed. Brasília: CENARGEN, 1998. 220p.
GREEN, P.; FALLS, K.; CROOKS, S. CRI-MAP Program version 2.4. St. Louis: Washington University School of Medicine, 1990. GROENEN, M.A.M.; CROOIJMANS, R.P.M.A.; VEENENDAAL, A.; CHENG, H.H.; SIWEK, M.; POEL, J.J. van der A comprehensive microsatellite linkage map of the chicken genome. Genomics, v.49, p.265-274, 1998.
GROENEN, M.A.M; CHENG, H.H.; BUMSTEAD, N.; BENKEL, B.F.; BRILES, W.E.; BURKE, T.; BURT, D.W.; CRITTENDEN, L.B.; DODGSON, J.; HILLEL, J.; LAMONT, S.J.; LEON, A.P.; SOLLER, M.; TAKAHASHI, H.; VIGNAL, A. A consensus linkage map of the chicken genome. Genome Research, v.10, p.137-147, 2000.
JENNEN, D.G.J.; VEREIJKEN, A.L.J.; BOVENHUIS, H.; CROOIJMANS, R.P.M.A.; VEENENDAAL, A.; POEL, J.J. van der; GROENEN, M.A.M. Detection and localization of quantitative trait loci affecting fatness in broilers. Poultry Science, v.83, p.295-301, 2004.
LEVIN, I.; SANTANGELO L.; CHENG, H.; CRITTENDEN, L. B.; DODGSON, J.B.; An autosomal genetic linkage map of the chicken. Journal of Heredity, v.85, p.79-85, 1994. NINOV, K.; LEDUR, M.C.; NONES, K.; CAETANO, A.R.;
COLDEBELLA, A.; BERTOL, T.M.; COUTINHO, L.L. Mining of polymorphisms in the leptin receptor gene in two chicken lines and their association with performance and carcass traits. In: INTERNATIONAL CONFERENCE ON ANIMAL GENETICS, 30., Porto Seguro, 2006. Proceedings. Belo Horizonte: CBRA, 2006. CD-ROM.
NONES, K.; LEDUR, M.C.; RUY, D.C.; BARON, E.E.; MOURA, A.S.A.M.T.; COUTINHO, L.L. Genetic linkage map of chicken chromosome 1 from a Brazilian resource population. Scientia Agricola, v.62, p.12-17, 2005.
NONES, K.; LEDUR, M. C.; RUY, D.C.; BARON, E.E.; MELO, C.M.R.; MOURA, A. S.A.M.T.; ZANELLA, E.L.; BURT, D.W.; COUTINHO, L.L. Mapping QTLs on chicken chromosome 1 for performance and carcass traits in a broiler x layer cross. Animal Genetics, v.37, p.95-100, 2006.
RUY, D.C. NONES, K.; BARON, E.E.; LEDUR, M.C.; MELO, C.M.R.; AMBO, M.; CAMPOS, R.L.R.; COUTINHO, L.L. Strategic marker selection to detect quantitative trait loci in chicken. Scientia Agricola, v.62, p.111-116, 2005. SCHMID, M.; NANDA, I.; GUTTENBACH, M.; STEINLEIN, C.;
HOEHN, H.; SCHARTL, M.; HAAF, T.; WEIGEND, S.; FRIES, R.; BUERSTEDDE, J-M.; WIMMERS, K.; BURT, D.W.; SMITH, J.; A’HARA, S.; LAW, A.; GRIFFIN, D.K.; BUMSTEAD, N.; KAUFMAN, J.; THOMPSON, P.A.; BURKE, T.A.; GROENEN, M.A.M.; CROOIJMANS, R.P.M.A.; VIGNAL, A.; FILLON, V.; MORRISON, M.; PITEL, F.; TIXIER-BOICHARD, M.; LADJALI-MOHAMMEDI, K.; HILLEL, J.; MAKI-TANILA, A.; CHENG, H.H.; DELANY, M.E.; BURNSIDE, J.; MIZUNO, S. First report on chicken genes and chromosomes 2000. Cytogenetics and Cell Genetics, v.90, p.169-218, 2000. SCHMID, M.; NANDA, I.; HOEHN, H.; SCHARTL, M.; HAAF, T.;
BUERSTEDDE, J.M.; ARAKAWA, H.; CALDWELL, R.B.; WEIGEND, S.; BURT, D.W.; SMITH, J.; GRIFFIN, D.K.; MASABANDA, J.S.; GROENEN, M.A.; CROOIJMANS, R. P.; VIGNAL, A.; FILLON, V.; MORISSON, M.; PITEL, F.; VIGNOLES, M.; GARRIGUES, A.; GELLIN, J.; RODIONOV, A.V.; GALKINA, S.A.; LUKINA, N.A.; BEN-ARI, G.; BLUM, S.; HILLEL, J.; TWITO, T.; LAVI, U.; DAVID, L.; FELDMAN, M.W.; DELANY, M.E.; CONLEY, C.A.; FOWLER, V.M.; HEDGES, S.B.; GODBOUT, R.; KATYAL, S.; SMITH, C.; HUDSON, Q.; SINCLAIR, A.; MIZUNO, S. Second report on chicken genes and chromosomes 2005. Cytogenetic and Genome Research, v.109, p.415-479, 2005.
VOORRIPS, R.E. MapChart: software for the graphical presentation of linkage maps and QTLs. The Journal of Heredity, v.93, p.77-78, 2002.