The Evolution of Population
Distribution on the Iberian Peninsula: A
Transnational Approach (1877–2001)
LU´IS ESPINHA DA SILVEIRA, DANIEL ALVES, MARCO PAINHO, ANA CRISTINA COSTA
AND ANA ALC ˆ
ANTARA
QUERY SHEET
This page lists questions we have about your paper. The numbers displayed at left can be found in the text of the paper for reference. In addition, please review your paper as a whole for correctness.
Q1. Au: Please spell out EEC.
Q2. Au: Ok to add “(c)” before the last part of this sentence?
Q3. Au: Please spell out DTM.
Q4. Au: Ok to add “See Figure 1” here?
Q5. Au: In P´erez Moreda 2004 reference, please provide editor(s).
TABLE OF CONTENTS LISTING
The table of contents for the journal will list your paper exactly as it appears below:
The Evolution of Population
Distribution on the Iberian Peninsula: A
Transnational Approach (1877–2001)
LU´IS ESPINHA DA SILVEIRA
DANIEL ALVES
Instituto de Hist´oria Contemporˆanea, Universidade Nova de Lisboa
MARCO PAINHO
ANA CRISTINA COSTA
Instituto Superior de Estat´ıstica e Gest˜ao da Informac¸˜ao, Universidade Nova de Lisboa
ANA ALC ˆ
ANTARA
Instituto de Hist´oria Contemporˆanea, Universidade Nova de Lisboa
Abstract.Surpassing the national perspective usually adopted, the authors confirmed the existence of a pattern of population distri-bution common to the whole Iberian Peninsula in the long run. This pattern is clearly associated with geographical factors. These variables seem to have more weight in explaining changes between 5
1877/78 and 1940 than in the period from 1940 to 2001. The obser-vation of the cross-border region has shown that proximity to the frontier has not generated any distinct pattern of population density on either side of the boundary line. The spatial coherence of the observed phenomena throughout the Peninsula and of its evolution, 10
independent of the border between states, reinforces the importance
This work begun within the research project, “The Development of European Waterways, Road and Rail Infrastructures: A Geograph-ical Information System for the History of European Integration (1825–2005),” developed under European Science Foundation EU-ROCORES programme. In Portugal, it was funded by Fundac¸˜ao para a Ciˆencia e a Tecnologia. The good relationships established with the Spanish team allowed the integration of Josep Puig-Farr´e in our group from 2009 to 2011, a period in which we began devel-oping the historical geographical information system on the Iberian Peninsula. The problems that we faced and the methodology to solve them were presented in several conferences in 2010, and the Iberian Peninsula was then integrated in our geographical information sys-tem website (http://atlas.fcsh.unl.pt/). We benefited from the discus-sions with Jordi Marti-Henneberg and Xavier Franch in July 2011 and with the colleagues attending the workshop “L’ ´Us dels SIG en l’ Estudi de la Integraci´o Europea (1870–2010)” held in Barcelona in March 2012, also organized by Jordi Marti-Henneberg, and funded by European Union (Jean Monnet 200215 LLP-1-ES-AJMIC).
Address correspondence to Lu´ıs Espinha da Silveira, Instituto de Hist´oria Contemporˆanea, Faculdade de Ciˆencias Sociais e Hu-manas, Universidade Nova de Lisboa, Av. de Berna 26-C, 1069-061 Lisboa, Portugal. E-mail: [email protected]
of geographic factors in their explanation. At the same time, this verification opens up new issues related to the effect of national political and economic policies.
Keywords: border studies, geographic information systems, 15 Iberian Peninsula, spatial population distribution, transnational history
P
opulation distribution patterns in Portugal and in Spain have always been an important research topic. Ad- 20 ditionally, given the current dramatic imbalance be-tween a small group of densely populated and wealthy re-gions and the rest of the territories in both countries, this subject has also become a matter of concern for society as a whole. In fact, the differences in wealth, economic, and 25 demographic dynamism and the regional disparities in ac-cess to education, health, and other public services seriously endanger territorial cohesion and the principle of equal op-portunities among citizens. Therefore, revisiting the issue of population distribution from a transnational perspective and 30 in the long run is not only to address an important subject for research in humanities and social sciences, but to contribute to the understanding of the roots of a current social problem of great relevance.In this article, surpassing the national perspective usually 35 adopted, we tried to verify the existence of a spatial pattern of population distribution on the Peninsula as a whole and study its evolution. We also sought to evaluate the relevance of ge-ographical factors to explain this pattern, and we wanted to
analyze the importance of the Spanish-Portuguese border in 40
spatial population distribution. In the conclusion, we call the attention to some of the implications of our findings concern-ing the effect of political and economic policies on patterns of concentration/dispersion of population. The transnational approach and the in-depth spatial analysis supported by the 45
geographical information system (GIS) are the main contri-butions of this article to the research on this subject.
The literature published in Spain about territorial pop-ulation distribution and its evolution over the nineteenth and twentieth centuries is abundant. A list of the works 50
produced up until a few years ago can be found in Olga Cos Guerra and Pedro Reques Velasco (2005). Since then, research has continued, presenting remarkable results. We will focus our attention on these more recent articles. It has been recently argued that Europe’s regional inequali-55
ties worsened between 1870 and 2000. Patterns of popu-lation distribution over the same period show “stability in both underpopulated and very densely populated areas,” and this happened “despite enormous changes in the factors that have determined the location of population and economic 60
activities since 1870” (Mart´ı-Henneberg 2005, 277, 279). Analyzing population densities within a group of European countries of different sizes and geographical positions from 1850 to 2000, Maria Isabel Ayuda, Fernando Collantes, and Vicente Pinilla (2010a) came to similar conclusions. The 65
explanation put forth by these authors lay in the regional differences in the spread of industrialization and modern economic growth, which increased population disparities thereafter (although without profoundly affecting the spatial pattern existing in the pre-industrial era). In 2000, Portugal 70
and Spain would be amongst the countries where such dispar-ities were most pronounced (Dobado Gonz´alez 2006; Ayuda et al. 2010a).
Concerning Spain, regardless of the time period or the scale of the geographical framework, researchers agree upon 75
the existence of a considerably stable territorial pattern of population distribution. The latter is characterized by the contrast between the coastal lowlands, where population is concentrated, and the depopulated higher territories of the interior. Madrid, located at the center of the Peninsula, is 80
the most important exception to this general pattern. Vicente P´erez Moreda (2004), although working at the large regional area level, found evidence of such distribution as early as 1787. Rafael Dobado Gonz´alez (2006) and Ayuda et al. (2010b) confirmed the same pattern at the provincial level 85
for the period 1787 to 2000. Finally, Cos Guerra and Reques Velasco (2005) and Franciso Goerlich Gisbert and Matilde Mas Ivars (2006, 2008) came to the same conclusion on the municipal scale for the twentieth century. In addition, Goer-lich Gisbert and Mas Ivars (2008) and Ayuda et al. (2010a) 90
statistically confirmed the trend for population to concentrate in the areas that already had a higher population density at the beginning of the various periods under analysis by the two groups of researchers.
Accordingly, with the exception of P´erez Moreda (who did 95 not express his view on this issue), these authors underlined the importance of geographical factors (altitude, distance to coast, and rainfall) to explain the location of population.
The influence of geographical factors on economic devel-opment and the distribution of the world population, two dis- 100 tinct but inter-related phenomena, has been advocated by his-torians such as Paul Bairoch (1971, 118–20) and economists such as Andrew Mellinger, Jeffrey Sachs, and John Gallup (2000). The former drew attention to the effects of climate on agricultural productivity and human health. He also pointed 105 out that climatic differences hampered the spread of agri-cultural innovations developed in temperate regions, which were decisive in triggering the industrialization process. To these aspects Mellinger and colleagues (2000) added the im-portance of access to navigable rivers and the sea, by the 110 effect that this access has on transport.
However, if the geographical determinism of the past has been abandoned, it has not been possible to achieve a con-sensual view on the importance of the natural conditions in the spatial distribution of wealth and population. The Eco- 115 nomic Geography, in general, has not given great empha-sis to this issue (Wood and Roberts 2011). The New Eco-nomic Geography itself, initiated by Paul Krugman (1998), although it has reintroduced space in economic analysis does not grant importance to physical geography as well. For in- 120 stance, Pierre-Philippe Combes, Thierry Mayer, and Jacques-Franc¸ois Thisse (2006) argued that physical factors should be taken into account in explaining geographic distribution of development on a global scale, but not in the analysis of regional inequalities in developed countries. In this case, the 125 relevant factors to understand the concentration of economic activity and population are the combined effects of mar-ket size, economies of scale, and transport costs (Krugman 1993).
2009; Collantes and Pinilla 2011). The latter also profited 150
from scale economies and decreases in transportation costs. For this reason, at a later stage, geographical factors, though still important to explain population location, began to share this role with other factors related to this cumulative effect (Ayuda et al. 2010b).
155
Historians have long affirmed that the Portuguese popu-lation historically presented a denser concentration on the coastal strip to the North of the Tagus River (Marques 1987; Marques and Dias 2003). This concentration has increased from the sixteenth century onward, especially in the North-160
west region where cultivation of corn, imported from Amer-ica, found excellent conditions for development (Ribeiro 1945). It has recently become possible to rigorously con-firm this spatial pattern since the beginning of the nineteenth century and quantify its evolution until 1930 (Silveira et al. 165
2011). In fact, in 1801, 46% of the population lived on that narrow stretch of coastal Portuguese territory. Up until 1864, population distribution remained stable amongst the various regions, but from this moment onward the differences grew, aggravating the structural tendency to densify in the coastal 170
area. The construction of railroads may have contributed to this evolution (Silveira et al. 2011). Following World War II, vigorous emigration as well as migration from rural areas to the city came to strengthen the imbalance in population distribution and accentuate the separation between coastal 175
and inland regions (Ferr˜ao et al. 2005; Rodrigues 2008). Border studies are currently receiving an increasing atten-tion from researchers from various disciplines. In the case of the Spanish-Portuguese cross-border regions, the inter-est grew especially after the accession of both countries to 180
the EEC, mainly with the aim of counteracting the so-called Q1
“historical heritage of the border effect” (Moreira 2001, 7). However, the notion of border, which justifies the perspec-tive of “differentiation, opposition and periphery,” commonly used in this case, is a political and historical concept, not a 185
geographical one (Cavaco 1995, 9–10). In fact, it is usu-ally recognized that the Spanish-Portuguese frontier is not a “natural boundary,” in most part (Moreira 2001, 8). Some of the references that deal with the border do not have a his-torical depth, focusing their analyses mainly on the period 190
from the 1980s onward, or they address only one segment of the boundary line. Besides, they verified the existence of similar demographic behaviors on both sides of the fron-tier in the last decades of the twentieth century (Cavaco 1973, 1995; L´opez Trigal and Guichard 2000; Moreira 2001; 195
Lois-Gonz´alez 2004; Pires and Pimentel 2004).
Daniel Tirado Fabregat and Marc Badia-Mir´o (2012) re-cently argued that these regions were among the poorest of the Peninsula. At the same time, they defended that the bor-der did not break the economic continuity of the zone. This is 200
an important feature to highlight, because it is frequent in the works cited above that the analysis of the border regions is frequently done isolating them from the wider zones to which they belong, thus artificially reinforcing the aforementioned
“border effect.” This latter article and David Reher’s work 205 on Iberian cities (Reher 1994) are among the few that adopt a supranational perspective and are relevant for our purpose. As this short review suggests, research carried out in Portu-gal and Spain has been mostly focused on national contexts. It is true that Spanish researchers studied spatial population 210 distribution in Europe in order to find references to under-stand the history of their own country. However, neither the Spanish researchers nor their Portuguese colleagues have paid much attention to the evolution of the Iberian Peninsula as a whole. Only by understanding the strength of nationalist 215 traditions can we perceive how, both in humanities and in so-cial sciences research as well as in everyday life, it continues to be acceptable to conceive the reality of the two countries independently of one another.
In fact, the two states do share a territory marked by signifi- 220 cant natural contrasts, which nevertheless constitutes a single geographical entity. The border between the two countries is a political construct whose origins lay in the Roman Empire. It was formally established at the end of the thirteenth century (1297) and suffered minor changes in 1801. However, this 225 enduring frontier separates regions with similar geographical characteristics.
The intersection between geographical and political fac-tors creates a challenging setting for research. It stimulates a transnational approach to the study of spatial population 230 distribution in the long run and the re-examination of the im-portance of natural factors in the explanation of population concentration/dispersion, a topic that has been discussed for a long time, about which more empirical research is needed. In this article, regardless of national frontiers, we will then 235 address the three issues mentioned in the beginning: pat-terns of spatial population and their historical evolution; the importance of geographical factors to explain population lo-cation on the entire Iberian Peninsula; and last but not least, the influence of the Spanish-Portuguese border in population 240 location. The main hypotheses underlying this approach are the following: (a) patterns that have been separately identi-fied in Portugal and in Spain are part of a historical process taking place within the vast peninsular territory regardless of national states; (b) geographical factors had a decisive 245 importance in population location from the beginning of the period analyzed; and (c) that relevance was perpetuated into
the second half of the twentieth century. Q2
FIGURE 1. Altitude and main rivers in the Iberian Peninsula.
beginning of World War II, which separates an era of slow 260
economic growth and limited modernization from the post-war decades filled with rapid economic and social change (Tortella 1994; Carreras and Tafunell 2010; Costa, Lains, and Miranda 2012). Data on population evolution permit other al-ternatives, either before or after the selected year. However, 265
our choice also had the purpose of creating two periods with a similar duration, comprising minimum number of demo-graphic observations or population censuses. This feature is important for the statistical computations.
Data and Methods
270
Data
We adopted population density as a measure of population concentration and dispersion. As our objective was to analyze the influence of geographical factors, it was apparent that we
FIGURE 2. Population density in 1877/78, 1940, and 2001.
information for the years 1877–1900 and collected the same variable for Portugal.
In reference to geographical variables, we included alti-295
tude, distance to the coast, and rainfall as did the authors cited in our introduction. To these variables we also added average temperature and distance to main rivers, defined as those that flow directly toward the sea. As indicated at the beginning of this article, these factors would decisively influ-300
ence agricultural productivity, transportation, and access to drinkable water and thus affect population distribution. For reasons previously mentioned, we also analyzed the distance to the border between Portugal and Spain.
We took into account the altitude of the local parish and 305
municipal main agglomeration and the average altitude of each of these territories. These data were obtained from a DTM for all the Iberian Peninsula, with a spatial reso-Q3
lution of 200 m × 200 m, constructed for a previous re-search project (Silveira et al. 2011). Distances to the coast, 310
to the main rivers, and to the border were calculated using
the central point of the main population agglomeration of each parish/municipality. These points were provided by the Carta Administrativa Oficial de Portugal 2012.1 and, in the case of Spain, by theNomencl´ator Geogr´afico de Mu- 315 nic´ıpios y Entidades de Poblaci´on1 Precipitation and tem-perature correspond to the annual recorded average and were obtained from theDigital Climatic Atlas of the Iberian Penin-sula (Ninyerola i Casals, Pons, and Roure i Nolla 2005)2 These maps also have a spatial resolution of 200 m×200 m 320 and were generated through spatial interpolation techniques based on monthly and annual precipitation [temperature] se-ries with at least 20 [15] years of data in the period 1950–99 (Ninyerola i Casals, Pons, and Roure i Nolla 2007a, 2007b).
Methods 325
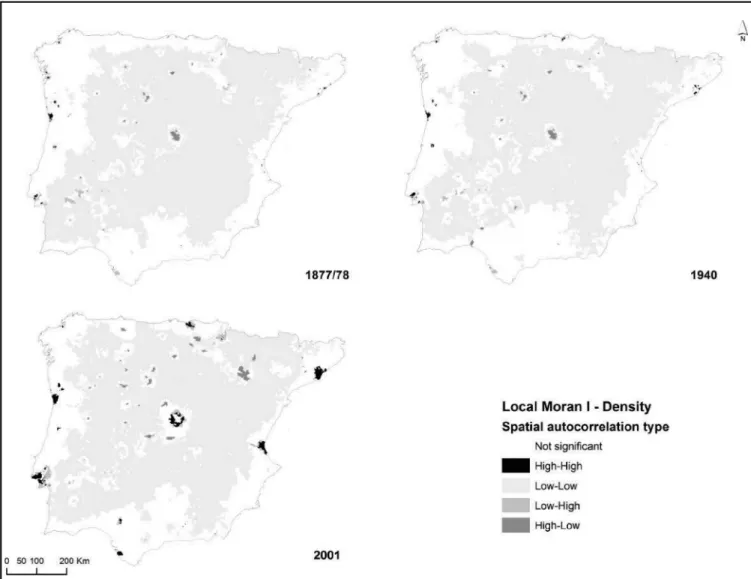
FIGURE 3. Spatial autocorrelation of the population density in 1877/78, 1940, and 2001.
a few years prior. In this system, we merged the base ad-ministrative maps of Portugal and Spain for the year 2001. 330
The system also includes the information mentioned in the previous section.
Geographic units and transnational analysis.The analy-sis of the spatial distribution of a quantitative variable across the territory of two countries requires the adoption of ad-335
ministrative units of similar size. The difficulty is that for the same administrative level, the divisions in Portugal and in Spain were not historically equal in their extension, nor are they currently. From the largest to the smallest, and from the highest political and administrative level to the lowest, 340
there are districts, municipalities, and parishes in Portugal, and autonomous communities, provinces, and municipalities in Spain. The analysis of the average areas of the admin-istrative divisions led us to the conclusion that only the combination of districts with provinces or of Portuguese 345
parishes with Spanish municipalities would be acceptable,
even if they did not occupy the same position in the respective hierarchy.
We finally opted for the latter combination, as these ad-ministrative units are the smallest in both countries, allowing 350 not only the in-depth analysis required in this research, but also the reconstitution of higher territorial divisions, thus en-abling more aggregate studies. Although seemingly the best approach, this choice does not eliminate differences in ex-tent between Portuguese parishes and Spanish municipalities 355 and their disparity across the Peninsula from North to South, which can be clearly seen on a map. These differences affect the maps which represent population density and introduce some bias into quantitative analysis.
FIGURE 4. Population density trend between 1877/78–1940, 1940–2001, and 1877/78–2001.
a 2001 municipality was based on the information regarding 365
population settlements included in its territory in 2001 pro-vided by the previous censuses (Goerlich Gisbert and Mas Ivars 2006). Regarding Portugal, two geographic data inter-polation methods, previously tested in an earlier work, were used: the areal-weighting interpolation in urban areas, cur-370
rently used in this type of studies (Gregory and Ell 2007), and a second method, using the distribution of population in the parishes during the target year (2001) as simplified ancillary data in the interpolation process3In any case, the
overwhelming majority of the Portuguese population from 375
the distinct censuses were not affected by the interpolation process since the parishes in which they lived did not undergo any boundary changes (Silveira et al. 2011).
Local spatial autocorrelation.The local version of Moran’s I, which is a measure of spatial autocorrelation, 380
can be used to identify local spatial clusters and spatial outliers (Anselin 1995). The cluster maps depict locations
classified by type of association, with significant (5% level) Local Moran statistics. The locations classified as “high-high” and “low-low” suggest clustering of similar values 385 (positive local spatial autocorrelation) and correspond to parishes/municipalities with high [low] values that are sur-rounded by parishes/municipalities with high [low] val-ues. The “high-low” and “low-high” locations are termed “spatial outliers” (negative local spatial autocorrelation), 390 corresponding to parishes and municipalities with values that are significantly different to those of their nearest neighbors.
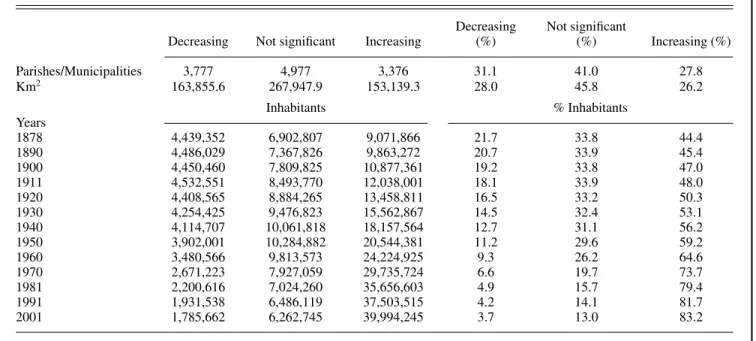
TABLE 1. Distribution of the Population According to the Density Trend (1877/78–2001)
Decreasing Not significant Increasing
Decreasing (%)
Not significant
(%) Increasing (%)
Parishes/Municipalities 3,777 4,977 3,376 31.1 41.0 27.8
Km2 163,855.6 267,947.9 153,139.3 28.0 45.8 26.2
Inhabitants % Inhabitants
Years
1878 4,439,352 6,902,807 9,071,866 21.7 33.8 44.4
1890 4,486,029 7,367,826 9,863,272 20.7 33.9 45.4
1900 4,450,460 7,809,825 10,877,361 19.2 33.8 47.0
1911 4,532,551 8,493,770 12,038,001 18.1 33.9 48.0
1920 4,408,565 8,884,265 13,458,811 16.5 33.2 50.3
1930 4,254,425 9,476,823 15,562,867 14.5 32.4 53.1
1940 4,114,707 10,061,818 18,157,564 12.7 31.1 56.2
1950 3,902,001 10,284,882 20,544,381 11.2 29.6 59.2
1960 3,480,566 9,813,573 24,224,925 9.3 26.2 64.6
1970 2,671,223 7,927,059 29,735,724 6.6 19.7 73.7
1981 2,200,616 7,024,260 35,656,603 4.9 15.7 79.4
1991 1,931,538 6,486,119 37,503,515 4.2 14.1 81.7
2001 1,785,662 6,262,745 39,994,245 3.7 13.0 83.2
0,0 10,0 20,0 30,0 40,0 50,0 60,0 70,0 80,0 90,0 100,0
1877/78 1890 1900 1910/11 1920 1930 1940 1950 1960 1970 1981 1991 2001
P
e
rc
en
tage
of
t
o
tal i
nhab
it
an
ts
Decreasing Not significant Increasing
TABLE 2. Association Between the Population Density in the Starting and Ending Year of Each Study Period, Measured by the Spearman’s Correlation Coefficient (R)
Study period R pvalue
From 1877/78 to 1940 0.9305 .0000 From 1940 to 2001 0.9117 .0000 From 1877/78 to 2001 0.8292 .0000
extends this group to include the neighbors of the first order neighbors.
Trend assessment.The computation of the trend magni-tude of population density as well as the assessment of its statistical significance (5% level) were applied to each 405
parish/municipality data of the following study periods: (a) 1877/78–2001; (b) 1877/78–1940; and (c) 1940–2001. A nonparametric approach is preferred over the tradi-tional regression analysis because of the violation of its assumptions, particularly the homoscedasticity of the er-410
rors and the regularity of error distribution. In fact, many parishes/municipalities exhibit heteroscedastic errors (not shown), which make the statistical tests unreliable. More-over, violations of normality compromise the estimation of coefficients and the assessment of trend significance. 415
The nonparametric estimator proposed by Pranab Kumar Sen (1968) was used to compute the trend magnitude for each parish and municipality within the study periods considered. To test the null hypothesis of no trend, the well-known non-parametric Mann-Kendall test (Mann 1945; Kendall 1975) 420
was applied to each set of parish/municipality data, for each of the study periods considered. Thep values of each test location and period correspond to the smallest level of signif-icance, leading to the rejection of the null hypothesis within the observed data. Accordingly, there is no statistical evi-425
dence of trend forpvalues exceeding .05.
Analysis of association with geographical attributes. Con-sidering that the assumptions of the Pearson’s correlation test are violated, the nonparametric Spearman’s test was applied to assess the association between population variables and 430 the above mentioned geographical attributes. The population variables correspond to the population density of each year, and the trend magnitude of each study period (1877/78–2001; 1877/78–1940; 1940–2001). The 5% significance level was considered to test the null hypothesis of no association be- 435 tween two variables. Amongst the geographical attributes that are significantly associated with the population variables, an especial attention was given to those having a Spearman’s correlation coefficient greater [smaller] than 0.4 [–0.4].
The Iberian Peninsula might have sub-regions where pop- 440 ulation had distinct behaviors throughout the years that may cancel out the effect of association with the geographi-cal attributes. Therefore, in order to further understand the relationship between population evolution and geographi-cal factors, the Iberian Peninsula was stratified into one 445 of three different ways, depending on the trend results of the 1877/78–2001, 1877/78–1940, and 1940–2001 periods. Hence, the methodological framework was applied sepa-rately to each stratum of these three time periods. For each of the latter, a parish/municipality was assigned to stratum 1 if 450 its population density decreased; it was assigned to stratum 2 if there was no significant trend; and it was assigned to stra-tum 3 if its population density increased in the corresponding period.
Results 455
Spatial Distribution Patterns and Their Evolution
To characterize spatial distribution of population density and its evolution on the Iberian Peninsula as a whole over 120 years, we will proceed with an analysis structured in three successive and complementary steps. In this way, be- 460 yond a geographical description of population density at three
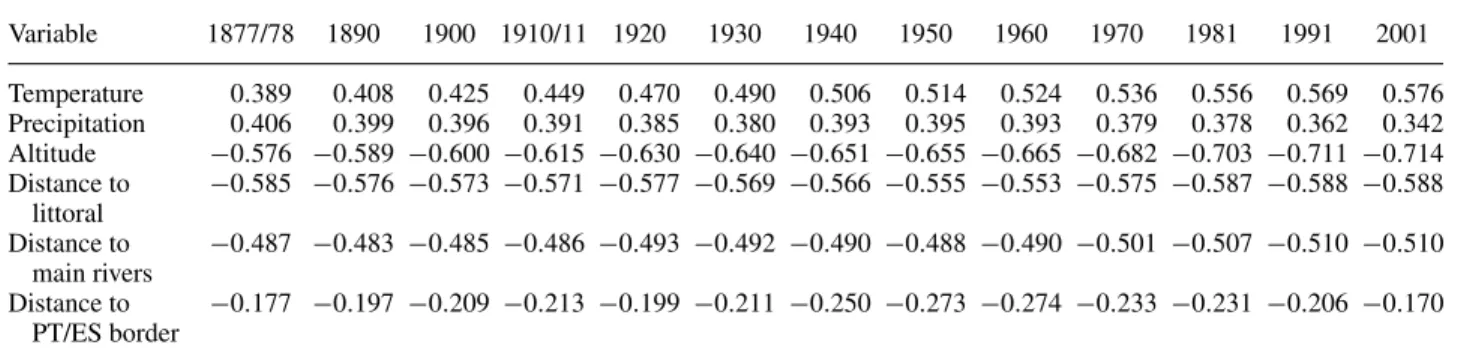
TABLE 3. Association Between Population Density and Geographical Factors, Measured by the Spearman’s Correlation Coefficient (R)
Variable 1877/78 1890 1900 1910/11 1920 1930 1940 1950 1960 1970 1981 1991 2001
Temperature 0.389 0.408 0.425 0.449 0.470 0.490 0.506 0.514 0.524 0.536 0.556 0.569 0.576
Precipitation 0.406 0.399 0.396 0.391 0.385 0.380 0.393 0.395 0.393 0.379 0.378 0.362 0.342
Altitude −0.576 −0.589 −0.600 −0.615 −0.630 −0.640 −0.651 −0.655 −0.665 −0.682 −0.703 −0.711 −0.714
Distance to littoral
−0.585 −0.576 −0.573 −0.571 −0.577 −0.569 −0.566 −0.555 −0.553 −0.575 −0.587 −0.588 −0.588
Distance to main rivers
−0.487 −0.483 −0.485 −0.486 −0.493 −0.492 −0.490 −0.488 −0.490 −0.501 −0.507 −0.510 −0.510
Distance to PT/ES border
–0,80 –0,60 –0,40 –0,20 0,00 0,20 0,40 0,60 0,80
1877/78 1890 1900 1910/11 1920 1930 1940 1950 1960 1970 1981 1991 2001
S
p
e
ar
m
an'
s
c
or
rela
tion
c
o
ef
fi
c
ien
t
Temperature Precipitation Altitude
Distance to littoral Distance to main rivers Distance to PT/ES border
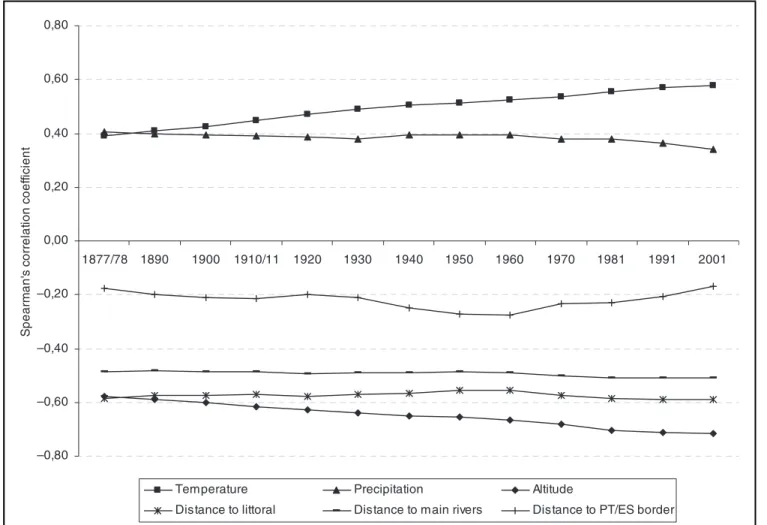
FIGURE 6. Association between population density and geographical factors (1877/78–2001).
identified moments in time, 1877/78, 1940, and 2001, we also seek to understand how each parish/municipality related to neighboring territories as a manner of identifying the auto-correlation patterns of this variable and, ultimately, analyse 465
its evolutionary trends. See Figure 1. Q4
Figure 2 shows population density at those three moments. In all maps, we have deliberately erased the frontier between the two countries. As we can observe, in 1877/78 population was already concentrated, to some degree, in the coastal re-470
gions. We notice a large area extending from Southern Portu-gal, passing through the Spanish Southern Plateau, and end-ing at the Pyrenees, with very small density rates. In the center of the Peninsula, between areas of high and medium density, Madrid stands out. In 1940, population densities increased 475
almost everywhere with the exception of the region closest to the Pyrenees and a small area to the South of the Sistema Central, without breaking the general pattern. The growing density on the coastal stretch from Corunna to Lisbon should be noted as the outgrowth of some of the Peninsula’s urban 480
inland areas. However, the big change occurs passing from 1940 to 2001, reflecting the process of economic expansion
following the war and the industrialization and urbanization movements associated with it. In this regard, the 1970s were a dramatic period of change. The contrasts between rural and 485 urban regions and between inland and coastal regions be-came sharper than ever. During the 1980s and the 1990s, the depopulation of rural areas continued as metropolitan zones expanded.
On all these maps it is visually impossible to distinguish 490 Portugal from Spain. The concentration of population on the Atlantic coast to the North of the Tagus River continues into Galicia in Spain and forms the largest continuous high density area on the Peninsula. Similar trends seem to affect cross-border regions and rural and urban zones in both countries. 495
TABLE 4. Association Between Density Trend Magnitude and Geographical Factors, Measured by the Spearman’s Correlation Coefficient (R)
Population density trend magnitude
1877/78–2001 1877/78–1940 1940–2001
Variable R pvalue R pvalue R pvalue
Temperature 0.4161 .0000 0.4676 .0000 0.2026 .0000
Precipitation 0.1698 .0000 0.2160 .0000 0.0098 .2814
Altitude −0.4754 .0000 −0.5012 .0000 −0.2787 .0000
Distance to littoral −0.3289 .0000 −0.3043 .0000 −0.2655 .0000
Distance to main rivers −0.2777 .0000 −0.2844 .0000 −0.1891 .0000
Distance to
Portugal/Spain border
−0.1033 .0000 −0.2401 .0000 0.1932 .0000
clusters, corresponding to urban areas, on the Western At-lantic strip such as Lisbon, Oporto, Vigo, and Corunna as well 505
as on the Spanish Mediterranean Coast such as Barcelona and Valencia. Cities that stand out within the interior of the Peninsula are few, seemingly concentrating themselves in the Northern part and characterized by a negative spatial auto-correlation, combining the high density of the city core with 510
the low density of the surrounding municipalities, as in the cases of Valladolid and Burgos, but especially Madrid. This general pattern is virtually unchanged when we observe the Local Moran Indicator map in 1940. In 2001, the most re-markable difference is the importance of the high density 515
clusters. They correspond to a large share of the most pop-ulated urban centers of the Peninsula. The two major cities
in the coastal region of both countries (Barcelona and Va-lencia in Spain; Lisbon and Oporto in Portugal) really stand out, with a pattern that clearly shows the process of sub- 520 urbanization that affected these centers in the last decades of the twentieth century. The same can be said of Madrid, with the characteristic emptying of the city center being here that much more visible still. Beyond this, the pattern of an ample zone filled with low densities continues throughout 525 the interior of the Peninsula, spreading itself now to include a substantial part of Galicia and of the Northern interior of Portugal.
To characterize the evolution of population density and of the spatial patterns described above, we calculated the 530 density growth trend in the general period and in the two
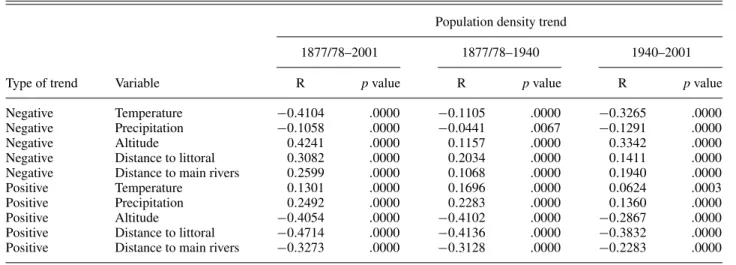
TABLE 5. Association Between Density Trend and Geographical Factors, by Stratum (Type of Trend), Measured by the Spearman’s Correlation Coefficient (R)
Population density trend
1877/78–2001 1877/78–1940 1940–2001
Type of trend Variable R pvalue R pvalue R pvalue
Negative Temperature −0.4104 .0000 −0.1105 .0000 −0.3265 .0000
Negative Precipitation −0.1058 .0000 −0.0441 .0067 −0.1291 .0000
Negative Altitude 0.4241 .0000 0.1157 .0000 0.3342 .0000
Negative Distance to littoral 0.3082 .0000 0.2034 .0000 0.1411 .0000
Negative Distance to main rivers 0.2599 .0000 0.1068 .0000 0.1940 .0000
Positive Temperature 0.1301 .0000 0.1696 .0000 0.0624 .0003
Positive Precipitation 0.2492 .0000 0.2283 .0000 0.1360 .0000
Positive Altitude −0.4054 .0000 −0.4102 .0000 −0.2867 .0000
Positive Distance to littoral −0.4714 .0000 −0.4136 .0000 −0.3832 .0000
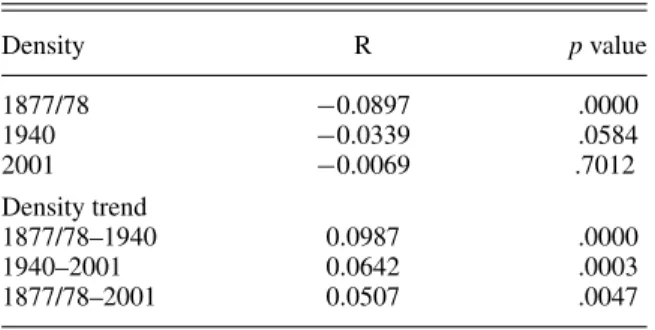
TABLE 6. Association Between Population Density and Distance to the Frontier in the Spanish-Portuguese Border Region (NUTS III), Measured by the Spearman’s Correlation Coefficient (R)
Density R pvalue
1877/78 −0.0897 .0000
1940 −0.0339 .0584 2001 −0.0069 .7012 Density trend
1877/78–1940 0.0987 .0000
1940–2001 0.0642 .0003
1877/78–2001 0.0507 .0047
sub-periods, 1877/78–1940 and 1940–2001 (Figure 4). The trend between 1877/78 and 2001 emphasizes the strong growth of the big coastal urban agglomerations as well as of the inland middle-size cities. The map also pictures a cer-535
tain distinction between the positive evolution of the region South of the Tagus river and opposite trend of the area on the North of the same river. In the first period, it is clear that the urban areas, especially in the coastal regions, were already growing faster, followed by the city of Madrid. The decrease 540
of densities, mainly in values that stay below one inhabitant per km2per year, is visible in the Northern part of the Penin-sula, tending to affect larger areas in the Northeast and some municipalities along the Spanish Mediterranean coast. In the rest of the Peninsula, the population density is growing. The 545
map of the period between 1940 and 2001 depicts the di-vide between the inland and the coastal periphery, the former with general negative growth values, punctuated by several “small islands.” These ones represent population growth in urban areas surrounded by zones of rural depopulation. The 550
exceptional growth of Madrid and its suburbs stands out. A vigorous upward movement in an almost continuous coastal line surrounding the Peninsula is also noticeable, with the exception of a small part of the Southwest coast of Portugal and of the Cantabrian coast.
555
At the base of this analysis are three strong long-term trends in population distribution that can be pointed out on the Iberian Peninsula: population concentration on the coast to the detriment of the interior (even taking into account the exceptions previously noted); a more pronounced concentra-560
tion in the big cities (also, overwhelmingly, situated on the coast and representing a larger population than all the other areas combined); and, finally, a certain contrast between the Northern Peninsula which, globally, seems to lose its pop-ulation density, and the Southern Peninsula, which, also in 565
general terms, is witnessing an increase in this demographic variable.
Table 1 and Figure 5 help us to understand the evolution that has been described so far. The territories with
signifi-cant trends represented 54% of the Peninsula’s area, divided 570 relatively equally between growth zones and those that lost population. Despite this territorial equilibrium, one observes an accentuated difference in population distribution in these zones in 1877/78. In fact, the parishes and municipalities that were to grow in the period under observation already 575 had twice the resident population that existed in the zones that were to experience a decrease. The changes registered up to 2001 greatly aggravate this inequality and lead to a situation in which more than 80% of the population would come to be concentrated within merely 26% of the Penin- 580 sula’s territory. At the opposite end of the spectrum, in 2001 the resident population of areas that lost inhabitants (close to 1.8 million), in comparison, would be little more than the number of residents in the municipality of Barcelona (close to 1.5 million), living in 27% of the Peninsula’s territory. 585
In the zones with a trend of increasing population density, we pinpoint two distinct moments of acceleration in this pro-cess: passing from 1910/11 to 1920 and, in an even more sharply accentuated way, from 1950 to 1960 (Table 1 and Figure 5). It is notable that in 1920 the population concen- 590 trated in these areas already represented 50% of the total population. Analyzing absolute resident population values, the turning point at the middle of the twentieth century is re-confirmed. In fact, until 1950 one sees an incremental popu-lation increase in 75% of the Peninsula’s area (corresponding 595 to the zones that always grew and to those with a no signifi-cant trend, but which did effectively grew until 1940/1950), while after that date population growth would be restricted to little more than 25% of the Peninsula’s territory.
Observing population density trend in the period 600 1877/78–2001 (Figure 4), we already verified that the ar-eas with strong growth corresponded to the large urban ag-glomerations along the coast, such as Barcelona, Valencia, Alicante, Malaga, Lisbon, Oporto, Vigo, Corunna, Gij´on, and Oviedo e Bilbao (each with more than 200,000 residents 605 in 2001), as well as Madrid, obviously, and a small num-ber of medium-sized cities in the interior such as Saragossa, Valladolid, Burgos, and Salamanca (each with more than 150,000 residents in 2001). This is something also visible and consistent with the spatial autocorrelation map of 2001 610 (Figure 3). Looking at Figure 4, we also pointed to a par-ticular difference between North and South (regions divided by the Tagus River). In the North of the Peninsula, polygons corresponding to the parishes and municipalities that regis-tered a trend of population decrease were (in number) 30% 615 more and (in area) more than double of those that grew. This perspective is reversed in the South of the Peninsula where the parishes and municipalities that grew in density represent more than double in number and almost five times the area
of those that experienced a decrease. 620
FIGURE 7. Spanish-Portuguese border: Population density in 1877/78, 1940, and 2001.
The first fact to note is that globally, given the value of the 625
Spearman coefficient, the relative position of the parishes and municipalities in 1877/78 is very close to that in 2001. This solidifies the idea expressed in the introduction, now extended to the whole of the Peninsula, at the lowest admin-istrative level of the two countries, in which a significant part 630
of populational attraction, measured by the evolution of the trend of population density, results from a self-sustained pro-cess. This means that the agglomerations of the nineteenth century that managed to capture a greater volume of the pop-ulation are going to be, by this fact and by the dynamics of 635
subsequent political, social, and economic developments, the principal targets of internal migration flows that will, in turn, strengthen and self-nourish a previously visible trend.
In second place, it is obvious that this process was only partially fed by the parishes and municipalities in which the 640
population presented a downward trend. In these cases, there is a visible and almost linear evolution, and the number of
inhabitants involved is relatively small (Table 1 and Figure 5). If it is certain that in absolute terms 1910/11 coincides with the year in which these territories begin to lose population 645 in a continuing pattern, it is all the more relevant to observe that the year 1950 represents the same phenomenon in areas with no defined trend. If we pay attention to the fact that the population in these last areas grew from 7 million to almost 10 million residents between 1877/78 and 1950 and then 650 decreased continuously and sharply until 2001 to numbers inferior to initial figures, we understand that essentially, it was here that the previously mentioned gap widened.
Association With Geographical Factors
FIGURE 8. Spanish-Portuguese border: Spatial autocorrelation of the population density in 1877/78, 1940, and 2001.
to highlight factors with the greatest intensity of association with spatial distribution of the Iberian Peninsula’s popula-660
tion, we selected only the Spearman coefficients with val-ues that were equal to or surpassed 0.4 (–0.4), with two exceptions. The altitude of the parish and municipal main agglomeration was not used as it was apparent that working with territorial divisions of such small scale, the value of the 665
coefficients reflected almost perfectly the average altitude of the polygon, which made its use redundant. In the case of distance to the border, since it would correspond to one of this study’s central questions, we considered its analysis per-tinent, despite those values being below the indicated limit 670
(Table 3).
Observing Table 3 and Figure 6, we can highlight the im-portance of median altitude and distance from the shore in the relationship to spatial distribution of the population between 1877/78 and 2001. Aside from presenting slightly lower co-675
efficient values, distance to main rivers is equally relevant. These data lead to the characterization of population
distri-bution in 1877/78 as one of a population with the tendency to concentrate in regions of lower altitude, close to the shore and to the main rivers. Despite noting a certain stability and 680 persistence in the level of association between these factors and the various moments of observing population density, in the case of altitude one sees a progressive and notable building up in the intensity of this relationship throughout the entire period under study, being the only variable to pass 685 the barrier of 0.7 on a scale that oscillates between 0 (no association) and 1 (perfect association).
FIGURE 9. Spanish-Portuguese border: Population density trend 1877/78–2001, 1877/78–1940, and 1940–2001.
average temperature. Although less visible comparing the first year and the final year, the relationship of higher pop-ulation density with greater rainfall begins to lose intensity beginning in the middle of the twentieth century.
700
As we observed the density map for 1877/78, we had already pointed out a strong tendency for a greater popula-tion concentrapopula-tion in coastal regions which, basically, were also the lower-altitude regions and those which had a denser hydrographic network (Figures 1 and 2). The simultaneous 705
presence of these three factors seems to have determined from very early population distribution on the Iberian Peninsula with few exceptions, amongst them Madrid and a handful of medium-sized cities in the interior of the Peninsula.
If it is possible to verify the always statistically signif-710
icant and intense association between geographical factors and density in each year, when we look at the relationship of the same factors with population density trends, the first conclusion we come to is that in the global period, the associ-ations are on average less intense, only revealing themselves 715
to be relevant (equal or greater than 0.4 [–0.4]) in regards to altitude and average temperatures (Table 4). This inten-sity diminishes in reference to distance to the coast and even more so with respect to distance to main rivers. Despite the differences in the levels of intensity of the associations, the 720 relationship between various geographical factors and popu-lation density trend is similar to that which has already been observed about spatial distribution pattern. It can be affirmed that in general terms, a stronger trend in population density growth is somehow associated with geographical locations 725 that are characterized by simultaneously having a higher av-erage temperature, a lower median altitude, and greater prox-imity to the coast and main rivers. Association with average rainfall presents values substantially lower than other factors.
period in which Spearman values all drop in a significant 735
way, in some cases to less than half, becoming statistically not significant as in the case of rainfall (Table 4). This is consistent with the idea that geographical factors, despite continuing to have importance in spatial population distribu-tion in the second half of the twentieth century, lose weight 740
in the explanation of this evolution. This fact would be re-lated with the self-sustaining and cumulative character of population growth previously referred to. Highlighting once again the most relevant intensities of association, perhaps one could assert that between 1877/78 and 1940 the evo-745
lution of population distribution was somehow influenced by median altitude and average temperature of the parishes and municipalities, but these factors did not have the same relevance in changes occurring in population density in the period 1940–2001.
750
In part, we deem that the singular evolution experienced by those areas with a statistically not significant evolution in population trends, to which we have previously referred, could be an explanation for differentiated trends in both sub-periods, once combined with associations to geographical 755
factors. In a primary phase, population increases even in ar-eas where average altitude surpasses 600 meters (Figures 2 and 4), corresponding roughly to the Northern Plateau, the Southern Plateau, and to the Sistema Central and Ib´erico, characterized by high plains and some ranges, despite the 760
same occurences on the plains of Alentejo and Andalusia. In a second moment, these same areas lose population amidst a quickening rhythm of population concentration along the coast and in some cities in the interior of the Peninsula (Figures 2 and 3).
765
Simultaneously, if we focus on the areas with positive and negative general trends (Table 5), we see that the parishes and municipalities that are growing have an association with geographical factors, in particular to those which pertain to altitude and distance from the coast, which are more intense 770
in the first period than in the second, and that this evolution is inverted in the case of parishes and municipalities that see their population density decrease in general with more intense associations in the second period than in the first. This is a finding that is in line with that which was observed 775
in the temporal evolution of population indicators (Table 1 and Figure 5), seemingly pointing to a greater influence of geographical factors as factors for attracting population until the middle of the twentieth century, becoming in the second half of the century factors of repulsion in zones which are 780
losing population on the Iberian Peninsula.
The (Ir)relevance of the Border
As previously observed, associations of spatial distribu-tion of populadistribu-tion density within each one of the observed moments with the distance from the Spanish-Portuguese bor-785
der correspond to the least intense of all variables selected for this study, oscillating between a maximum of –0.27 and
a minimum of –0.17 (Table 3). However, it is necessary to mention that these calculations are clearly influenced by the inclusion of all the territory of the Iberian Peninsula. Dis- 790 tortions are introduced into the analysis not only because the lesser distance between the coast and the border in the Portuguese case increases population concentration values which are taken into account in the association with prox-imity to the border, but also due to the reverse phenomenon 795 when one includes very distant regions in the analysis, such as Saragossa and Barcelona also characterized by a high density.
Therefore, we had to devise a way to isolate the effect of the frontier on the Spearman coefficient calculations. It is 800 difficult to delimit cross-border regions based on such small size units as parishes and municipalities. The combination of Portuguese districts and Spanish provinces was not an alter-native, since the use of the former would entail the inclusion of areas far away from the frontier. The most satisfactory 805 solution to overcome these problems seemed the adoption of the NUTS III existing in 2001, which in Spain correspond to the provinces and in Portugal to units smaller than the districts. After defining the area to be analyzed, we took into consideration the parishes and municipalities contained in 810 those divisions and recalculated all the Spearman’s coeffi-cients (Table 6).
The first conclusion to be drawn is that the weak associa-tion between distribuassocia-tion of populaassocia-tion density and distance to the border when considering the whole Peninsula became 815 practically non-existent when we narrow our attention on the border region. All Spearman’s values come very close to zero, falling over time and, in the case of associations with density in 1940 and 2001, resulting in statistically not signifi-cant values. In the case of trends, whether general or those of 820 the sub-periods, they prove to be equally very weak, always inferior to 0.10 (Table 6).
These observations support the hypothesis that proximity to the border did not generate any distinct pattern in popula-tion density, whether in terms of spatial distribupopula-tion or in the 825 temporal evolution. Basically, it was the fact of being near or far from the coast, of having high or low altitude, or of being distant or close to the rivers that influenced values of population density in this region.
On the other hand, we see that whatever the statistical measure considered, the density pattern and trend on both sides of the border in each of the three suggested sub-regions 845
is similar (Figures 7, 8, and 9). If we focus only on density values in the three years selected, we observe a significant strengthening in population relocation on the Northern and Southern coasts, as well as a dual trend in the central inte-rior region with a rise in density up until the middle of the 850
twentieth century and a subsequent decline accompanied by a concentration phenomenon in medium-sized cities, as is the case of Braganc¸a and Zamora, Guarda and Salamanca, Castelo Branco and Plasencia, Evora and Badajoz.
Finally, spatial distribution of the three measures (density, 855
spatial correlation, and trend) in the three suggested sub-regions is no more than the continuation of a spatial pattern that is visible in the wider areas on either side of the bor-der, which the frontier does not break (Figures 7, 8, and 9, compare respectively to Figures 2, 3, and 4). The population 860
movement toward the coast referred to on both sides of the border is much a part of an extensive phenomenon that can be seen on the Atlantic Coast, for example, from Corunna to Setubal. In the inland, the growth and subsequent decline that occurs, for example, in the border region between Ex-865
tremadura and Alentejo, begins in Castilla-La Mancha and extends itself to the Alentejo coast.
Conclusion
In Portugal and Spain, the modernization process began with the liberal revolutions of the 1830s. In fact, these revo-870
lutions implied a profound institutional change that created the conditions for the development of a capitalist economy. Gradually, the two countries then watched the transformation of their economies, driven by the spread of railways and of industry, a process that was accompanied by urban growth. 875
However, until the first half of the twentieth century these de-velopments were relatively moderate, especially compared to what occurred after the Second World War, a time of signif-icant economic growth and structural transformation, which included a vigorous urban development and major move-880
ments of rural-urban migration.
This work confirmed the existence of a pattern of popu-lation distribution common to the whole Iberian Peninsula. In fact, Local Moran indicator maps identified a persistent large zone of low population density clusters, extending from 885
the Pyrenees to the South of Portugal. With the exception of some areas, where it stretches to the sea, this low popula-tion density zone corresponds to the inland of the Peninsula. Its densities contrast with coastal ones, where urban life has strongly developed. We also found that this pattern of distri-890
bution evolved similarly in the peninsular territory. We have also seen that this development did not substantially alter the relative positions of the parishes and municipalities regard-ing values of population density between the beginnregard-ing and
end of the study period, a fact which had been registered for 895 Spain as stated in the introduction.
The pattern of population distribution is clearly associ-ated with geographical factors, in particular, altitude, dis-tance from shore, disdis-tance to main rivers, temperature, and precipitation. These factors seem to have more weight in 900 explaining changes between 1877/78 and 1940 than in the following period. The explanation suggested by Ayuda et al. (2010b) for a similar observation in relation to Spain may be valid regarding the Iberian Peninsula as a whole. In fact, geography would have strongly conditioned population lo- 905 cation in the period prior to modern economic growth. When this began, economic activity tended to concentrate in the more populated areas. The latter will benefit from migratory movements, economies of scale, and lowering transport costs and thus will grow faster than others. In this context, as time 910 goes on geographical factors continue to be of importance but decrease their explanatory weight.
Lastly, the observation of the cross-border region has shown that proximity to the frontier has not generated, ei-ther in the spatial distribution of population density or in 915 the temporal evolution, any distinct pattern on either side of the boundary line. This is consistent with what Maria Moreira (2001) said on the demographic behavior of these areas throughout the twentieth century. In reality, the density in border areas seems to be influenced by geographical fac- 920 tors and economic forces that are felt in the wider regions where those areas are integrated, which act similarly on both sides of that political divide.
The spatial coherence of the observed phenomena through-out the Peninsula and of its evolution, independent of the bor- 925 der between states, reinforces the importance of geographic factors in their explanation. At the same time, this verifica-tion opens up new issues related to the effect of economic policies, particularly in two areas related to the morphology of the territory and resources (i.e., transport and agriculture): 930 Were they very different, yet without contravening the natural constraints? Or, as it seems to have been the case, were they identical and parallel in time? If so, what is the explanation for their similarity and simultaneity? The answer to this last question should probably be sought in the insertion of two 935 states in the international political and economic context.
NOTES
1. Information available at http://www.igeo.pt/produtos/cadastro/caop/ caop vigor.htm and http://centrodedescargas.cnig.es/CentroDescargas/equ ipamiento.do?method=mostrarEquipamiento. 940
2. http://www.opengis.uab.es/wms/iberia/en index.htm.
3. Population of a parish in the initial year was allocated to the corre-sponding parishes of the target year, according to the weight of each of the latter in the total population of this set of units in 2001.
REFERENCES 945
Ayuda, M. I., F. Collantes, and V. Pinilla. 2010a. Long-Run regional popula-tion disparities in Europe during modern economic growth: A case study of Spain.The Annals of Regional Science44(2):273–95.
950
———. 2010b. From locational fundamentals to increasing returns: The spatial concentration of population in Spain, 1787–2000.Journal of Ge-ographical Systems12(1):25–50.
Bairoch, P. 1971.Le tiers-monde dans l’impasse. Paris: Gallimard. Carreras, A., and X. Tafunell. 2010.Historia econ´omica de la Espa˜na
Con-955
tempor´anea (1789–2009). Barcelona: Cr´ıtica.
Cavaco, C. 1973.A regi˜ao da fronteira do Rio Minho. Lisboa: Centro de Estudos Geograficos.
———. 1995.As regi˜oes de fronteira: Inovac¸˜ao e desenvolvimento na per-spectiva do mercado ´unico europeu. Lisboa: Universidade de Lisboa. 960
Collantes, F., and V. Pinilla. 2011.Peaceful surrender: The depopulation of rural Spain in the twentieth century. Tyne: Cambridge Scholars Publish-ing.
Combes, P.-P., T. Mayer, and J.-F. Thisse. 2006.Economie g´eographique.´ L’Int´egration des r´egions et des nations. Paris: Economica.
965
Cos Guerra, O., and P. Reques Velasco. 2005. Los cambios en los patrones territoriales de la poblaci´on espa˜nola (1900–2001).Papeles de Econom´ıa Espa˜nola104:167–92.
Costa, L. F., P. Lains, and S. Munch Miranda. 2012.Hist´oria econ´omica de Portugal, 1143–2010. Lisboa: Esfera dos Livros.
970
Dobado Gonz´alez, R. 2006. Geograf´ıa y desigualdad econ´omica y de-mogr´afica de las provincias espa˜nolas (siglos XIX y XX).Investigaciones de Historia Econ´omica5:133–70.
Ferr˜ao, J., I. Margarida Andr´e, J. Maca´ısta Malheiros, T. S´a Marques, and T. Pinto-Correia. 2005. Populac¸˜ao e Territ´orio. InGeografia de Portugal, 975
edited by Carlos Alberto Medeiros, 50–173. Lisboa: C´ırculo de Leitores. Goerlich Gisbert, F. J., and M. Mas Ivars, ed. 2006.La localizacio′n de la poblacio′n espan∼ola sobre el territorio: Un siglo de cambios. Un estudio basado en series homoge′neas (1900–2001). Bilbao: Fundacio′n BBVA.
———. 2008. Los motores de la aglomeraci´on en Espa˜na. Geograf´ıa versus 980
Historia.Documentos de Trabajo (Fundaci´on BBVA)5:5–46.
Gregory, I. N., and P. Ell. 2007.Historical GIS: Technologies, methodolo-gies, and scholarship. Cambridge: Cambridge University Press. Kendall, M. G. 1975.Rank correlation methods. London: Charles Griffin. Krugman, P. 1993. First nature, second nature, and metropolitan location. 985
Journal of Regional Science33(2):129–44.
———. 1998. What’s new about the new economic geography?Oxford Review of Economic Policy14(2):7–17.
Lois-Gonz´alez, R. C. 2004. A model of Spanish-Portuguese urban growth: The Atlantic axis.Dela21:281–94.
990
L´opez Trigal, L., and F. Guichard. 2000.La frontera hispano-portuguesa: Nuevo espacio de atracci´on y cooperaci´on. Zamora: Fundaci´on Rei Afonso Henriques.
Mann, H. B. 1945. Nonparametric tests against trend. Econometrica 13(3):245–59.
995
Marques, A. H. de Oliveira. 1987.Portugal na crise dos s´eculos XIV e XV. Lisboa: Presenc¸a.
Marques, A. H. de Oliveira, and J. Jos´e Alves Dias. 2003.Atlas Hist´orico de Portugal e do Ultramar Portuguˆes. Lisboa: Centro de Estudos Hist´oricos. Mart´ı-Henneberg, J. 2005. Empirical evidence of regional population 1000
concentration in Europe, 1870–2000. Population, Space and Place 11(4):269–81.
Mellinger, A. D., J. D. Sachs, and J. L. Gallup. 2000. Climate, coastal proximity, and development. InThe Oxford Handbook of Economic Ge-ography, edited by G. L. Clark, M. P. Feldman, and M. S. Gertler, 170–94.1005 Oxford: Oxford University Press.
Moreira, M. Jo˜ao Guardado. 2001.A dinˆamica demogr´afica na regi˜ao do Interreg Ib´erico no final do s´eculo XX. Lisboa: Universidade Nova de Lisboa.
Ninyerola i Casals, M., X. Pons, and J. M. Roure i Nolla. 2005.Atlas1010
clim´atico digital de la Pen´ınsula Ib´erica: Metodolog´ıa y aplicaciones en bioclimatolog´ıa y geobot´anica. Barcelona: Universitat Aut`onoma de Barcelona.
———. 2007a. Monthly precipitation mapping of the Iberian Peninsula using spatial interpolation tools implemented in a geographic information1015 system.Theoretical and Applied Climatology89:195–209.
———. 2007b. Objective air temperature mapping for the Iberian Peninsula using spatial interpolation and GIS.International Journal of Climatology 27:1231–42.
Paluzie, E., J. Pons Novell, J. Silvestre, and D. A. Tirado Fabregat. 2009.1020 Migrants and market potential in Spain over the twentieth century: A test of the new economic geography.Spanish Economic Review11(4):243–65. P´erez Moreda, V. 2004. El legado demogr´afico del Antiguo R´egimen. InEl legado econ´omico del antiguo r´egimen en Espa˜na, 121–46. Barcelona:
Cr´ıtica. 1025 Q5
Pires, I. M., and D. Pimentel. 2004. Revisitando a regi˜ao transfronteiric¸a ib´erica: Potencialidades e estrangulamentos nos novos contextos de integrac¸˜ao ib´erica. InV Congresso da Geografia Portuguesa. Portugal: Territ´orios e protagonistas. Lisboa: Associac¸˜ao Portuguesa de Ge´ografos. http://www.apgeo.pt/files/docs/CD V Congresso APG/web/ pdf/xD7- 1030 8 14Out Iva%20Pires-Dulce%20Pimentel.pdf.
Reher, D. S. 1994. Ciudades, Procesos De Urbanizaci´on y Sistemas Urbanos En La Pen´ınsula Ib´erica, 1550–1991. InAtlas Hist´orico De Ciudades Europeas: Pen´ınsula Ib´erica, edited by M. Gu`ardia i Bassols, F. Xavier Moncl´us, and J. Luis Oy´on, 1–30. Barcelona: Salvat. 1035 Ribeiro, O. 1945.Portugal o Mediterrˆaneo e o Atlˆantico: Estudo geogr´afico.
Coimbra: Coimbra Editora.
Rodrigues, T., ed. 2008.Hist´oria da populac¸˜ao portuguesa: Das longas permanˆencias `a conquista da modernidade. Porto: CEPESE (Centro de Estudos da Populac¸˜ao, Economia e Sociedade). 1040 Sen, P. K. 1968. Estimates of the regression coefficient based on Kendall’s
Tau.Journal of the American Statistical Association63(324):1379–89. Silveira, L. Espinha da, D. Alves, N. Miguel Lima, A. Alcˆantara, and J.
Puig. 2011. Population and railways in Portugal, 1801–1930.Journal of Interdisciplinary History42(1):29–52. 1045 Tirado Fabregat, D. A., and M. Badia-Mir´o. 2012. Economic
in-tegration and regional inequality in Iberia (1900–2000): A geo-graphical approach. Working Papers in Economic History (12–03). http://orff.uc3m.es/handle/10016/13688.
Tortella, G. 1994.El desarrollo de la Espa˜na Contempor´anea. Historia1050
Econ´omica de los Siglos XIX y XX. Madrid: Alianza Universidad. Wood, A., and S. Roberts. 2011.Economic geography: Places, networks