15 artigo 491
ORIGINAL ARTICLE
1 – MSc in Orthopedics and Traumatology from the School of Medical Sciences, Santa Casa de São Paulo; Volunteer Physician in the Sports Trauma Group, Santa Casa de São Paulo, São Paulo, SP, Brazil.
2 – Volunteer Physician in the Sports Trauma Group, Santa Casa de São Paulo, São Paulo, SP, Brazil.
3 – Head of the Sports Trauma Group, Department of Orthopedics and Traumatology, School of Medical Sciences, Santa Casa de São Paulo, São Paulo, SP, Brazil. Work performed in the Department of Orthopedics and Traumatology, School of Medical Sciences, Santa Casa de São Paulo, Fernandinho Simonsen Wing (DOT-FCMSCSP). Director: Prof. Dr. Osmar Avanzi
Correspondence: Rua Mantiqueira 230, ap. 84, Vila Mariana, 04110-040 São Paulo, SP. E-mail: [email protected] Work received for publication: February 12, 2011; accepted for publication: August 15, 2011.
ARE THERE DIFFERENCES IN STRENGTH TESTS USING ISOKINETIC
DYNAMOMETRY BETWEEN FIELD AND INDOOR
PROFESSIONAL SOCCER PLAYERS?
Adriano Barros de Aguiar Leonardi1, Mauro Olivio Martinelli2,Aires Duarte Junior3
AbSTRACT
Objective: The objective of this study was to conduct a com-parative analysis on isokinetic strength assessments between field and indoor male professional soccer players and corre-late the findings with the higher levels of injury risk descri-bed in the literature. Methods: We analyzed 16 field soccer players and 15 indoor soccer players. All these professionals were male. Isokinetic muscle strength assessments were made on their knees. Results: The mean weight was 81.81 kg for field soccer and 80.33 kg for indoor soccer. The right and left peak extensor torque left and right for field soccer and indoor soccer were, respectively, 302.50 and 313.31 Nm and 265.20 and 279.80 Nm, and for flexors, 178 and 184.88 Nm and 158.27 and 154 Nm. The peak torque rates according to body weight for the left and right extensors for field soccer and indoor soccer were, respectively, 3.84 and 3.7 Nm/kg
INTRODUCTION
Indoor soccer and field soccer are both very po-pular forms of sports activity and are correlated with high injury rates, accounting for 50 to 60% of all sports injuries, which leads to a high rate of time
off games and training among the players(1). This
may result in economic losses both for players and for clubs. Studies worldwide have reported that the annual expenditure on professional soccer players who are off the game because of sports injuries is around
20 million dollars(2,3). Other studies have also reported
high recurrence rates for soccer injuries, thus resulting
and 3.32 and 3.52 Nm/kg, and for flexors, 2.17 and 2.26 Nm/kg and 1.98 and 1.93 Nm/kg. The balance relationships between flexors and extensors on the right and left sides for field soccer and indoor soccer were, respectively, 59.81 and 59.44% and 60.47% and 54.80%. The relationships for ex-tensors between the right and left sides for field soccer and indoor soccer were, respectively, 11.44 and 9.20%, and for the flexors, 7.31 and 8.80%. Conclusions: In accordance with international parameters, comparative analysis on isokinetic strength assessments between field and indoor male profes-sional soccer players before the season showed that there was muscle balance and low probability of injury. There were no statistically significant differences in the parameters analyzed between the players of the two types of soccer.
Keywords – Isometric Contraction; Soccer; Muscle Strength Dynamometer
The authors declare that there was no conflict of interest in conducting this work
This article is available online in Portuguese and English at the websites: www.rbo.org.br and www.scielo.br/rbort
in longer periods off the game and even greater
decli-nes in performance(1,4). Knowledge of the main risk
factors associated with these injuries would make it possible to develop preventive interventions, thereby diminishing the number of injuries and their negative
consequences for the clubs and for the players(4-6).
Isokinetic evaluation has been used over the last three decades as a method for determining the functio-nal pattern of strength and muscle balance. Although
the term isokinetic was defined in 1967(7),
369
• PKT FLEX R: peak torque of the right flexor muscle;
• PKT FLEX L: peak torque of the left flexor muscle;
• PT/PC EXT R: ratio between peak torque of the
right extensor muscle and the player’s weight;
• PT/PC EXT L: ratio between peak torque of the left
extensor muscle and the player’s weight;
• PT/PC FLEX R: ratio between peak torque of the
right flexor muscle and the player’s weight;
• PT/PC FLEX L: ratio between peak torque of the
left flexor muscle and the player’s weight;
• F/E R: ratio between the peak torques of the right
flexor and extensor muscles;
• F/E L: ratio between the peak torques of the left
flexor and extensor muscles;
• R/L FLEX positive: measurement of flexor muscle
imbalance; and
• R/L EXT positive: measurement of extensor muscle
imbalance.
descriptive analysis
The isokinetic evaluation parameters were sum-marized by means of summary measurement tables (means and standard deviations, for example) and boxplot graphs.
RESULTS
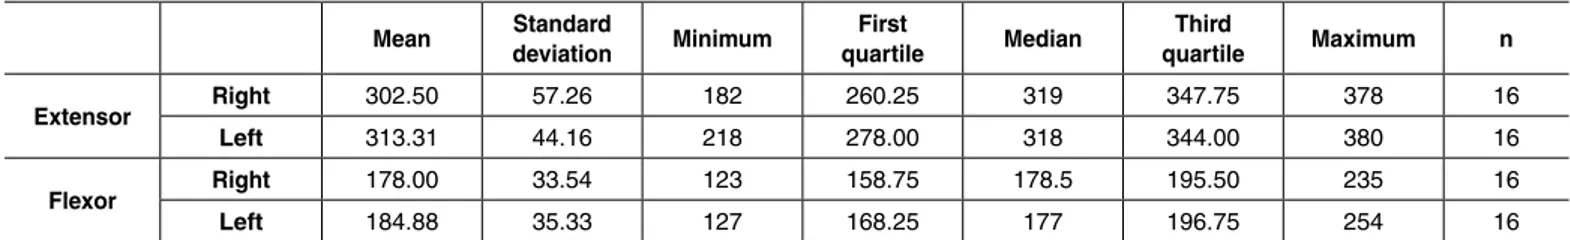
Figure 1 and Table 1 present the PKT measured among the field soccer players. We noted that the peak torque of the extensor muscle group was higher than that of the flexor muscle group. On the other hand, the measurements on the two knees did not differ much, for both muscles. The left knee presented higher peak torque, on average, for both muscles.
FIELD AND INDOOR PROFESSIONAL SOCCER PLAYERS?
among Brazilian sports clubs as a tool for injury
pre-vention, implemented during the preseason period(8,9).
The indications for the examination relate to stu-dying the proportions of agonist and antagonist muscle balance and the difference in agonist muscle groups between one side and the other. The results are grouped in terms of the following: peak torque, analyzing the point of highest torque within the range of movement; work, representing the energy output through muscle effort during movement, expressed in joules (J); po-wer, the result from work achieved divided by time, expressed in watts (W); resistance, obtained when the number of repetitions is greater than or equal to six, representing the energy that uses anaerobic metabo-lism; and the agonist/antagonist balance relationship, i.e. the division between the agonist and antagonist values, in relation to the peak torque, work or power,
expressed as a percentage(7,8).
The agonist/antagonist ratio is an appropriate means for determining whether muscles are in proportion and consequently in balance. In the literature, the reported relationship of flexors to extensors in knees without
injury usually ranges from 55% to 77%(10,11). The main
abnormalities that have been indicated to be risk fac-tors for soccer injuries are asymmetries in the muscle performance parameters between the dominant and nondominant limbs and modifications to the torque
ratio between antagonist muscles(1,5,12).
The aim of the present study was to conduct a comparative analysis on the results from isokinetic strength assessments among field and indoor male professional soccer players.
SAMPLE AND METHODS sample analysis
In this study, 16 field soccer players and 15 indoor soccer players (who were all professionals and all male) underwent isokinetic assessment of knee mus-cle strength. This type of evaluation has been used as a method for determining the functional pattern of muscle strength and balance and for assisting in
rehabilitation of sports injuries(9). During the
isoki-netic evaluation, certain parameters were measured.
description of the variables
We analyzed the following parameters:
• PKT EXT R: peak torque of the right extensor muscle;
• PKT EXT L: peak torque of the left extensor muscle; Figure 1 – Boxplot of peak torque for field soccer players.
Ext
en
so
r p
ea
k
to
rq
ue
Fl
exo
r p
ea
k
to
rq
ue
Figure 2 and Table 2 present the PKT measured among the indoor soccer players. The same that was said regarding the peak torque measured in the ex-tensor and flexor muscle groups of the field soccer players can be said about the indoor soccer players. We also noted lower variability of measurements made on the extensor muscle group, compared with the variability of the measurements made on the fle-xor muscle, in both knees.
From analysis on Table 3 and Figure 3, it could be seen that the PT/PC ratios measured on the extensor muscle group were greater than the PT/PC ratios measu-red on the flexor muscles, for both types of soccer player. The measurements made on the field soccer players also presented greater variability.
Figure 4 and Table 4 present the proportions of the flexor extension balance, both for the left knee and for the right knee, for both types of soccer player. It
could be seen that the variability of the F/E measure-ments on the field soccer players was greater than the variability of the measurements made on the indoor soccer players, reaching twice as much in the left knee. Regarding the right knee, we noted the presence of discrepant points for both types of soccer player (90 and 86% for field and indoors, respectively). On average, the indoor soccer players presented greater muscle balance (60.47%).
Analysis on Figure 5 and Table 5 showed that there were discrepant R/L values for both types of soccer player, in relation to the flexor muscle, and for the in-door soccer players in relation to the extensor muscle. For the extensor muscle, the R/L measurements were, on average, greater among the field soccer players. For the flexor muscle, the R/L measurements were greater for the indoor soccer players. Because of the discrepant values, greater variability was observed in the measurements on the extensor muscles of the indoor soccer players.
inferential analysis
With the aim of investigating whether the isoki-netic evaluation parameters differed between the two types of soccer player, the nonparametric Mann-Whi-tney test was used, which compared the medians of pairs of independent samples. To compare the median values for muscle function (in our case, peak torque), between the left and right sides, the nonparametric Wilcoxon test for paired samples was used.
In comparing the absolute values for muscle func-tion (in our case, peak torque), there were no signifi-cant differences between the left and right knees, for both muscles and both types of soccer player.
Figure 2 – Boxplot of peak torque for indoor soccer players.
Ext
en
so
r p
ea
k
to
rq
ue
Fl
exo
r p
ea
k
to
rq
ue
Right Left Right Left Mean Standard
deviation Minimum
First
quartile Median
Third
quartile Maximum n
Extensor Right 302.50 57.26 182 260.25 319 347.75 378 16
Left 313.31 44.16 218 278.00 318 344.00 380 16
Flexor Right 178.00 33.54 123 158.75 178.5 195.50 235 16
Left 184.88 35.33 127 168.25 177 196.75 254 16
Table 2 – Summary measurements of peak torque for the indoor soccer players. Measurements in Newtons per meter (N/m).
Mean Standard
deviation Minimum
First
quartile Median
Third
quartile Maximum n
Extensor Right 265.20 50.86 129 248.50 269 291.50 345 15
Left 279.80 39.18 207 253.50 280 311.00 335 15
Flexor Right 158.27 33.16 111 135.00 148 184.50 224 15
371
Figure 3 – Boxplot of PT/PC for both types of soccer players.
PT
/PC
fo
r r
ig
ht
e
xt
en
so
r
Field Indoor Type
PT
/PC
fo
r l
ef
t e
xt
en
so
r
Field Indoor Type
Field Indoor
Type Field IndoorType
PT
/PC
fo
r r
ig
ht
fl
exo
r
PT
/PC
fo
r l
ef
t f
le
xo
r
Table 3 – Summary measurements of PT/PC for both types of soccer. Measurements in Newtons per kilogram (Nm/kg).
Mean Standard
deviation Minimum
First
quartile Median
Third
quartile Maximum n
Right extensor
Field 3.70 0.68 2.67 3.24 3.88 4.26 4.61 16
Indoor 3.32 0.53 1.87 3.19 3.36 3.54 4.09 15
Left extensor
Field 3.84 0.56 3.19 3.42 3.745 4.00 5 16
Indoor 3.52 0.47 2.63 3.22 3.56 3.82 4.47 15
Right flexor
Field 2.17 0.35 1.6 1.99 2.16 2.39 2.88 16
Indoor 1.98 0.32 1.61 1.69 1.95 2.15 2.69 15
Left flexor
Field 2.26 0.40 1.72 2.00 2.155 2.39 3.14 16
Indoor 1.93 0.25 1.48 1.75 1.83 2.11 2.39 15
To evaluate differences in peak torque, the para-meter PT/PC (peak torque in relation to the player’s weight) was used. We could affirm that there was a significant difference in PT/PC FLEX L between the two types of soccer player (p = 0.013; median diffe-rence = 0.27 with 95% CI = [0.08; 0.52]).
In relation to the proportions of flexor/extensor muscle balance (F/E), there were no significant diffe-rences, either for the right knee or for the left knee. The same was seen in analyzing the parameter R/L between the types of soccer player.
DISCUSSION
Both field soccer and indoor soccer (known as “futsal” in Brazil), which are sports with simi-lar movements, have gone through a process of improvement of the technical level over recent years. Biomechanical studies, together with greater comprehension of the physiology of the sport have optimized the players’ yield. Field soccer has gained prominence and popularity, and now produces high--performance players rather than the “shooters” of the start of the century.
Figure 4 – Boxplot of F/E for both types of soccer players. Figure 5 – Boxplot of R/L for both types of soccer players.
Ri
gh
t F
/E
Field Indoor
Type Field IndoorType
Le
ft
F/
E
Field Indoor Type
R/
L
ext
en
so
r
Field Indoor Type
R/
L
fle
xo
r
Table 4 – Summary measurements of F/E for both types of soccer. Measurements in percentages (%).
Mean Standard
deviation Minimum
First
quartile Median
Third
quartile Maximum n
Right F/E Field 59.81 11.23 47 51.75 57.5 63.00 90 16
Indoor 60.47 9.72 49 53.50 58 65.50 86 15
Left F/E Field 59.44 10.76 45 52.00 57.5 64.50 84 16
Indoor 54.80 5.48 45 51.00 55 58.50 66 15
Table 5 – Summary measurements of L/R for both types of soccer. Measurements in percentages (%).
Mean Standard
deviation Minimum
First
quartile Median
Third
quartile Maximum n
R/L
extensor
Field 11.44 5.60 2 7.75 12.5 15.25 22 16
Indoor 9.20 10.30 0 4.50 6 11.00 43 15
R/L flexor Field 7.31 4.64 2 3.75 7 9.25 21 16
373
The aim of this study was to conduct a comparative analysis on the results from isokinetic assessment among field and indoor male professional soccer players. The isokinetic apparatus used was a dynamometer in which individuals made maximal or submaximal mus-cle exertion that was accommodated by the resistance of the apparatus. Since these evaluations relate to injury prevention, most clubs have started to use them during
the preseason period(13).
There are several studies worldwide that have characterized soccer players’ muscle performance, especially in relation to the maximum capacity to
produce muscle torque(14,15). In comparison with the
soccer players assessed in those studies, the Brazi-lian players presented better muscle performance in relation to flexion and extension movements in the
knee joint(15,16). We believe that this was due to
me-thodological differences such as the type of dyna-mometer used and/or the players’ positioning during the evaluation. Another possible explanation could be the specific features of training on and off the field (muscle building) that might exist between different countries or between different soccer clubs.
The preventive parameters that we analyzed were the coefficients of peak torque in relation to weight (PKT/PC), peak torque of extensors and flexors and the coefficient between these. As also described in results in the literature, we found mean values that were greater than in the general
po-pulation(3). This difference in the players’ muscle
performance is possibly related to the high physical demands imposed by professional soccer practice. In this case, not only the sport itself but also the training needed to prepare players, like training ses-sions on the field or muscle-building may explain the better muscle performance among players than in the general population.
However, we did not find any studies in the literature comparing the results from strength analysis for the two types of soccer player. In analyzing the peak torque of the flexor and extensor muscles of the right and left sides, we noted that the peak torque of the extensor muscles was higher than that of the flexor muscles. The measurements made on the two knees did not differ much for either of the muscles. We attribute this to the need for kicking strength, which is common to both types of soccer (Table 1 and Figure 1). We attribute the greater variability found in field soccer to the differentiated training between players in different positions, such that endurance
training is directed towards the wingers, midfield defenders and midfielders, while muscle explosion training is directed towards goalkeepers and strikers. These differences are more accentuated in field soccer, because of the longer distances that the players have to cover. We believe that this is also related to the lower variability in the measurements made on the extensor muscle than in measurements on the flexor muscle, in both knees (Table 2 and Figure 2).
We noted greater variability in the PT/PC values of the extensor and flexor muscles, for both types of soccer. We attribute this too to the differentiated trai-ning between the players’ positions. We also believe that this is connected with our observation that the variability of F/E measurements among field soccer players was greater than the variability of the measu-rements made among the indoor soccer players.
In the literature, special attention is given to in-terpreting the results from the relationship between agonist and antagonist muscles. It is accepted that the value of an uninjured muscle group can be considered to be normal, provided that it is the same as, or not more than 10% different from the contralateral muscle
group(9). For performing sports activities, differences
of up to 20% may be accepted. Values for this ratio lower than 60% have been associated with distension
of the hamstrings(5,16).
In the present study, the values observed in the two types of soccer were homogenous, since there was mi-nimal variation in the coefficients of flexion/extension between the right and left sides among the sample studied (Figure 4 and Table 4). However, our results
are inferior to those presented in studies worldwide(9).
Although the players without histories of injuries that we assessed presented values for this ratio of 54.60 to 60.47% in indoor soccer and 59.44 to 59.81% in field soccer, we believe that these findings indicate that these players had agonist/antagonist ratios that were adequate for sports practice.
We also noted that the variability in the F/E mea-surements among the field soccer players was greater than the variability of the measurements on the indoor soccer players, and that they were twice the magnitude in the left knee. On average, indoor soccer players presented greater muscle balance (60.47%). Again, we attribute this to the differentiated training between players in different positions; to the more homogenous training among indoor soccer players, in relation to field soccer players; and to the predominance of right--handed players.
CONCLUSIONS
In accordance with international parameters, this com-parative analysis on the results from isokinetic strength assessments among field and indoor male professional
soccer players showed that muscle balance existed. There were no statistically significant differences in the parameters analyzed between the players of the two types of soccer.
REFERENCES
1. Keller CS, Noyes FR, Buncher CR. The medical aspects of soccer injury epi-demiology. Am J Sports Med. 1987;15(3):230-7.
2. Knapik JJ, Bauman CL, Jones BH, Harris JM, Vaughan L. Preseason strength and flexibility imbalances associated with athletic injuries in female collegiate athletes. Am J Sports Med. 1991;19(1):76-81.
3. Lentell G, Katzman LL, Walters MR. The Relationship between Muscle Function and Ankle Stability. J Orthop Sports Phys Ther. 1990;11(12):605-11. 4. Taylor DC, Dalton JD Jr, Seaber AV, Garrett WE Jr. Experimental muscle strain
injury. Early functional and structural deficits and the increased risk for reinjury. Am J Sports Med. 1993;21(2):190-4.
5. Ekstrand J, Gillquist J. The avoidability of soccer injuries. Int J Sports Med. 1983 May;4(2):124-8.
6. Aagaard P, Simonsen EB, Magnusson SP, Larsson B, Dyhre-Poulsen P. A new concept for isokinetic hamstring: quadriceps muscle strength ratio. Am J Sports Med. 1998;26(2):231-7.
7. Hislop HJ, Perrine JJ. The isokinetic concept of exercise. Phys Ther. 1967;47(2):114-7.
8. Greve JM, Terreri AS, Plapler PG. [Evaluation of isokinetic trunk flexion and extension in normal sportsman and sedentary people]. Rev Hosp Clin Fac Med Sao Paulo. 1997;52(3):154-8.
9. Terreri AS, Ambrósio MA, Pedrinelli A, Albuquerque RF, Andrusaitis F, Greve JM, et al. Isokinetic assessment of the flexor-extensor balance of the knee in
athletes with total rupture of the anterior cruciate ligament. Rev Hosp Clin Fac Med Sao Paulo. 1999;54(2):35-8.
10. Grace TG, Sweetser ER, Nelson MA, Ydens LR, Skipper BJ. Isokinetic muscle imbalance and knee-joint injuries. A prospective blind study. J Bone Joint Surg Am. 1984;66(5):734-40.
11. Harilainen A, Alaranta H, Sandelin J, Vanhanen I. Good muscle performance does not compensate instability symptoms in chronic anterior cruciate ligament deficiency. Knee Surg Sports Traumatol Arthrosc. 1995;3(3):135-7. 12. Heidt RS Jr, Sweeterman LM, Carlonas RL, Traub JA, Tekulve FX. Avoidance of
soccer injuries with preseason conditioning. Am J Sports Med. 200;28(5):659-62. 13. Fonseca ST, Ocarino JM, Silva PLP, Bricio RS, Costa CA, Wanner LL.
Carac-terização da performance muscular em atletas profissionais de futebol. Rev Bras Med Esporte. 2007 13 (3): 143-7.
14. Alonso AC, Greve JMD, Macedo OG, Pereira CAM, Souza DCM. Avaliação isocinética dos inversores e eversores de tornozelo: Estudo comparativo entre atletas de futebol e sedentários normais. Rev Bras Fisiot. 2003;7(3):195-9. 15. Zakas A, Mandroukas K, Vamvakoudis E, Christoulas K, Aggelopoulou N. Peak
torque of quadriceps and hamstring muscles in basketball and soccer players of different divisions. J Sports Med Phys Fitness. 1995;35(3):199-205. 16. Perrin DH, Robertson RJ, Ray RL. Bilateral isokinetic peak torque, torque