UNIVERSIDADE FEDERAL DA PARAÍBA CENTRO DE CIÊNCIAS EXATAS E DA NATUREZA
PROGRAMA DE PÓS-GRADUAÇÃO EM CIÊNCIAS BIOLÓGICAS ÁREA DE CONCENTRAÇÃO EM ZOOLOGIA
Emmanuel Messias Vilar Gonçalves da Silva
Heterogeneidade das comunidades de morcegos da Mata Atlântica brasileira
João Pessoa
UNIVERSIDADE FEDERAL DA PARAÍBA CENTRO DE CIÊNCIAS EXATAS E DA NATUREZA
PROGRAMA DE PÓS-GRADUAÇÃO EM CIÊNCIAS BIOLÓGICAS ÁREA DE CONCENTRAÇÃO EM ZOOLOGIA
Emmanuel Messias Vilar Gonçalves da Silva
Heterogeneidade das comunidades de morcegos da Mata Atlântica brasileira
João Pessoa
2015
Dissertação apresentada ao Programa de
Pós-graduação em Ciências Biológicas,
área de concentração Zoologia, da
Universidade Federal da Paraíba, como
parte dos requisitos para obtenção do Grau
de Mestre em Ciências Biológicas
(Zoologia).
S586h Silva, Emmanuel Messias Vilar Gonçalves da.
Heterogeneidade das comunidades de morcegos da Mata Atlântica brasileira / Emmanuel Messias Vilar Gonçalves da Silva.- João Pessoa, 2015.
82f. : il.
Orientador: Pedro Cordeiro Estrela Dissertação (Mestrado) - UFPB/CCEN
1. Zoologia. 2. Ametrida centurio. 3. Betadiversidade. 4. Biogeografia. 5. Chiroptera. 6. Metacomunidades.
Emmanuel Messias Vilar Gonçalves da Silva
Heterogeneidade das comunidades de morcegos da Mata Atlântica brasileira
Dissertação apresentada ao Programa de Pós-graduação em Ciências Biológicas, área de concentração Zoologia, da Universidade Federal da Paraíba, como parte dos requisitos para obtenção do Grau de Mestre em Ciências Biológicas (Zoologia).
BANCA EXAMINADORA
__________________________________________________
Dr. Pedro Cordeiro Estrela de Andrade Pinto Universidade Federal da Paraíba
(Orientador)
__________________________________________________
Dr. Bráulio Almeida Santos Universidade Federal da Paraíba
(Examinador Interno)
__________________________________________________
Dr. Luiz Augustinho Menezes da Silva
“Ser livre. Ser causa de si próprio, poder dizer: sou porque quero; ser o próprio
começo.”
SATRE, Jean-Paul
AGRADECIMENTOS
Agradeço,
A todas as pessoas que de alguma forma dedicaram algum tempo de sua existência para reconhecer a minha e de alguma forma fazer com que esta dissertação fosse realizada.
Especialmente aos meus pais, Josuel Gonçalves e Marlene Vilar por tudo, por tudo mesmo. As minhas irmãs Joseane e Juliana e aos meus cunhados, Luciano e Claudionor pelo companheirismo e torcida para que tudo desse certo.
Aos meus sobrinhos e sobrinhas: Alfredo, Eduardo, Samuel, Sara e Sofia por terem tornado todo o processo mais leve.
Aos meus amigos, grandes amig@s de longas ou curtas datas que acreditaram e torceram por mim e estiveram comigo nos momentos mais alegres, felizes e emocionantes de minha existência, sintam-se aqui todos representados e representadas.
A Luiz Augustinho (sempre vou agradecê-lo), por ter iniciado uma revolução acadêmica na minha vida e por ter me apresentado aos animais mais incríveis que habitam este planeta.
A Arthur Domingos que me incentivou a não perder tempo e me inscrever rapidamente neste Programa de Pós-Graduação.
A Teone Pereira pelo companheirismo e grande ajuda nos momentos de aperto para que eu conseguisse está aqui hoje.
A todos os Professores e Professoras da graduação que me ajudaram no que foi possível para facilitar minha entrada no mestrado.
A Bruno Brandão pelo amor, apoio, força e encorajamento.
A Paloma Albuquerque pelo apoio, acolhimento, cuidado e carinho que me acompanha até hoje, igualmente agradeço a Thaís de Souza e Nathália Ardente.
A Jorge Clésio pelo companheirismo, carinho, amizade e pelo amor perseverante entre um campo e outro e por ter proporcionando momentos lindos que não vou esquecer jamais.
A Genivaldo dos Reis Neto, pelo companheirismo, amizade e força. Pela paciência de encarar cada dia alegre ou triste do meu cotidiano e por ter sido também minha família nestes últimos tempos.
Guga, Paulinha, Fafá, Suênia, Rafa (sem queimar o bigode), Erika (ainda vamos pegar o 5310 juntos novamente) e Layla (as melhores gargalhadas).
A Thaís Kubik, pelo acolhimento, companheirismo, carinho e sobretudo paciência em me ajudar a realizar as análises mais loucas que alguém pode fazer (estas não foram só estatísticas), por me escutar, consolar e me incentivar a fazer as coisas mais belas, além de me mostrar o verdadeiro significado de LUTA.
Agradeço aos estagiários Ewerth Vasconcelos e Natan Diego pela grande ajuda e dedicação a este trabalho.
A todas e todos que compõem o Laboratório de Mastozoologia da UFPB, pela ajuda e convívio no dia a dia.
A Hannah Larissa e Anderson Feijó, por terem me confiado seus materiais pessoais para que eu realizasse meus campos, além do apoio, amizade e força em todo o processo.
À Renata Pires (Renatinha), Vitor Araújo, Julião, Margarida Furquim, Wendy Santos, Raissa Peixoto, Fernando Carneiro, Mayara Beltrão, Alexandro Guterres, Elson Rios, Larissa Lima, Hermes Schmitz, Duílio Lobo, Bianca Tribes, Maria Júlia, Karla Morgana, Márcio Sales, Sinthia Ito, Gabriella Jacob, Lais Ortiz, João, Ana Cláudia Delciellos, Marcelo Weksler e Thiago Cardoso pela grande ajuda nos trabalhos de campo.
A toda a equipe da FIOCRUZ em especial a Sócrates Neto pelo apoio em todas as coletas. A todos que integram e integraram as equipes do PPBio da Mata Atlântica em todas as campanhas do ano de 2014.
A Fabiana Rocha pelo carinho, ajuda, palavras de conforto e pelo melhor presente que eu poderia ter ganhado em um campo (depois do Ametrida centurio, claro!).
Aos Professores Martín Alvarez e Sérgio Altoff pelo apoio e pelos valiosos ensinamentos. Agradeço a todas as pessoas que decidiram de alguma forma dedicar parte de sua existência, para estudar os mamíferos voadores.
A Josias Xavier por ser Josias Xavier o melhor secretário que um Programa de Pós-Graduação pode ter.
Aos Coordenadores e Professores (as) do PPGCB – UFPB.
A Professora Maria Regina pelo apoio e sugestões mais do que valiosas.
A todos que compõem a banca, que aceitaram estar em minha defesa para contribuir o máximo possível.
A CAPES pela concessão da bolsa.
APRESENTAÇÃO
Escrever um trabalho acadêmico não é fácil, tão pouco se dá de forma instantânea e mágica. Procurei escrever esta dissertação no tempo que me coube, da forma mais eficiente e minuciosa possível, afim de proporcionar ao leitor um texto fluido e bem entrelaçado.
Esta Dissertação está estruturada em capítulos, onde cada capítulo consta de um artigo científico. O artigo que já foi publicado também consta em anexo, com o layout da revista na integra. O trabalho como um todo foi estruturado para publicação on-line, logo algumas imagens para alguns(a) leitores(a) podem estar demasiado pequenas ou visualmente incoerentes, porém procurei ao máximo deixá-las em um tamanho ideal, respeitando as proporções do documento.
O primeiro capítulo “Heterogeneity of bat communities in the brazilian atlantic forest” será submetido à revista Divertity and Distributions ou a Journal of Biogeography e consta de uma análise espacial da heterogeneidade das comunidades de morcegos ao longo da Mata Atlântica brasileira, por meio de dados provenientes de literatura.
O segundo capítulo “Distribution extension of Ametrida centurio Gray, 1847 (Chiroptera, Phyllostomidae): First record in the Brazilian Atlantic Forest.” está publicado na revista Check List e consta de uma nota de extensão de distribuição geográfica.
RESUMO
A Mata Atlântica abriga cerda de 1-8% de toda a flora e fauna do mundo. Em particular os morcegos deste bioma representam cerca de 64% do total de espécie de quirópteros do Brasil. Dados sobre a composição e abundância de espécies de comunidades de morcegos nunca foram sintetizados e analisados, assim como dados a cerca da distribuição espacial e estruturação das comunidades de morcegos neste bioma, sobretudo quanto a sua dissimilaridade sob uma perspectiva de metacomunidade que pode ser amplamente definida como um conjunto de comunidades ecológicas em locais diferentes (potencialmente, mas não necessariamente ligados por dispersão), enquanto que uma comunidade é um grupo de espécies em um determinado local. Em vista disto busquei avaliar o padrão espacial de coletas realizadas neste bioma e a estruturação das comunidades de morcegos ao longo da Mata Atlântica brasileira, quanto a sua beta diversidade. Para tanto reuni um banco de dados de 57 artigos somando 342 localidades através de revisão da literatura. Realizei estatísticas voltadas a distribuição espacial de coletas, do esforço amostral (mediana: 19140h.m²) e para a análise de beta diversidade e metacomunidades. Os resultados apontam que existem coletas em toda a Mata Atlântica com focos de maior densidade no PR, sul do RJ, PB-PE, sul da BA. Lacunas de amostragem publicadas se encontram no ES, AL,SC e RS. As comunidades de morcegos ao longo da Mata Atlântica brasileira tem uma heterogeneidade alta (~0.9) explicada principalmente pelo componente de Turnover e com um baixo componente de aninhamento. Este resultado é valido para analises em 4 escalas espaciais: localidades, grades de 2,5º, 5º e entre as 4 regiões biogeográficas da Mata Atlântica. A estruturação das matrizes de ocorrência de espécies por unidade amostral (como definido acima) apresentam uma estruturação aleatória (não coerente), sem gradiente latitudinal. Oito inventários foram realizados nas quatro regiões biogeográficas da Mata Atlântica dentro do projeto Rede BioMA Inventários: Padrões de diversidade, biogeografia e endemismo de espécies de mamíferos, aves, anfíbios, drosófilas e parasitos na Mata Atlântica (CNPq/PPBIO) na estação chuvosa totalizando um esforço de 99.600 m²h. Foram coletados 935 morcegos, assim como amostras de tecidos para fins de extração de A.D.N. e de diagnósticos parasitológicos de tripanossomatideos (T. cruzi et Leishmania spp.),
Hantavirus e Helmintos. A localidade com maior riqueza de foi a APA do Pratigi BA, seguido da Rebio Guaribas, PB; Serra dos Orãos, RJ e Parque Estadual da Serra do Tabuleiro, SC. Registrei a primeira ocorrência do morcego Ametrida centurio Grey, 1847 para a Mata Atlântica, estendendo sua distribuição em mais de 1000 quilômetros. O espécime foi coletado utilizando redes de dossel a 9m na REBIO Guaribas.
ABSTRACT
The Atlantic Forest is home bristle 1-8% of all the flora and fauna of the world. In particular bats this biome represent about 64% of all species of bats in Brazil. Data on the composition and abundance of species of bat communities have never been synthesized and analyzed, as well as data about the spatial distribution and structure of bat communities in this biome, especially as their dissimilarity in a meta community perspective that can be broadly defined as a set of ecological communities in different locations (potentially, but not necessarily connected by dispersion), while a community is a group of species in a given location. In view of this I sought to evaluate the spatial pattern of collections made in this biome and the structuring of bat communities along the Brazilian Atlantic Forest, as its beta diversity. Therefore gather a database of 57 articles totaling 342 locations through literature review. Realized statistics focused on spatial distribution of sampling, the sampling effort (median: 19140h.m²) and for the analysis of beta diversity and metacomunidades. The results show that there are collections across the Atlantic Forest with higher density in PR outbreaks, south of Rio de Janeiro, PB-PE, south of Bahia. Sampling gaps are reported in ES, AL, CS and RS. The bat communities along the Brazilian Atlantic Forest has a high heterogeneity (~ 0.9) mainly due to the turnover component and a low component of nesting. This result is valid for analysis in four spatial scales: locations, grid 2.5°, 5 and between 4 biogeographic regions of the Atlantic. The structure of arrays of occurrence of species per sample unit (as defined above) presentam a random structure (non-coherent) without latitudinal gradient. Four inventories were conducted in four biogeographical regions of the Atlantic Forest biome within the project Network Inventory: diversity patterns, biogeography and endemic species of mammals, birds, amphibians, fruit flies and parasites in the Atlantic Forest (CNPq / PPBIO) in the rainy season totaling a 99.600 h.m² effort. 935 bats were collected, and tissue samples for DNA extraction purpose and parasitological diagnosis of trypanosomes (T. cruzi et Leishmania spp.), Hantavirus and helminths. The place with the highest species richness was the APA Pratigi BA, followed by Rebio Guaribas, PB; Serra dos Orãos, RJ State Park and the Sierra Board, SC. Recorded the first occurrence of the bat Ametrida centurio Grey, 1847 for the Atlantic Forest, extending its distribution in more than 1000 km. The specimen was collected using canopy networks to 9m in REBIO Guaribas.
LISTA DE FIGURAS
Capítulo 1
Fig. 1 A. Distribution of the distance between paired locations in km, median (dashed line) = 558.9 km B. Distribution of the sampling effort in m²/h, median (dashed line) = 19140._______________________________________________________________________ 34
Fig. 2. Kernel density estimation map of bat sampling sites in the Brazilian Atlantic Forest. Federal states : CE – Ceará, PB – Paraíba, PE – Pernambuco, AL – Alagoas, SE – Sergipe, BA – Bahia, MG – Minas Gerais, ES – Espírito Santo, RJ – Rio de Janeiro, SP – São Paulo, PR – Paraná, SC – Santa Catarina, RS – Rio Grande do Sul.__________________________________________________ 34
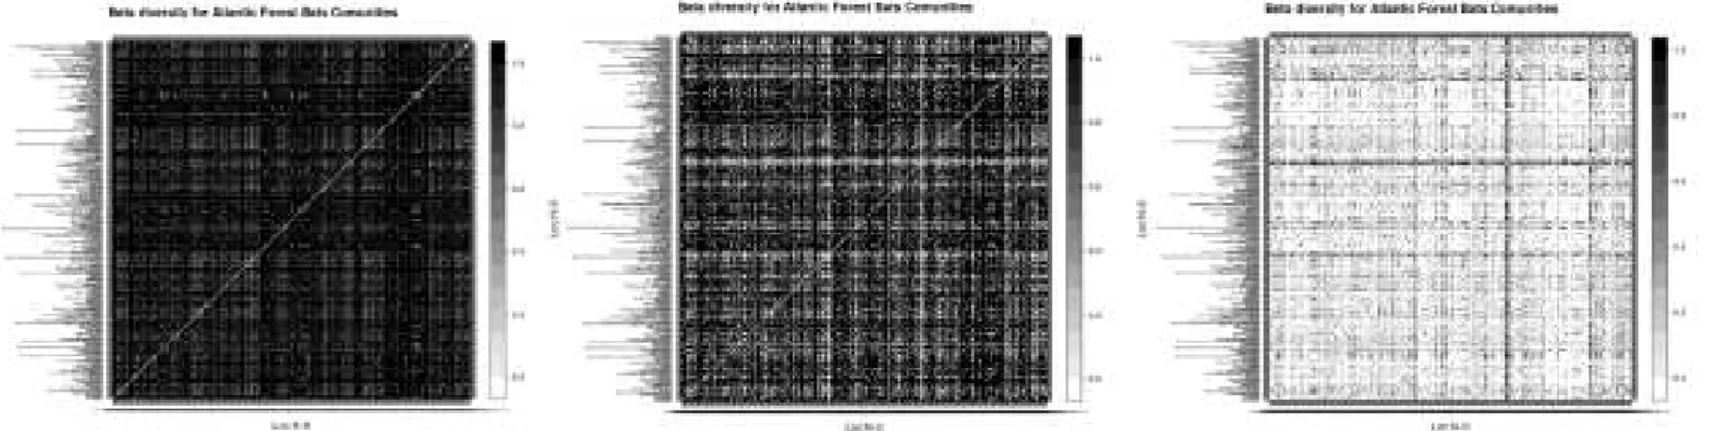
Fig. 3. Pairwise beta diversity matrix for localities. From left to right respectively: Sorensen, Turnover and Nestedness._________________________________________________________ 36
Fig. 4. Pairwise beta diversity matrix for 2.5º grids. From left to right respectively: Sorensen, Turnover and Nestedness._________________________________________________________ 36
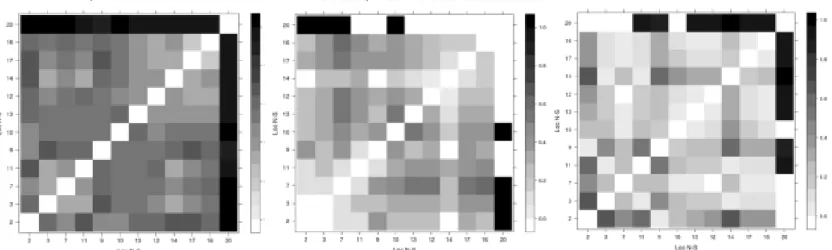
Fig. 5. Pairwise beta diversity matrix for Grids 5º. From left to right respectively: Sorensen, Turnover and Nestedness._________________________________________________________ 37
Fig. 6. Pairwise beta diversity matrix for biogeographic regions. From left to right respectively: Sorensen, Turnover and Nestedness.________________________________________________ 37
Fig. 7. Autocorrelogram between the pairwise beta diversity values for localities and paired geographic distances. Black triangle = Nestedness, black circle = Simpson, white circle = Sorensen._____________________________________________________________________ 38
Fig. 9. Autocorrelogram between the pairwise beta diversity values for Grid's 5º and paired geographic distances. Black triangle = Nestedness, black circle = Simpson, white circle = Sorensen._____________________________________________________________________ 39
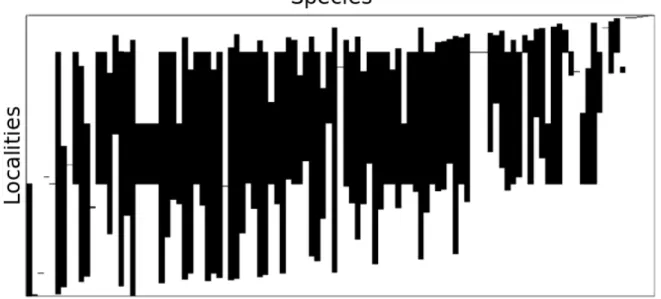
Fig. 10. The latitudinally ordered matrix of sites (rows) by species (columns). Black rectangles indicate a species occurrence at a site.______________________________________________ 39
Capítulo 2
Figure 1. Marginal Localities reported to Ametrida centurio, including the new record for the Atlantic Forest in the state of Paraíba (star): (1) Guaribas Biological Reserve, Mamanguape, Paraíba (present study); (2) Belém, Pará (Brazil), type locality (Gray 1847); (3) Serra do Roncador, Mato Grosso (Pine et al. 1970); (4) Santa Luzia do Pacuí, Macapá, Amapá (Peracchi et al. 1984); (5) 80km north of Manaus, Amazonas (Bernard 2001); (6) Cayenne, French Guiana (Brosset and Charles-Dominique 1991); (7) Moengo, Surinam (Gardner 2008); (8) Kartabo, Guyana (Gardner 2008); (9) Distrito Federal, Pico Avila, 5 Km NNW Caracas, Venezuela (Gardner 2008); (10) Barro Colorado Island, Canal Zone, Panama (Reid 1997).____________________________________ 49
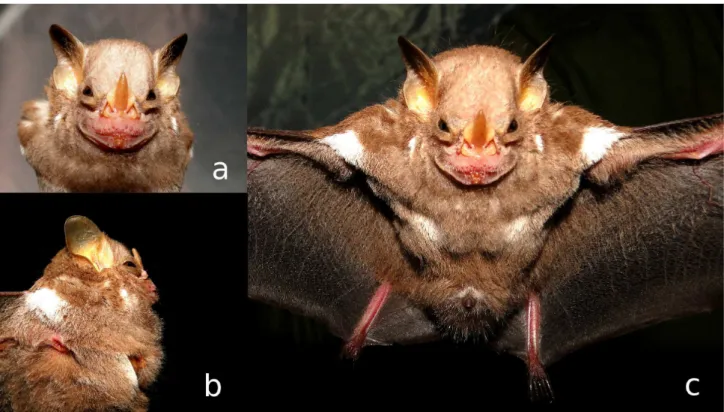
Figure 2. Adult male of Ametrida centurio (UFPB 9154) from Guaribas Biological Reserve, municipality of Mamanguape, state of Paraíba, northeastern Brazil (a) Detail of the face, especially the yellowish iris (b) Lateral view, highlighting the glands below the armpits (c) Frontal view, especially the white spots on the shoulders, chest and the semi-circular spot around the penis. The left foot was not properly lit to appear in image c. (Photos by E. M. Vilar).__________________ 50
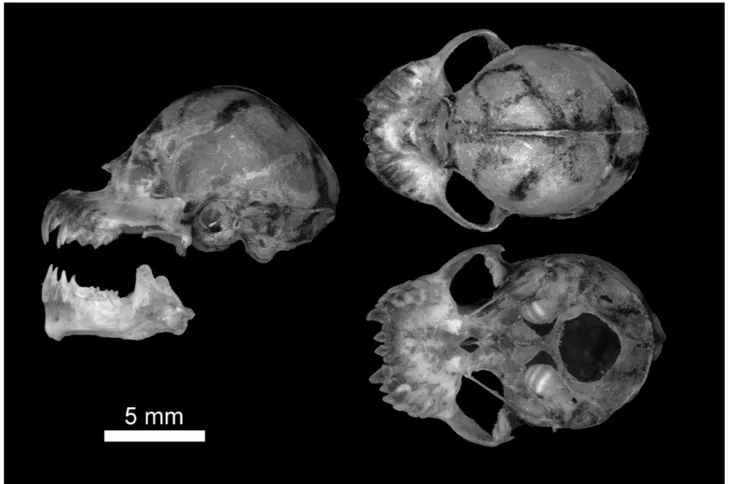
Figure 3. Skull of Ametrida centurio (UFPB 9154) on lateral dorsal and ventral views and mandible on lateral view._________________________________________________________________ 52
Capítulo 3
LISTA DE TABELAS
Capítulo 1
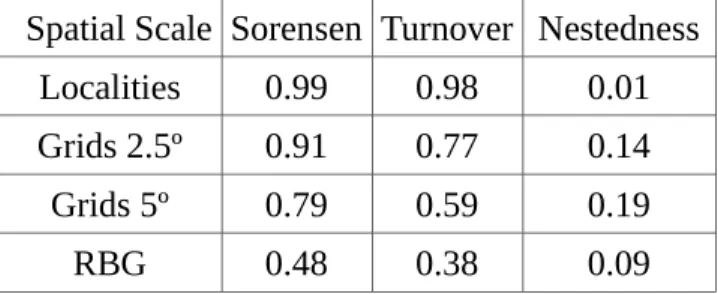
Table 1. Beta diversity values (Sorensen's index) computed between units of increasing spatial scale (Localities, 2.5º, 5º grids, and biogeographical regions- RBG) and their elements turnover and Nestedness.___________________________________________________________________ 35
Capítulo 2
Table 1. External and cranial measurements (in grams [Body mass] and millimeters) of the Ametrida centurio collected in the Atlantic Forest, compared with measurements provided by Peterson (1965), N (sample size).__________________________________________________ 51
Capítulo 3
Tabela 1. Dados em números gerais para coletas realizadas durante dez noites consecutivas na Reserva Biológica Guaribas.______________________________________________________ 65
Tabela 2. Lista de espécies e suas abundâncias, para a Reserva Biológica Guaribas.__________ 65
Tabela 3. Dados em números gerais para coletas realizadas durante dez noites consecutivas na Reserva Biológica Guaribas.______________________________________________________ 66
Tabela 4. Lista de espécies e suas abundâncias, para a Reserva Biológica Guaribas.__________ 66
Tabela 5. Dados em números gerais para coletas realizadas durante dez noites consecutivas na APA Pratigi._______________________________________________________________________ 67
Tabela 6. Lista de espécies e suas abundâncias, para a APA Pratigi._______________________ 67
Tabela 8. Lista de espécies e suas abundâncias, para a APA Pratigi._______________________ 68
Tabela 9. Dados em números gerais para coletas realizadas durante dez noites consecutivas no Parque Nacional da Serra dos Órgãos.______________________________________________ 69
Tabela 10. Lista de espécies e suas abundâncias, para o PARNASO._______________________ 69
Tabela 11. Dados em números gerais para coletas realizadas durante dez noites consecutivas no Parque Nacional da Serra dos Órgãos.______________________________________________ 70
Tabela 12. Lista de espécies e suas abundâncias, para o PARNASO._______________________ 70
Tabela 13. Dados em números gerais para coletas realizadas durante dez noites consecutivas no Parque Estadual Serra do Tabuleiro.________________________________________________ 71
Tabela 14. Lista de espécies e suas abundâncias, para o Parque Estadual Serra do Tabuleiro._____________________________________________________________________ 71
Tabela 15. Dados em números gerais para coletas realizadas durante dez noites consecutivas no Parque Estadual Serra do Tabuleiro.________________________________________________ 72
SUMÁRIO
Introdução Geral _________________________________________________ 17
Literatura citada _
___________________________________________________ 22
Objetivos ________________________________________________________ 26
Capítulo 1:
Heterogeneity of bat (chiroptera) communities in the Brazilian Atlantic Forest.___27
Introdução
________________________________________________________ 28
Métodos
__________________________________________________________ 30
Resultados
________________________________________________________ 33
Discussão
_________________________________________________________ 41
Conclusões
________________________________________________________ 42
Literatura citad
a ____________________________________________________ 44
Capítulo 2:
Distribution extension of Ametrida centurio Gray, 1847 (Chiroptera, Phyllostomidae): First record in the Brazilian Atlantic Forest. ________________________________________48
Literatura citada
_____________________________________________________ 55
Capítulo 3:
Morcegos da Mata Atlântica: Banco de dados de coletas na construção de um “Data paper”. _____________________________________________________________________59
Introdução __________________________________________________________________
60
Métodos empregados na coleta de dados ___________________________________________
62
Resultados __________________________________________________________________
66
Literatura citada ______________________________________________________________
73
INTRODUÇÃO GERAL
1. Mata Atlântica
Mata Atlântica é o nome popular dado a floresta tropical atlântica que ocupa a fachada oriental do Brasil e grande parte da bacia do Paraná (Pereira, 2009). Segundo Rizzini (1997), só no Brasil a Mata Atlântica cobria uma área de aproximadamente 1.400.000km2, estendendo-se por uma
larga faixa latitudinal ao longo da costa brasileira, do Rio Grande do Norte ao Rio Grande do Sul. Mais de 75% de sua área era formada por florestas, com enclaves de campos rupestres, caatingas, matas secas xeromórficas, cerrados, mangues e restingas. A Mata Atlântica se destaca de todas as florestas tropicais ombrófilas do mundo, por sua longa distribuição linear ao longo da costa brasileira, pela sua heterogeneidade de habitats, pelo seu isolamento de outras florestas ombrófilas do continente e pelo seu alto grau de fragmentação que a qualifica como um dos 34 hotspots para conservação (Mittermeier et al. 2005). Hoje restam apenas 11-16% da sua área original (Ribeiro et al. 2009). Grande parte dessa floresta remanescente já teria sido devastada, apresentando-se atualmente na condição de mata secundária. As matas originais acham-se acantonadas nas gargantas do relevo, nos grotões e nas escarpas altas e muito íngremes, lugares de difícil acesso, onde a ocupação humana torna-se quase inviável e desinteressante (Pereira, 2009). Sua composição florística é extremamente variada, com grande biodiversidade, tanto em termos taxonômicos como em termos de formas de vida e de tamanho dos vegetais. Sua estrutura horizontal ostenta forte densidade, um caráter de mata fechada, além da exuberância permanente da vegetação, verde e viçosa o ano todo, característica atribuída à ausência de um período de repouso vegetativo anual, fato inerente às regiões tropicais úmidas e superúmidas (Pereira, 2009).
Norte do Rio Doce/Jequitinhonha, ao Sul deste e ao norte do Paraiba do Sul/ Tiête e ao sul deste ultimo. As cinco áreas atendem a esse critério, incluindo as florestas úmidas do Nordeste (Brejos Nordestinos, Pernambuco, Diamantina e Bahia) e a cadeia de montanhas costeira (Serra do Mar) (Silva e Casteleti, 2005). Mais recentemente de la Sancha et al. (2014) testaram a resposta das comunidades de pequenos mamíferos a este zoneamneto, confirmando o padrão biogeografico proposto acima. A métrica utilizada foi a betadiversidade.
2. β-diversidade e estruturação de comunidades
Embora a diversidade pareça o conceito ecológico mais bem estudado e intuitivo, nenhuma definição consensual foi formulada (Ricotta 2005). Definições quantitativas de diversidade incluem um grande número de métricas (Tuomisto 2010a). No nível das espécies pode-se falar, então, da diversidade de espécies, que inclui a variedade e a abundância relativa das espécies.
A riqueza e a abundância de espécies são os elementos mais recorrentemente utilizados para caracterizar a diversidade alfa, que pode ser expressa por meio de índices, ou métricas. Cada índice possui uma estrutura matemática e uma unidade de medida, podendo representar diferentes fenômenos ecológicos (Tuomisto, 2010a). Cabe salientar que o melhor índice de diversidade a ser utilizado depende do contexto e pergunta que se está tentando responder (Gorelick, 2011; Moreno e Rodrigues, 2011). A maioria das medidas propostas para comparar a diversidade entre comunidades biológicas incorpora os componentes de diversidade alfa (diversidade local) e gama (diversidade total), cujas relações aditiva ou multiplicativa geram a métrica de betadiversidade (Baselga, 2010; Tuomisto, 2010a). Apesar da vasta discussão na literatura e da não existência de consenso sobre a betadiversidade representar, de fato, uma medida de diversidade (Magurran, 2004; Jost, 2006; Tuomisto, 2010a, b), diferentes medidas de betadiversidade podem revelar diferentes fenômenos responsáveis pela estruturação das comunidades (Tuomisto, 2010a). No geral, a betadiversidade pode ser interpretada como uma medida da dissimilaridade ou heterogeneidade das unidades amostrais, ou das comunidades biológicas (Jost, 2007; Tuomisto, 2010a). A betadiversidade também pode indicar o número de unidades composicionais que formam a região de estudo (Tuomisto, 2010a). Essas unidades composicionais indicam o grau de regionalização da biodiversidade.
informativa quando estes mesmos índices são construídos com os elementos substituição (“turnover”) e aninhamento (“nestedness”) de espécies (e.g., Baselga e Orme, 2012), ambos fenômenos estruturadores da diversidade. A substituição e a entropia, elementos estruturadores das comunidades biológicas, podem indicar a a) dissimilaridade, ou b) o grau de heterogeneidade, c) diferenciação e d) complementaridade das comunidades biológicas, resultante de processos ecológicos e evolutivos (Pielou, 1984; Webb et al., 2002). Mais especificamente:
1) O “turnover” de espécies, que se constitui na ocorrência da mudança ou substituição de espécies (Tuomisto, 2010b), pode ocorrer devido a extinções e especiações decorrentes de eventos históricos (Baselga, 2012) ou eventos populacionais, como imigração e emigração de indivíduos (Kneitel e Chasen, 2004; Starzomski et al., 2008). Estes eventos são caracterizados como estocásticos (Chase, 2007);
2) A entropia de uma determinada composição de espécies (também denominada unidade composicional; Tuomisto, 2010a). Indica o nível de organização da comunidade, e pode ser interpretada e medida a partir de padrões filogenéticos aleatórios (baixa organização) ou não aleatórios (alta organização);
3) O aninhamento, um padrão ecológico em que comunidades com menor riqueza de espécies são um subconjunto das comunidades mais ricas (Almeida- Neto et al., 2008). É também considerado como o oposto ao “turnover” (Baselga, 2010).
Estes três elementos (“turnover”, entropia e aninhamento), operando em uma escala local (logo, na diversidade alfa), podem, portanto, gerar padrões de diversidade em uma escala regional (Tuomisto, 2010a). Mais especificamente, a abordagem sobre entropia é fundamental para interpretação da composição de espécies da comunidade, bem como de sua estrutura e diversidade filogenética (Webb et al., 2002). Dependendo da amplitude da variação ambiental, da distância geográfica entre comunidades e das interações interespecíficas, o “turnover” de espécies pode também indicar um “turnover” na estrutura filogenética da comunidade (Graham e Fine, 2008), sendo detectado através de mudanças na filobetadiversidade (também compreendida como dissimilaridade evolutiva entre comunidades; Leprieur et al., 2012).
Wilson, 1967) e a distribuição latitudinal da diversidade de espécies (Brown, 1995). Estes exemplos de teorias heurísticas na ecologia de comunidades, contribuíram consideravelmente para a compreensão espácio temporal dos padrões de diversidade biológica (Rosenzweig, 1995; Magurran, 2004). Dentro deste quadro os morcegos são um componente importante da fauna Neotropical, em termos numéricos de diversidade e que operam importantes funções ecosistemicas. Apesar destas características nenhuma análise abordou a diversidade da comunidade de morcegos no bioma Mata Atlântica.
3. Morcegos na Mata Atlântica
Os morcegos constituem o grupo de mamíferos mais diversificado do mundo após os roedores. No Brasil são conhecidas 9 famílias, 68 gêneros e 178 espécies (Paglia et al. 2012, Nogueira et al. 2014). São animais de grande significado ecológico na regulação dos ecossistemas tropicais, pois participam efetivamente no controle das populações de insetos, dispersão de sementes e polinização, atuando assim na recuperação de áreas degradadas.
Em diversas comunidades tropicais e subtropicais, os morcegos constituem o grupo de mamíferos mais numeroso, tanto em espécies como em indivíduos, representando 40 a 50% das espécies de mamíferos em diversas regiões tropicais. A floresta atlântica, por exemplo, destaca-se por abrigar grande parte da diversidade de morcegos do Brasil, com mais de 64% do total de morcegos para o país (Paglia et al. 2012). É característica deste bioma a presença de muitas espécies raras, das cinco espécies consideradas vulneráveis no Brasil, quatro delas estão na Mata Atlântica: Lasiurus ebenus, Lonchophylla bokermanni, Myotis ruber e Platyrrhinus recifinus. Outras oito espécies deste bioma são consideradas Deficientes em Dados para que seu status de conservação seja definido (Machado et al. 2008).
A partir das características biológicas dos morcegos, alta vagilidade, longo tempo de geração e especialização trófica diversificada espera-se observar, comunidades discretas em termos de estruturação de comunidades (Clementsian), tal como demonstra Presley & Willig (2010) e Presley
LITERATURA CITADA
Almeida-Neto, M., Guimarães, P., Guimarães Jr, P. R., Loyola, R. D. e Ulrich, W. 2008. A consistent metric for nestedness analysis in ecological systems: reconciling concept and measurement. Oikos, 117: 1227-1239.
Arita, H.T., Vargas-Barón, J. and Villalobos, F. (2014) Latitudinal gradients of genus richness and endemism and the diversification of New World bats. Ecography, 37: 1024–1033. (doi: 10.1111/ecog.00720)
Baselga, A. 2010. Partitioning the turnover and nestedness components of beta diversity. Global Ecology and Biogeography, 19: 134–143.
Baselga, A. 2012. The relationship between species replacement, dissimilarity derived from nestedness, and nestedness. Global Ecology and Biogeography, 21, 1223–1232.
Baselga, A. e Orme, C. D. L. 2012. betapart: an R package for the study of beta diversity. Methods in Ecology and Evolution, 3: 808–812.
Batalha-Filho H, Cabanne GS, Miyaki CY. 2012. Phylogeography of an Atlantic forest passerine reveals demographic stability through the last glacial maximum. Molecular Phylogenetics and
Evolution, 65:892–902.
Brown, J.H. 1995. Macroecology. University of Chicago, Chicago, p. 269.
Carnaval, A.C., Hickerson, M.J., Haddad, C.F.B., Rodrigues, M.T. & Moritz, C. 2009. Stability predicts genetic diversity in the Brazilian Atlantic forest hotspot. Science, 323: 785–789.
Chase, J. M. 2007. Drought mediates the importance of stochastic community assembly. PNAS, 104(4): 17430-17434.
Costa, L.P. & Leite, Y.L.R. 2012. Historic fragmentation shaping vertebrate diversification in the Atlantic Forest bio- diversity hotspots. Bones, clones, and biomes: the history and geography of recent neotropical mammals (ed. by B.D. Patterson and L.P. Costa), pp. 283–306. University of Chicago Press, Chicago, IL, USA.
Costa, L.P. 2003. The historical bridge between the Amazon and the Atlantic forest of Brazil: A study of molecular phylogeography with small mammals. Journal of Biogeography 30: 71–86 (doi:http://dx.doi.org/10.1046/j.1365-2699.2003.00792.x).
de la Sancha, N. U., Higgins, C. L., Presley, S. J., Strauss, R. E. 2014. Metacommunity structure in a highly fragmented forest: has deforestation in the Atlantic Forest altered historic biogeographic patterns?. Diversity and Distributions, 20:1058–1070. (doi:10.1111/ddi.12210)
Fischer, R.A., Corbert, A.S. & Williams, C.B. 1943. The relation between the number of species and the number of individuals in a random sample of an animal population. J. Anim. Ecol. 12(1):42-58.
Gleason, H.A. 1927. Further views on the succession-concept. Ecology. 8(3):299-326.
Gorelick, R. 2011. Commentary: Do we have a consistent terminology for species diversity? The fallacy of true diversity. Oecologia, 167: 885–888.
Graham, C. & Fine, P. 2008. Phylogenetic beta diversity: linking ecological and evolutionary processes across space and time. Ecology Letters. 11:1265–1277.
Jost, L. 2006. Entropy and diversity. Oikos, 113(2): 363-375.
Jost, L. 2007. Partitioning diversity into independent alpha and beta components. Ecology, 88:2427–2439.
Kneitel, J. M. e Chasen, J. M. 2004. Trade-offs in community ecology: linking spatial scales and species coexistence. Ecology Letters, 7: 69–80.
Leprieur, F., Albouy, C., De Bortoli, J., Cowman, P. F., Bellwood, Moillot, D. 2012. Quantifying Phylogenetic Beta Diversity: Distinguishing between „true turnover of lineages and phylogenetic‟
Machado, A. B. M.; Drummond, G. M.; Paglia, A. P. (eds.). Livro Vermelho da Fauna Brasileira Ameaçada de Extinção. 1. ed. Brasília, DF: MMA (Biodiversidade 19), 2 volumes, 2008.
Macarthur, R.H. & Wilson, E.O. 1967. The theory of island biogeography. Princeton University, Princeton, p. 224.
Macarthur, R.H. 1960. On the relative abundance of species. American Naturalist. 94(1):25-36.
Magurran, A.E. 2004. Measuring biological diversity. Blackwell, Oxford, p. 256.
Mittermeier R.A.; Mittermeier, C.G. (2005) Megadiversity: Earths Biologically Wealthiest Nations (p. 501). Cemex. Retrieved from http://www.amazon.com/Megadiversity-Earths-Biologically-Wealthiest Nations/dp/9686397507
Moreno, C. E. e Rodriguez, P. 2011. Commentary: Do we have a consistent terminology for species diversity? Back to basics and toward a unifying framework. Oecologia,167:889–892.
Nogueira MR, IP de Lima, R Moratelli, VC Tavares, R Gregorin, AL Peracchi. 2014. Checklist of Brazilian bats, with comments on original records. Check List, 10:808–821.
Paglia, A.P., Fonseca, G.A.B. da, Rylands, A. B., Herrmann, G., Aguiar, L. M. S., Chiarello, A. G., Leite, Y. L. R., Costa, L. P., Siciliano, S., Kierulff, M. C. M., Mendes, S. L., Tavares, V. da C., Mittermeier, R. A. and Patton J. L. 2012. Lista Anotada dos Mamíferos do Brasil / Annotated Checklist of Brazilian Mammals. 2a Edição / 2nd Edition. Occasional Papers in Conservation Biology, 6. Conservation International, Arlington, VA. 76pp.
Pereira, A. B. 2009. Mata Atlântica: uma abordagem geográfica. Nucleus, v.6, n.1.
Pielou, E. C. 1984. The interpretation of ecological data: A primer on classification and ordination. John Wiley&Sons, Inc., New York. 263 pp.
(doi:10.1111/j.1466-8238.2009.00505.x)
Presley, S. J., C. L. Higgins, C. López-González, and R. D. Stevens. 2009. Elements of metacommunity structure of Paraguayan bats: multiple gradients require analysis of multiple axes of variation. Oecologia 160:781-793.
Preston, F.W. 1948. The commonness, and rarity, of species. Ecology. 29(1):254-283.
Prum, R. 1988. Historical relationships among avian forest areas of endemism in the neotropics. Proceedings of the International Ornithological Congress, 19: 2562–2572.
Ribeiro MC, Metzger JP, Martensen AC, Ponzoni FJ, Hirota MM. 2009. The Brazilian Atlantic Forest: how much is left, and how is the remaining forest distributed? Implications for conservation.
Biological Conservation, 142: 1144-1156.
Ricotta, C. 2005. Through the jungle of biological diversity. Acta Biotheor, 53(1):29-38.
Rizzini, C. T. 1997. Tratado de fitogeografia do Brasil. Rio de Janeiro: Editora Âmbito Cultural.
Rosenzweig, M.L. 1995. Species diversity in space and time. Cambridge University, Cambridge, p. 436.
Silva, j.m.c. & Casteleti, c.h.m. 2005. Estado da biodiversidade da Mata Atlântica brasileira. In: Galindo-Leal, C. & Câmara, I.G. (Eds.). Mata Atlântica: Biodiversidade, Ameaças e Perspectivas. Belo Horizonte: Fundação SOS Mata Atlântica Conservação Internacional. p. 43-59.
Simpson, G. G.. 1964. Species Density of North American Recent Mammals. Systematic Zoology. 13(2), 57–73. http://doi.org/10.2307/2411825
Starzomski, B. M., Parker, R. L., Srivastava, D. S. 2008. On the relationship between regional and local species richness: a test of saturation theory. Ecology, 89(7): 1921–1930.
674. (doi:10.1111/j.1365-2699.2003.01042.x)
Tuomisto, H. 2010 (a). A diversity of beta diversities: straightening up a concept gone awry. Part 1. Defining beta diversity as a function of alpha and gamma diversity. Ecography, 33: 2-22.
Tuomisto, H. 2010 (b). A diversity of beta diversities: straightening up a concept gone awry. Part 2. Quantifying beta diversity and related phenomena. Ecography, 33: 23- 45.
Webb, C. O., Ackerly, D. D., Mcpeek, M. A. e Donoghue, M. J. 2002. Phylogenies and Community Ecology. Annual Review Ecology Systematics, 333: 475-505.
OBJETIVOS
Objetivo geral
O principal objetivo desta dissertação associada da Rede BioM.A. (PPBIO Mata Atlântica aprovado 12/2012) é avaliar a heterogeneidade das comunidades de morcegos ao longo da Mata Atlântica brasileira em varias escalas de amostragem.
Objetivos específicos
- Realizar através de fontes bibliográficas um levantamento de coletas de morcegos ao longo da Mata Atlântica Brasileira.
Capítulo 1
Heterogeneity of bat (chiroptera) communities in the
Brazilian Atlantic Forest.
Emmanuel Messias Vilar, Natan Diego Alves de Freitas, Ewerth Janssen Cunha de
Vasconcelos,
Thais Kubik Martins and Pedro Cordeiro-Estrela
HETEROGENEITY OF BAT (CHIROPTERA) COMMUNITIES IN THE BRAZILIAN ATLANTIC FOREST
Emmanuel Messias Vilar1,2*, Natan Diego Alves de Freitas1, Ewerth Janssen Cunha de Vasconcelos1,
Thais Kubik Martins1,2 and Pedro Cordeiro-Estrela1,2
1 Laboratório de Mamíferos da Universidade Federal da Paraíba; 2Programa de Pós-Graduação em Ciências
Biológicas: Zoologia – UFPB. *corresponding author: messiashp@gamil.com
Abstract
During the European colonization in Brazil, the Atlantic Forest was the first biome to be explored. The successive economic cycles and the continued expansion of the human population in the region during the past 500 years committed to the ecological integrity of natural ecosystems of the biome. The Atlantic Forest may contain 1-8% of all species of flora and fauna of the world, In particular bats this biome represent more than 64% of all bats for the country. Bats are one of the richest groups in species in the tropics, and has a high abundance at the community level, which makes them an excellent group for the study of structuring communities. In view of this, this article aims to evaluate the heterogeneity of bat communities in the Brazilian Atlantic Forest, seeking to verify if the dissimilarity between these communities responds to the latitudinal gradient, which provides this beta diversity and how the metacommunity bat is structured. For this we use metadata. Beta diversity analyzes were performed to assess the heterogeneity of biomes and metacomunity analysis to evaluate its structure. We observed that the community of bats of the Brazilian Atlantic Forest, are explained by the turnover and have a random spatial structure, unresponsive to latitudinal gradient. Concluding that the high beta diversity between the bat communities, is mainly explained by environmental forces and the heterogeneity of study metacommunity expands our understanding about the mechanisms that involve the structure of biological communities in tropical ecosystems.
Keywords
Introduction
The Atlantic Forest stands out from all the Tropical Rainforest of the world, for its long longitudinal distribution along the Brazilian coast, for its diversity of habitats, its isolation from other rain forests of the continent and the high degree of fragmentation that qualify as one of 34 hotspots for conservation (Mittermeier et al. 2005). These are important characteristics to explain the high diversity, endemism and current level of threat of organisms of this biome. It represents the longest latitudinal gradient of tropical forest in the world (Galindo-Leal & Camara, 2003; Ribeiro et al. 2009). The climate of the Atlantic Forest is mainly characterized by high temperatures, high relative humidity, heavy rainfall, frequent fog in some areas and bright light. The evolutionary past of the Atlantic Forest is marked by periods of contact with biota of other South American forests, followed by periods of isolation (Prum, 1988; Rizzini, 1997). With that the composition of the Atlantic biota is composed of both very ancient elements, which differed in the Pliocene, and by elements that colonized the region more recently, during the transition Pleistoceno - Holocene (Prum, 1988; Hackett and Lehn, 1997) . According to Silva and Casteleti (2003) the Atlantic Forest may contain 1-8% of all species of flora and fauna of the world, including more than 20,000 species of plants, 261 species of mammals, 688 species of birds, 200 species of reptiles, 280 species of amphibians, and many other species that still require scientific description (Goerck, 1997; Mittermeier et al., 1999; Silva and Casteleti, 2003). In particular bats this biome represent more than 64% of all bats for the country (Paglia et al. 2012, Nogueira, 2014).
Bats are exceptional because they usually show wide geographic distributions and present a high degree of taxonomic and functional diversities (Stevens and Willig 2000), an elevate longevity (Gaisler, et al., 2003; Podlutsky, et al., 2005;. Munshi-South & Wilkison, 2010) and echolocation (Lancaster et al., 1995). Bats are one of the richest groups in species in the tropics, and has a high abundance at community level (Patterson et al., 2001), which makes them an excellent group for the study of structuring communities. Several studies have approached the structure of bat communities in relation to species richness and the latitudinal gradient, betadiversity, phylobetadiversity and diversification (e.g. Stevens & Willig, 2002; Stevens, 2004; Willig & Bloch, 2006; Arita et al.,
2014; Peixoto et al., 2014), generally on large scales, whether global or continental.
Respecting to the betadiversity, many metrics were developed to represent the degree of heterogeneity and dissimilarity between comunities (e.g., Tuomisto, 2010a). The dissimilarity, or more commonly called betadiversity (Tuomisto, 2010b), can be composed by two elements, the nestedness and the turnover (Baselga and Orme, 2012).
according to them, metacommunity can be broadly defined as a set of ecological communities in different locations (potentially, but not necessarily connected by dispersion), while that a community is a group of species in a given location. With this many innovative analytical approaches have been developed to facilitate the identification, evaluation of the structure and operation of multi-species along environmental gradient (e.g. Leibold & Mikkelson, 2002; Hausdorf & Hennig, 2007; Presley et al., 2010). The structure of the metacomunity, from this approach, are characterized by elements like the pattern of randomness, checkerboard or degree of nestedness, the turnover and the types of boundary clumping of distribution of species. Understanding the structure and of biological communities, has shown as an excellent tool for decision making in environmental monitoring, as the biodiversity indicators (Smith et al., 2012).
In view of this, this article aims to evaluate the heterogeneity of bat communities in the Brazilian Atlantic Forest, seeking to verify if the dissimilarity between these communities responds to the latitudinal gradient and which provides this beta diversity and how the metacommunity bat is structured.
Methods
Literature review
Data collection was done through bibliographic research of selected scientific articles in the following databases: ScienceDirect (http://www.sciencedirect.com/), Web Of Since (http://apps.webofknowledge.com/), Scielo (http://www.scielo.org/php/index.php), EBSCO Host (http://search.ebscohost.com/) and Google Scholar (http://www.scholar.google.com.br/).
Articles were limited to research over the last 30 years. Only studies in the Brazilian Atlantic Forest were considered. The following portuguese and english keywords were searched in combination with logic operators “AND” and “OR”: bats (morcegos) “OR” chiroptera (quirópteros) with “AND” abundance (abundância), diversity (diversidade), ecology (ecologia), community structure (estrutura de comunidades), Atlantic Forest (floresta atlântica), inventory (inventário), Atlantic Forest (Mata Atlântica), new species (espécie nova), new occurrence (novo registro), taxonomic revision (revisão taxonômica), systematics (sistemática).
nomenclature of Veloso, 1991). We also coded if the study was formed only by captures, by captures and recaptures (population studies) or by museum specimens. Sampling effort was registered or calculated and analyzed through a histogram (see Straube & Bianconi, 2002). All synonyms were standardized following the latest nomenclature for the Brazilian species of bats (Nogueira, 2014), considering as correct all identifications present in the articles.
Spatial sampling of bats along the Atlantic Forest
We analyzed the spatial pattern of samplings of bats along the Atlantic Forest. The geographic coordinates of localities were computed from the articles and when not provided, we georeferenced them in the GIS software QGIS 2.2 (QGIS Development Team 2014). When the altitude was not specified in the articles, we obtained it on GoogleTM Earth. We identified sampling
gaps by estimating a kernel density function, in QGIS. To define the buffer size, we calculated the mean and median of the pairwise geographic distances between localities. Pairwise geographic distances were calculated using fossil package of R program (Vavrek, 2011).
Exploratory analysis of the spatial structure of communities
We used two different but complementary frameworks to access the spatial structure of the composition of communities of bats. Firstly, we calculated the multiple site beta diversity, a metric that considers a total pool of species of all sampling units to verify the Sorensen's index between more than two sampling units. This index is additively decomposed into the turnover and nestedness elements, respectively corresponding to replacement and gain or loss of species (Baselga, 2012). Importantly on this metric, the turnover element is not influenced by the richness of species between locations. Second we used a pairwise approach that calculates one value of beta diversity for each combination of two localities. This approach was considered to explore the latitudinal gradient of the Atlantic Forest. This calculation allows to identify the degree of unicity (irreplaceability) of each sampling unit which is a key concept for conservation prioritization (Brooks et al. 2006). This approach was used to explore the spatial autocorrelation of community dissimilarity. We calculated these metrics of beta diversity on package betapart (Baselga et al., 2012) in R 3.1.1 program (The R Foundation for Statistical Computing).
below this (Costa et al., 2000).
We analyzed the pairwise beta diversity matrix visually through a heatmap, with the localities ordered latitunally by their geographical. As the matrix is very large we complemented visual inspection of patterns by a qualitative analysis of the compositional heterogeneity of communities. Of special interest to our study are close localities with high beta diversity (>0.8) values and distant localities with low beta diversity values (< 0.4). We performed a Pearson correlation between the number of species by localities and grid cells and sampling effort. Bias in taxon sampling might produce at least two effects that can mask differences between compositional units. A high beta diversity between close localities can occur due to random sampling error, for example the capture of different rare species in close localities. Adversely a low beta diversity among distant localities for example due to the absence of rare species in the sampling. Both cases can be detected qualitatively by an experienced bat specialist.
Spatial autocorrelation of betadiversity
We analyzed the spatial autocorrelation of pairwise beta diversity of bats in the Atlantic Forest with Moran's I index at different spatial scales on an autocorrelogram. From this analysis we can obtain which class of geographic distance has a significant spatial autocorrelation of beta diversity. We calculate for all sampling units (locality, 2.5º and 5º grid cells), except biogeographic regions.
Structure of the species occurrence matrix
2014) in the statistical environment R, initially to assess their coherence. Still following Leibold and Mikkelson (2002), we want to detect this three elements of metacommunity structure:the coherence, the species substitution, and the clumping of border distributions. Together, the analysis of these three elements identify which pattern better reflects the structure of communities, they are: chess, nested, Clementsian, Gleasonian, evenly spaced and random distributions (for details see Presley et al., 2010 and Dallas, 2014).
Results
Sampling of bats along the Atlantic Forest
Fig. 1 A= Distribution of the distance between paired locations in km, median (dashed line) = 558.9 km B = Distribution of the sampling effort in m²/h, median (dashed line) = 19140.
Exploratory analysis of the spatial structure of communities
Values of beta total diversity were high for all scales analyzed (Table 1). The beta diversity values decreased in larger spatial scales ranging from 0.99 to 0.48 between locations between biogeographic regions. The dissimilarity in all scales was explained by turnover (Simpson). We analyzed the total beta diversity index including in the grid only localities with a sampling effort superior to the median (n= 27). Only one location had a beta diversity inferior to 1 (Sorensen = 0.89), all other exhibited complete dissimilarity in the whole. Calculating the beta diversity (Sorensen, Simpson and Nestedness) between these locations still observed a high dissimilarity (Sorensen = 0.99).
Assessing the latitudinal gradient of beta diversity pairwise, we observed lower values mostly when comparing nearby villages. Localities nearby who had high values of can be explained by the fact that their locations have few species and these are not very common in other species. Analyzing qualitatively the matrix of pairwise with 116,964 pairs noted that 38% of the locations are close and have a high beta diversity and 9.36% are far and have a low beta diversity. This is due to the first case in these locations present mostly the record of a single species and in the second case have many common species.
Table 1. Beta diversity values (Sorensen's index) computed between units of increasing spatial scale (Localities, 2.5º, 5º grids, and biogeographical regions- RBG) and their elements turnover and Nestedness.
Spatial Scale Sorensen Turnover Nestedness
Localities 0.99 0.98 0.01
Grids 2.5º 0.91 0.77 0.14
Grids 5º 0.79 0.59 0.19
RBG 0.48 0.38 0.09
line in the number of cells 46, 44 and 42 in relation to the number of cells 74 and 81, which turn has a high dissimilarity compared to the rest of the matrix. The last two cells have a single location and in particular, the cell 81 has a single species, Anoura caudifer (E. Geoffroy, 1818) that even though well sampled on the number of locations that occurs (n = 53), generated increased Sorensen index along the matrix (latitudinally). The cell 44 in particular has five species, where four of them are insectivores, not being shared with other sites. In this matrix has a high beta diversity in grid cells that make up the south of Bahia, Minas Gerais and Rio de Janeiro, compared to the boxes at the southern limit of the Atlantic Forest.
Fig. 3. Pairwise beta diversity matrix for localities orderer latitudinally from North (upper left) to South (lower right). From left to right respectively: Sorensen, Turnover and Nestedness.
Fig. 4. Pairwise beta diversity matrix for 2.5º grids orderer latitudinally from North (upper left) to South (lower right). From left to right respectively: Sorensen, Turnover and Nestedness.
Fig. 5. Pairwise beta diversity matrix for Grids 5º orderer latitudinally from North (upper left) to South (lower right). From left to right respectively: Sorensen, Turnover and Nestedness.
Fig. 6. Pairwise beta diversity matrix for biogeographic regions orderer latitudinally from North (upper left) to South (lower right). From left to right respectively: Sorensen, Turnover and Nestedness.
Test of spatial structure and Spatial autocorrelation of beta diversity
Fig. 7. Autocorrelogram between the pairwise beta diversity values for localities and paired geographic distances. Black triangle = Nestedness, black circle = Turnover, white circle = Sorensen.
Fig. 9. Autocorrelogram between the pairwise beta diversity values for Grid's 5º and paired geographic distances. Black triangle = Nestedness, black circle = Turnover, white circle = Sorensen.
Structure of the species occurrence matrix
The structural analytical differentiation in the meta community bats revealed an incoherence matrix, there is no coherence on matrix, indicating a random pattern of metacommunity structure (z = 1.92, p = 0.053). Less than the expected species substitutions (z = 0.86, p > 0.001) and species vary boundaries is significantly different from the expected zero (Morisita's index = 15.8, p = 0). The ordinated matrix can be visually in Figure 10.
Discussion
During the European colonization in Brazil, the Atlantic Forest was the first biome to be explored. The successive economic cycles and the continued expansion of the human population in the region during the last five hundred years committed to ecological integrity of natural ecosystems of the biome (Galindo-Leal & Camara, 2003). Although scientific research centuries, the Atlantic Forest is still unknown. According to Bernard et al. (2011) about 60% of the Brazilian territory is not reported with formal records of bat species and this percentage the Atlantic Forest, in relation to other Brazilian biomes has about 80% of its territory sampled. Yet none of the Brazilian biomes can be considered minimally sampled (Bernard, 2012). Our results point to the southeast, and south of Bahia and the state of Paraná as the scheduled best regions (over 70% of total recorded species), followed by the region comprising the states of Pernambuco and Paraíba (with just over 50%). The other regions are configured as poorly inventoried. This is mainly due to absence formally published inventories, not to mention of course that some jobs may not have filters by our methods. However Bernard et al. (2011) also states that it will take 33 years before all the country has at least a formal record of bat species, the pace of inventory remain the way it is. In addition to another 200 years before we can consider Brazil minimally sampled for its bat fauna.
Sampling of bats along the Atlantic Forest
he total richness found (n = 104) corresponds to more than 91% of the bat fauna of the Brazilian Atlantic Forest (Paglia et al. 2012). The highest concentration of collection in the southeastern states was expected, especially for the largest concentration of bats inventories in the region, and the number of researchers (Bernard et al., 2011). The sampling ffforts specified in the articles or calculated following Straube & Bianconi (2002) showed a wide range in the various papers. As demonstrated in 5 grid cells there is a significant influence of effort on richness of species. Even without observing significant values in the correlation of richness with other spatial scales, it is clear that the sampling effort can influence the composition of bat species in the Atlantic Forest, as demonstrates Bergallo and collaborators (2003). In spite of this, metric used to calculate Turnover index (Baselga, 2012) is not affected by different richness of localities, so it is a consistent metric. Analyzing different scales is evident that the high dissimilarity in smaller scales may have been skewed by the different sampling efforts in the different articles and especially because some localities submit the record of a single species, yet not different from this, many studies show a decrease of beta diversity with the increase of the geographical range (e.g. Lennon et. al., 2001).
the processes underlying beta diversity are clearly different. The variation of beta diversity between bat communities in the Atlantic Forest was explained at all scales by turnover. These elevate values of turnover implies the elevate substitution of species as a result of environmental or spatial filter and historical restraints (Qian et al., 2005, Baselga, 2010). But we didn't observe the elevate turnover concentrated between biogeography regions.
Analyzing the beta diversity index only in localities with more effort (Effort> median) observed clearly that high beta diversity is not necessarily caused by sub samples, further strengthening the pattern of random matrices. Suggesting that the high beta diversity could be related with environmental gradients, and several studies have already shown a strong relationship between species richness and environmental gradient, especially temperature (eg Weber, 2009;. Stevens, 2013). The high beta diversity between areas with high effort (which in theory are well sampled), also shows that much can be discovered on bat communities in the Atlantic Forest, especially in relation to the increase of richness, not surprising that new records have appeared to biome (e.g. Gregorin et. al., 2014; Vilar. et al., 2015).
Elements of metacommunity structure
Visually there is a random pattern in ordered matrix for the utilized scales, withouta latitudinal ordination. Rodriguez and Arita (2004) studying the beta diversity of mammals in North America and its relationship with the latitudinal gradient, did not find any pattern of relationship between beta diversity and latitude. Since Lomolino and Brown (1998) assumed that beta diversity will increase with decreasing latitude, corresponding to patterns at scales greater bars and latitudinal width (Stevens and Willig, 2002), we could observe a elevate betadiversity between localities on high latitudes of atlantic rainforest. Or it may be possible that a wider range of latitudes it is necessary to detect beta diversity patterns for bats than for non-flying mammals (Rodriguez and Arita, 2004), like a biogeographic regions on atlantic rainforest determined by non-flying small mammals.
Other suggestion of Willig and Moulton (1989) is that the many guilds of bats can overshadow patterns of structuration of communities.
Willig & Moulton (1989), evaluating the structure of bat communities in the Cerrado and Caatinga of northeastern Brazil, through morphological patterns observed a random structure. Demonstrating the competition influences or not in structuring the bat community for the studied biomes. Finally these authors concluding that the spatial and temporal heterogeneity characteristic of northeastern Brazil, combined with the mobile nature of bats, could decrease the intensity, scope or predominance of deterministic interactions, thus leading to indistinguishable ecomorphological structure produced by stochastic processes. And it helps a lot to explain this random pattern in our results. However Presley & Willig (2010) studied metacommunity structure of bats in the Caribbean islands, found a Clementsian structuring (discrete communities with groups of species that replace other groups of species along the gradient), where the structure of metacommunity analyzed for scale was mainly dependent on the number and geographical layout of the primary sources of colonization, not of interspecific interactions of environmental tolerance levels or physical characteristics of the islands. It is worth considering that, Isles of studies can be more easily detected patterns structuring metacommunity because factors such as distance and size between the islands can increase the chances of structuring. Similar structure found López-González (2012), analyzing metacommunity of bats in Mexico analyzing continuous areas.
Conclusions
We conclude that the community of bats of the Brazilian Atlantic Forest, are explained by the turnover and have a random spatial structure, unresponsive to latitudinal gradient. Also concluded that the high beta diversity between the bat communities, is mainly explained by environmental forces. Even among regions with high heterogeneity sampling rates remain high. The heterogeneity of study metacommunity expands our understanding about the mechanisms that involve the structure of biological communities in tropical ecosystems. Besides acting as an excellent tool for decision-making in environmental monitoring proposals.
Acknowledgements
Literature cited
Arita, H.T., Vargas-Barón, J. and Villalobos, F. (2014) Latitudinal gradients of genus richness and endemism and the diversification of New World bats. Ecography, 37, 1024–1033. (doi: 10.1111/ecog.00720)
Baselga, A. (2010) Partitioning the turnover and nestedness components of beta diversity. Global Ecology and Biogeography, 19, 134–143. (doi: 10.1111/j.1466-8238.2009.00490.x)
Baselga, A. and Orme, C.D.L. (2012) Betapart: an R package for the study of beta diversity. Methods in Ecology and Evolution, 3, 808–812. (doi: 10.1111/j.2041-210X.2012.00224.x)
Bergallo, H.G., Esberard, C.E.L., Mello, M.A.R., Lins, V., Mangolin, R., Melo, G.G.S. and Baptista, M. (2003) Bat Species Richness in Atlantic Forest: What Is the Minimum Sampling Effort?. Biotropica, 35 , 278–288. (doi: 10.1111/j.1744-7429.2003.tb00286.x)
Brown, J. H. and Lomolino, M. V. (1998) Biogeography, 2nd ed. Sinauer.
Brooks, T.M., Mittermeier, R.A., da Fonseca, G.A., Gerlach, J., Hoffmann, M., Lamoreux, J.F., Mittermeier, C.G., Pilgrim, J.D., Rodrigues, A.S. Global biodiversity conservation priorities. Science, 313(5783):58–61.
Costa, L.P., Leite, Y.L.R., da Fonseca, G.A.B. and da Fonseca, M.T. (2000) Biogeography of South American Forest Mammals: Endemism and Diversity in the Atlantic Forest. Biotropica, 32, 872– 881. (doi:10.1111/j.1744-7429.2000.tb00625.x)
Bernard, E., Aguiar, L.M.S. and Machado, R.B. (2011) Discovering the Brazilian bat fauna: a task for two centuries?. Mammal Review, 41, 23–39. (doi:10.1111/j.1365-2907.2010.00164.x)
Bernard, E., Aguiar, L.M.S., Brito, D., Cruz-Neto, A.P., Gregorin, R.G., Machado, R.B., Oprea, M., Paglia, A.P., Tavares, V.C. (2012) Uma análise de horizontes sobre a conservação de morcegos no Brasil. Pp. 19-35, In: Mamíferos do Brasil: Genética, Ecologia e Conservação, vol II. (ed: T.R.O. Freitas & E.M. Vieira). Rio de Janeiro. Sociedade Brasileira de Mastozoologia. ISBN 978-85-63705-01-3.
Dallas, T. (2014) Metacom: an R package for the analysis of metacommunity structure. Ecography,
37, 402–405. (doi: 10.1111/j.1600-0587.2013.00695.x)
de la Sancha, N. U., Higgins, C. L., Presley, S. J., Strauss, R. E. (2014) Metacommunity structure in a highly fragmented forest: has deforestation in the Atlantic Forest altered historic biogeographic patterns?. Diversity and Distributions, 20:1058–1070. (doi:10.1111/ddi.12210)
Esbérard, C.E.L. (2003) Diversidade de morcegos em área de Mata Atlântica regenerada no Sudeste do Brasil. Revista Brasileira de Zoociências,5, 189 – 211.
Gaisler, J., Hanak, V., Hanzal, V., Jarsky, V., (2003) Results of bat banding in the Czech and Slovak Republics. 1948–2000. Vespertilio,7,3–61.
Galindo-Leal & I.G. Câmara (eds.). The Atlantic Forest of South America: biodiversity status, threats, and outlook. pp. 3-11. Center for Applied Biodiversity Science e Island Press, Washington, D.C.
Gotelli, N. J. (2000) Null Model Analysis of Species Co-occurrence Patterns. Ecology, 81(9): 2606– 2621.
Goerck, J.M., (1997) Patterns of rarity in the birds of the Atlantic Forest of Brazil. Conservation Biology, 11, 112–118
Graham, C.H., Moritz, C. & Williams, S.E. (2006) Habitat history improves prediction of biodiversity in rainforest fauna. Proceedings of the National Academy of Sciences USA, 103, 632– 636.
Gregorin, R., Vasconcellos, K.L., and Gil, B.B. (2014) Two new range records of bats (Chiroptera: Phyllostomidae) for Atlantic Forest, eastern Brazil. Mammalia. (doi:10.1515/mammalia-2013-0142) Hackett, S.J. & Lehn, C.A. (1997) Lack of genetic divergence in a genus (Pteroglossus) of neotropical birds: the connection between life-history characteristics and levels of divergence.
Ornithological Monographs, 48, 267–279.
Hausdorf, B. & Hennig C. (2007) Null model tests of clustering of species, negative co-occurrence patterns and nestedness in meta-communities. Oikos,116, 818-828.
Lancaster, W.C., Henson, O.W.JR. and Keating, A.W. (1995) Respiratory muscle activity in relation to vocalization in flying bats. The Journal of Experimental Biology,198, 175–191.
Leibold, M.A. & Mikkelson, G.M. (2002) Coherence, species turnover, and boundary clumping: elements of meta-community structure. Oikos, 97, 237–250. (doi: 10.1034/j.1600-0706.2002.970210.x)
Lennon, J.J., Koleff, P., Greenwood, J.J.D. and Gaston, K.J. (2001) The geographical structure of British bird distributions: diversity, spatial turnover and scale. Journal of Animal Ecology, 70, 966– 979. (doi: 10.1046/j.0021-8790.2001.00563.x)
López-González, C., Presley, S.J., Lozano, A., Stevens, R.D. and Higgins, C.L. (2012) Metacommunity analysis of Mexican bats: environmentally mediated structure in an area of high geographic and environmental complexity. Journal of Biogeography, 39, 177–192. (doi:10.1111/j.1365-2699.2011.02590.x)
Luz, J.L.; Costa, L.M.; Lourenço, E.C.; Gomes, L.A.C. and Esbérard, C.E.L. (2009) Bats from the Restinga of Praia das Neves, state of Espírito Santo, Southeastern Brazil. Check List,4, 364-369. Mittermeier R.A.; Mittermeier, C.G. (2005) Megadiversity: Earths Biologically Wealthiest Nations (p. 501). Cemex. Retrieved from http://www.amazon.com/Megadiversity-Earths-Biologically-Wealthiest Nations/dp/9686397507
Mittermeier, R.A., Myers, N., Robles Gil, P., Mittermeier, C.C., (1999) Hotspots. Agrupación Sierra Madre, CEMEX, Mexico City.


![Table 1. External and cranial measurements (in grams [Body mass] and millimeters) of the Ametrida centurio collected in the Atlantic Forest, compared with measurements provided by Peterson (1965), N (sample size)](https://thumb-eu.123doks.com/thumbv2/123dok_br/15244890.537330/53.892.63.849.133.774/external-measurements-millimeters-ametrida-collected-atlantic-measurements-peterson.webp)