ABSTRACT
Purpose: To identify the prevalence of ophthalmologic diseases in elderly patients who had been classified as severely disabled and to identify the ophthalmologic conditions leading to visual impairment and blindness.
Methods: The medical records of 2806 patients who had applied to the Health Board of the Erzurum Region Training and Research Hospital between January 2011 and December 2012 were reviewed. One hundred ninety-nine patients aged >64 years who were classified as severely disabled with disability rates of over 50%, and who were unable to care for themselves or to move and/or communicate without help were included in the study.
Results: The most frequently seen disabilities were neurological (47.2%) and those resulting from eye diseases (17.1%). The most common ophthalmologic diseases were cataract, glaucoma, and age-related macular degeneration. The mean right and left eye visual acuities were 1.17 ± 1.10 logMAR and 1.13 ± 1.0 logMAR, respectively. Of the 60 patients with ophthalmologic diseases or conditions, 33 were blind (visual acuity worse than 20/400) and 10 were visually impaired (visual acuity worse than 20/70 but better than 20/400). Cataracts were the main cause of blindness. The mean age of the patients who were still being followed up at the time of application to the disability board was significantly lower than that of the others (p=0.015). Seventy-nine percent of the blind patients were from rural areas, and 88% of these had no regular follow-up. Among the blind and visually impaired, significantly more patients from urban areas had social security insurance (SSI) than those from rural areas (p=0.043). Nearly 64% of the blind patients were women. The follow-up rate was significantly lower in women (p=0.025). According to multinomial logistic regression analysis, the visually impaired and blind patients were more likely to have lower follow-up rates than the other types of severely disabled patients (OR: 0.231, 95% Cl: 0.077-0.688, p=0.009).
Conclusions: Blindness gives rise to severe disability, and the most common oph-thalmologic diseases that cause severe disabilities in elderly patients are ca taract, glaucoma, and age-related macular degeneration. Sociodemographic factors that may affect the accessibility of visually impaired and blind people to health services include their place of residence and gender.
Keywords: Blindness; Cataract; Disabled people; Aging
RESUMO
Objetivo: Identificar a prevalência de doenças oftalmológicas em pacientes idosos que tinham sido considerados como incapacitados graves, e para identificar as con-dições oftalmológicas que levam à deficiência visual e cegueira.
Métodos: Prontuários de 2806 pacientes que tinham solicitado ao conselho de
saúde do hospital de treinamento e pesquisa da região de Erzurum entre janeiro de 2011 e dezembro de 2012, foram revistos. Cento e noventa e nove idosos com mais de 64 anos, que foram considerados como incapacitados graves nos quais as taxas de incapacidade são mais de 50% e não são capazes de cuidado próprio e não são capazes de mover-se e/ou comunicar-se sem ajuda, foram incluídos no estudo.
Resultados: As deficiências mais frequentemente observados são neurológicas (47,2%) e doenças oculares (17,1%). As doenças oftalmológicas mais frequentemente observadas foram catarata, glaucoma e degeneração macular relacionada à idade. Média de acuidade visual em olho direito e esquerdo foram 1,17 ± 1,10 e 1,13 ± 1,0 logMAR, respectivamente. Dos 60 pacientes, 33 apresentaram cegueira (acuidade visual pior que 20/400), 10 tinham deficiência visual (acuidade visual pior do que 20/70, melhor do que 20/400). A catarata foi a principal causa de cegueira. A idade média dos pacientes com acompanhamento no momento da solicitação ao conselho foi significativamente menor do que os demais (p=0,015). Setenta e nove por cento dos pacientes cegos eram da área rural e 88% deles não tinham acompanhamento regular. Entre cegos e deficientes visuais, a taxa de posse do seguro de segurança social (SSI) foi significativamente maior em pacientes de área urbana (p=0,043). Quase 64% dos pacientes cegos eram mulheres. A taxa de acompanhamento foi significativamente menor nas mulheres (p=0,025). De acordo com a análise de regressão logística mul-tinominal, os pacientes com deficiência e cegos visuais eram mais propensos a ter menor taxa de acompanhamento do que os outros pacientes com deficiência grave (OR: 0,231, 95% Cl: 0,077-0,688, e p=0,009).
Conclusões: A cegueira gera incapacitação grave. As doenças oftalmológicas mais
frequentemente observadas que causam deficiência grave em pacientes idosos são a catarata, glaucoma e degeneração macular relacionada à idade. O local de residência e o gênero são fatores sociodemográficos que podem ter impacto sobre o acesso à saúde de pessoas com deficiência visual e cegos.
Descritores: Cegueira; Catarata; Pessoas com deficiência; Envelhecimento
INTRODUCTION
The mean expected lifespan for humans rose from the 40s at the beginning of the 20th century to the 80s at the beginning of the 21st century(1). Populations are increasingly aging worldwide, and the high rates of development of chronic health conditions over the aging process increase the rates of morbidity and mortality and are associated with disability(2-3). The Global Burden of Disease estimated that 190 million individuals had a severe disability in 2010, including conditions such as quadriplegia, severe depression, and blindness(4).
Blindness has socioeconomic consequences in all societies, with the costs of lost productivity, rehabilitation, and education of the blind constituting a significant economic burden for individuals, their fami-lies, and societies(5). Visually impaired and blind elderly people usually face restrictions in their ability to participate in various activities. De-creased participation and activity loss are associated with inDe-creased risk of functional and cognitive decline; in addition, these patients are at risk of social isolation and may suffer from loneliness(6-10). Worldwide, 161-258 million individuals are estimated to be visually impaired, and
Sociodemographic status of severely disabled and visually impaired
elderly people in Turkey
Estado sociodemográico de pacientes idosos com incapacidades graves e deiciência visual na Turquia
Sertaç argun Kıvanç1,2, Berna aKova-BudaK2, oSman oKan olcaySü1, SadıK görKem çevıK3
Submitted for publication: May 19, 2015 Accepted for publication: October 20, 2015
1 Department of Ophthalmology, Erzurum Region Training and Research Hospital, Erzurum, Turkey. 2 Department of Ophthalmology, School of Medicine, Uludag University, Bursa, Turkey. 3 Department of Ophthalmology, Şevket Yılmaz Training and Research Hospital, Bursa, Turkey.
Funding: No specific financial support was available for this study.
Disclosure of potential conflicts of interest: None of the authors have any potential conflict of interest to disclose.
Corresponding author: Sertaç Argun Kıvanç. Department of Ophthalmology, School of Medicine,
in 33-39 million of this population, vision is reduced to the level of blindness(11-13). In Turkey, according to the Turkish Statistical Institute, 85.7% of the disabled do not work, with half of these not able to work due to severe disability. Further, 37.2% of these individuals do not work due to ocular disability. According to the 2011 data from the Social Security Institution of the Republic of Turkey, approximately $2.9 billion was allocated for disabled people, with $2 billion (71.5%) spent on the severely disabled and their relatives. Ophthalmologic disability accounted for 8.4% of the total disabilities(14,15). Therefore, blindness and visual impairment are amongst the most important public health problems. An international, comprehensive classifica-tion system has been developed by the World Health Organizaclassifica-tion (WHO) to define health and health-related conditions, as well as the functionality and limits of humans, in standard language and settings. This system, called the International Classification of Functioning, Disability, and Health, has been used as a classification system in studies of disabled individuals. In Turkey, a disability rate determined by a regional health board, including physicians specialized in rela-ted diseases, is taken into account. In addition to the international standards, these measures are used along with the Balthazar formula when assessing the total disability level of an individual(16). In order to receive disability and nursing care benefits, the disability level of the individual must be at least 50% for them to be evaluated as “severely disabled” by the board. In this study, we aimed to identify the rate of ophthalmologic diseases in patients who had been evaluated as being severely disabled and to identify the specific ophthalmologic conditions leading to visual impairment and blindness among sub-jects aged 65 years or older.
METHODS
P
ATIENTSELECTIONThe medical chart records of patients who had applied to the Health Board of the Erzurum Region Training and Research Hospi-tal between January 2011 and December 2012 were reviewed. One hundred ninety-nine patients aged over 64 years who were assessed as being “severely disabled” out of 2806 patients(17) were included in the study and were retrospectively analyzed following approval of the Ethics Board of the Erzurum Region Training and Research Hospital. The present study complied with the tenets of the Declaration of Helsinki. The health insurance status, number of visits, time spent under the supervision of a physician, patient’s place of residence (urban/rural), age, gender, whole body functional disability rate, medical branch of disability, ophthalmologic functional disability rate, vision, and ante-rior/posterior segment examination were recorded.
D
ISABILITYRATEThe total body disability rate (TBDR) and severity of disability were determined by a health board in a tertiary center. The disability rate is determined by the board, which includes physicians specializing in internal medicine, ophthalmology, ear nose throat, general surgery or orthopedics, neurology, and psychiatry, in addition to the interna-tional standards; these measures are used along with the Balthazar for-mula when identifying the TBDR of an individual(17). “Severely disabled” is defined as individuals with a disability rate over 50% who are not
able to care for themselves (feeding, dressing, bathing, etc.) and are not able to move and/or communicate without help.
H
EALTHINSURANCESTATUSThe patients were divided into two groups in terms of health in-surance status. The first group had social security inin-surance (SSI) and was defined as those who had a job or whose close relatives had a job with a fixed amount of tax from their salaries allocated to the Social Security Insurance. Patients in this group can apply to a tertiary medical center or hospital without official referral. The second group did not have social security insurance (No-SSI), had a low income, and many of them did not have a job. They lack social security insurance, so the government provides them with health insurance. However, according to the health regulations, if they want access to a tertiary medical center or hospital, they need to be referred officially by a local physician. Otherwise, they would need to pay all health expenses themselves without the support of insurance from the government.
P
ATIENTGROUPSThe patients were divided into two groups according to the num-ber of physician visits per year. The first group included the patients who visited their physicians at least once a year. The second group included patients who only visited the hospital when applying to the disability board. The patients were also grouped according to whether their place of residence was in a rural or urban area.
A
SSESSMENTOFVISUALIMPAIRMENTANDBLINDNESSVision was defined and classified according to the WHO recom-mendations. Visual impairment was defined as a visual acuity of worse than 20/70 but equal to or better than 20/400, or a correspon-ding visual field loss of less than 20°, in the better eye with the best possible correction. Blindness was defined as a visual acuity of worse than 20/400, or a corresponding visual field loss to less than 10°, in the better eye with the presenting distance visual acuity.
S
TATISTICALANALYSISWe analyzed the data using the SPSS 17 (SPSS, Inc., Chicago, IL, USA) program. For quantitative data, we used t-tests to compare groups with normally distributed parameters.
Pearson’s chi-square test was performed to compare qualitative data. The statistical significance was set at p<0.01 and p<0.05.
RESULTS
A total of 199 severely disabled patients who were over 64 years old were included in the present study, with 125 women (62.8%) and 74 men (37.2%). In terms of insurance, 89 were in the No-SSI group, and 110 were in the SSI group. Fifty-six individuals applied to the disability board from urban areas, and 143 patients applied from rural areas. The mean age was 79.29 ± 6.92 years (range: 65-97 years). The mean TBDR was 88.75 ± 7.96 (range: 60-100). All the patients had the mean major disability rate (MDR) (Table 1). The most common disabilities according to the medical specialty are shown in table 2. Neu rological diseases were the most common, with 94 patients (47.2%),
Table 1. Demographics of severely disabled patients
Age (years) TBDR Place of residence Social security status Regular follow-up
N % Mean ± SD Mean ± SD Urban Rural SSI No-SSI Yes No
Gender
Male 074 037.2 79.3 ± 7.0 89.6 ± 7.0 19 055 037 37 22 052
Female 125 062.8 79.3 ± 6.9 88.3 ± 8.5 37 088 073 52 29 096
Total 199 100.0 79.3 ± 6.9 88.8 ± 8.0 56 143 110 89 51 148
P value 0.552 0.249 0.308
followed by eye diseases, with 34 patients (17.1%). The most common ophthalmologic diseases were cataract, glaucoma, and age-related macular degeneration (AMD). Table 3 shows the ocular diseases, causes of blindness, and visual impairment, as well as their rates for each eye. The mean right and left eye visual acuities were 1.17 ± 1.10 logMAR and 1.13 ± 1.0 logMAR, respectively. Of the 60 patients with ophthalmologic diseases or conditions, 33 were blind and 10 had visual impairment. In total, 90 eyes suffered from blindness (63 eyes) and visual impairment (27 eyes). Cataract was the main cause for blindness, followed by glaucoma. However, seven eyes had neovas-cular glaucoma, and the cause of neovasneovas-cularization was unclear from the medical charts.
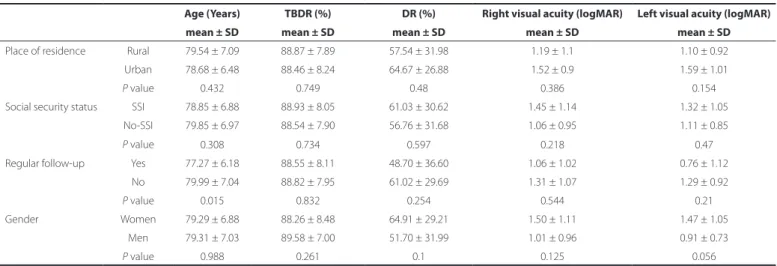
Cataract was the most common cause for visual impairment. No significant differences were noted in the age, TBDR, ophthalmologic disability rate, visual acuity of the right eye, and visual acuity of the left eye between the sexes. Further, there were no significant differences in TBDR, ophthalmologic disability rate, and the visual acuities of the right and left eyes between the patients who were being followed up at the time of application to the disability board and the ones who were not. Further, the mean age of the patients who were being followed up at the time of application to the disability board was significantly lower than that of the patients who were not being followed up at the time of application (p=0.015) (Table 4).
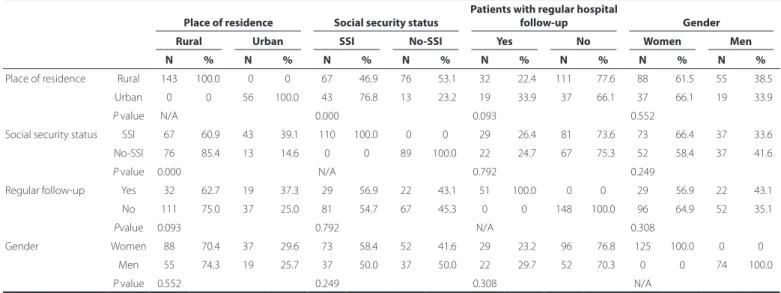
The mean MDR of the patients with eye disorders was statis ti cally significantly higher than that of the patients with other di sorders; the mean MDRs were 92.82 ± 4.50 and 87.92 ± 8.27, respectively (p=0.001). The number of patients without SSI was significantly higher in rural areas than in urban areas (85%, p<0.001). No statistical sig-nificance was detected in terms of the other parameters (Table 5). The sociodemographic and economic characteristics of the patients who were blind and visually impaired are shown in table 6. Seventy-nine percent of the blind patients were from rural areas, and 88% of the blind patients had no regular follow-up. Nearly 64% of the blind pa tients were women.
Of the 199 patients, 60 (30%) had ophthalmologic conditions or diseases. Thirty-four (57%) had applied to the disability board be cause of eye disease and 22% because of neurological disorders. Forty-three of the 199 patients (22%) were blind or visually impaired. The mean age of the blind or visually impaired patients was 81.4 ± 6.9 years. Among the blind and visually impaired patients, the rate of those with SSI was significantly higher in women (75%; p=0.037) and patients from urban areas (73%; p=0.043). The follow-up rate was significantly lower in women (p=0.025).
Among the 199 severely disabled patients, we compared the cha-racteristics of the 60 patients with visual impairment or blindness with the other severely disabled patients by univariate analysis. There was a significant difference in terms of the follow-up status (Table 7). To assess the associations of the place of residence, SSI status, follow-up status, and gender with visual condition, we performed a multinomial logistic regression analysis. The visually impaired and blind patients were more likely to have a lower follow-up rate than the other severely disabled patients (OR: 0.231, 95% Cl: 0.077-0.688, p=0.009).
DISCUSSION
Aging is a natural process, and the increased rates of age-related diseases due to this increase in life expectancy are currently an im-portant public health issue. Individuals aged 65 years or older now comprise 14.7%, 12.5%, and 13% of the whole population of the Netherlands, Australia, and the USA, respectively(18). While the current population aged 65 years or older is 5.9 million (approximately 8%) in Turkey, it has been extrapolated to reach over 8.5 million (approxima-tely 10%) in 10 years’ time(19). According to data released in 2011, there are 30,318 patients aged over 65 years receiving disability benefits who are severely disabled(15). The individuals aged 65 years or older who received care services at home or special care centers constitute 6.6%, 6.0%, and 3.5% of the total population in the Netherlands, Aus-tralia, and the USA, respectively(18).
In the present study, we noticed that ophthalmology is among the first three major disciplines related to severe disability. Globally, there are 32 million blind people and 153 million people with visual impairment who are 50 years old or older. In Europe, there are 3000 blind people and 25,500 people with visual impairment per one million people(12). The burden of visual impairment is greatest amongst those 50 years of age and older. Globally, 84.6% of blind people and 77.5% of visually impaired people are in these age groups(13). A study from the Netherlands reported prevalence rates in 2008 of 2.4% for blindness and 7.8% for visual impairment in people aged 65 years and over(20). The prevalence of blindness in adult individuals has been assessed as varying between 0.5% and 3% in different studies(21,22).
In our study, we found that the major causes for blindness and visual impairment were cataract, glaucoma, AMD, retinal detachment, and neovascular glaucoma, in descending order. Pascolini and Mariotti reviewed studies on this topic and found that cataract (51%) was the most common cause of blindness(12).
Moreover, cataract has been found to be the most common cause of blindness in various population-based studies. However, the
cau-Table 2. Percentages of patients with eye diseases, visual impairment, and blindness in diferent medical specialties
Patients Patients with eye diseases Visual impairment Blindness
Medical specialty N % N % DR N % N %
Endocrinology 01 00.5 01 01.7 17
Physical medicine and rehabilitation 29 14.6 02 03.3 28 1 10
Chest diseases 09 04.5 03 05.0 28 1 10
Ophthalmology 34 17.1 34 56.7 84 2 20 32 97
Hematology 01 00.5 00 0
Cardiology 10 05.0 02 03.3 40 01 03
Ear nose throat 04 02.0 01 01.7 35 1 10
Nephrology 06 03.0 01 01.7 35 1 10
Neurology 94 47.2 13 21.7 20 4 40
Oncology 06 03.0 01 01.7 35
Psychiatry 04 02.0 01 01.7 36
Urology 01 00.5 01 01.7 36
Table 3. Ocular diseases causing visual impairment and blindness
Ocular diseases
Patients with eye diseases Blindness Visual impairment
N % N % N %
Lens-related diseases
Cataract 46 38.4 17 24.0 11 50.0
Aphakia 01 00.8 01 01.4
Total 47 39.2 18 25.4 11 50.0
Cornea-related diseases
Corneal leucoma 03 02.5 02 02.8 01 04.5
Corneal dystrophies 02 01.7 02 02.8
Bullous keratopathy 01 00.8 01 01.4
Total 06 05.0 05 07.0 01 04.5
Glaucoma-related diseases
Glaucoma 14 11.7 14 19.7
Neovascular glaucoma 07 05.8 07 10.0
Total 21 17.5 21 29.7
Retina-related diseases
Age-related macular degeneration 19 15.8 05 07.0 08 36.4
Retinal detachment 07 05.8 07 09.9
Degenerative myopia 06 05.0 05 07.0
Diabetic retinopathy 04 03.3 02 009.1
Macular dystrophies 02 01.7 02 02.8
Retinitis pigmentosa 02 01.7 02 02.8
Total 40 33.3 21 29.5 10 45.5
Optic nerve-and globe-related diseases
Optic atrophy 03 02.5 03 04.2
Phthisis bulbi 02 01.7 02 02.8
Exenteration 01 00.8 01 01.4
Total 06 05.0 06 08.4
Table 4. Associations of social security status, place of residence, regular follow-up, and gender with age, disability rates, and vision
Age (Years) TBDR (%) DR (%) Right visual acuity (logMAR) Left visual acuity (logMAR)
mean ± SD mean ± SD mean ± SD mean ± SD mean ± SD
Place of residence Rural 79.54 ± 7.09 88.87 ± 7.89 57.54 ± 31.98 1.19 ± 1.1 1.10 ± 0.92
Urban 78.68 ± 6.48 88.46 ± 8.24 64.67 ± 26.88 1.52 ± 0.9 1.59 ± 1.01
P value 0.432 0.749 0.48 0.386 0.154
Social security status SSI 78.85 ± 6.88 88.93 ± 8.05 61.03 ± 30.62 1.45 ± 1.14 1.32 ± 1.05
No-SSI 79.85 ± 6.97 88.54 ± 7.90 56.76 ± 31.68 1.06 ± 0.95 1.11 ± 0.85
P value 0.308 0.734 0.597 0.218 0.47
Regular follow-up Yes 77.27 ± 6.18 88.55 ± 8.11 48.70 ± 36.60 1.06 ± 1.02 0.76 ± 1.12
No 79.99 ± 7.04 88.82 ± 7.95 61.02 ± 29.69 1.31 ± 1.07 1.29 ± 0.92
P value 0.015 0.832 0.254 0.544 0.21
Gender Women 79.29 ± 6.88 88.26 ± 8.48 64.91 ± 29.21 1.50 ± 1.11 1.47 ± 1.05
Men 79.31 ± 7.03 89.58 ± 7.00 51.70 ± 31.99 1.01 ± 0.96 0.91 ± 0.73
P value 0.988 0.261 0.1 0.125 0.056
TBDR= total body disability rate; DR= disability rate from ophthalmologic conditions; SD= standard deviation; SSI= social security insurance; No-SSI= no social security insurance; logMAR= logarithm of the minimum angle of resolution.
ses of blindness and its prevalence vary in countries depending on their levels of economic development and even within different re-gions of the same country(13,14,23,24). A study on Latin American countries reported that unoperated cataract is the main cause of blindness(22). In
performed in European countries and the USA, which are places with high life expectancy, the most common cause of visual impairment has been shown to be AMD(25,26). In a study conducted in 2008 the Netherlands, the main cause of blindness was macular degeneration, followed by cataract, refractive errors, glaucoma, and diabetic retino-pathy(18). In the present study, we studied severely disabled elderly patients, and our study was not population based, as the aforementio-ned studies were; therefore, we were not able to compare our results with those from the previous studies.
In Turkey, there are more than 400,000 visually impaired individuals according to data from 2002. Of these, 48,500 (11.8%) individuals were blind, while 162,000 (39%) individuals had visual impairment. In Eastern Turkey, of 35,000 visually impaired, 9400 (26.7%) individuals were blind, and 11,000 (31.1%) individuals had visual impairment, whereas in industrialized and developed regions of Western Turkey, 13% were blind, and 34% had visual impairment. Forty-nine percent
of the visually impaired in Eastern Turkey and 33% in Western Turkey did not undergo treatment for their visual impairment(14). Our study was performed by retrospective analysis of two years of data from the disability board of a tertiary hospital in Eastern Turkey. Seven percent of the disabled were over 65 years old, and were classed as severely disabled. Thirty percent of these patients had ophthalmo-logic diseases, and 17% were identified as being severely disabled due to ophthalmologic diseases. In a study that assessed blindness globally, the largest proportion of blind people resided in South Asia, followed by East Asia and Southeast Asia. The prevalence of blindness varied from 0.1% in the high-income North America region to 0.7% in the North Africa and Middle East regions. Moreover, the prevalen-ce of blindness among older adults was greater than 4% in Western Sub-Saharan Africa, Eastern Sub-Saharan Africa, South Asia, North Afri-ca, and the Middle East. The prevalence of blindness was lowest in high-income regions, with percentages of 0.4% or lower(13,27). Table 6. Comparison of blind patients with visually impaired patients according to their sociodemographic characteristics
Social security status Place of residence Regular follow-up Gender
SSI No-SSI Urban Rural Yes No Men Women
N % N % N % N % N % N % N % N %
Visual impairment 06 60.0 04 40.0 4 40.0 06 60.0 0 0 10 100.0 06 60.0 04 40.0
Blindness 17 51.5 16 48.5 7 21.2 26 78.8 4 12.1 29 087.9 12 36.4 21 63.6
P value 0.801 0.715 0.248 0.184
N= number; SSI= social security insurance; No-SSI= no social security insurance.
Table 7. Comparison of blind or visually impaired patients with other severely disabled patients in terms of place of residence
Place of residence SSI Status Regular follow-up Gender
Rural Urban SSI No-SSI Yes No Women Men
N R% C% N R% C% N R% C% N R% C% N R% C% N R% C% N R% C% N R% C%
Blind or visually impaired patients
032 74.4 22.4 11 25.6 19.6 23 53.5 20.9 20 46.5 22.5 04 09.3 07.8 039 90.7 26.4 025 58.1 20 18 41.9 24.3
Others 111 71.2 77.6 45 28.8 80.4 87 55.8 79.1 69 44.2 77.5 47 30.1 92.2 109 69.9 73.6 100 64.1 80 56 35.9 75.7
P value 0.848 0.863 0.005 0.481
N= number; R%= row percentage; C%= column percentage; SSI= social security insurance; No-SSI= no social security insurance.
Table 5. Interrelationships of social security status, place of residence, regular follow-up, and gender
Place of residence Social security status
Patients with regular hospital
follow-up Gender
Rural Urban SSI No-SSI Yes No Women Men
N % N % N % N % N % N % N % N %
Place of residence Rural 143 100.0 00 0 67 046.9 76 053.1 32 022.4 111 077.6 88 061.5 55 038.5
Urban 0 0 56 100.0 43 076.8 13 023.2 19 033.9 037 066.1 37 066.1 19 033.9
P value N/A 0.000 0.093 0.552
Social security status SSI 67 060.9 43 039.1 110 100.0 00 0 29 026.4 081 073.6 73 066.4 37 033.6
No-SSI 76 085.4 13 014.6 0 0 89 100.0 22 024.7 067 075.3 52 058.4 37 041.6
P value 0.000 N/A 0.792 0.249
Regular follow-up Yes 32 062.7 19 037.3 29 056.9 22 043.1 51 100.0 000 0 29 056.9 22 043.1
No 111 75.0 37 25.0 81 054.7 67 045.3 0 0 148 100.0 96 064.9 52 035.1
Pvalue 0.093 0.792 N/A 0.308
Gender Women 88 070.4 37 029.6 73 058.4 52 041.6 29 023.2 096 076.8 125 100.0 0 0
Men 55 074.3 19 025.7 37 050.0 37 50.0 22 029.7 052 070.3 0 0 74 100.0
P value 0.552 0.249 0.308 N/A
In the Netherlands, an estimated 311,000 people are visually im-paired, and the visual loss is thought to be treatable or preventable in 174,000 (56%) of these people(18). The most common preventable and treatable cause of blindness throughout the world is cataract, and this is particularly true in developing countries. When cataracts are left untreated, the relatives of the patients, and eventually, society as a whole, face economic and moral burdens(13). It has been calculated that blindness and visual impairment constitute a financial burden of 15-73 billion US dollars per year(28,29).
According to the data from the TSI, 42.4% of all the disabled peo ple in Turkey have a disability rate of 70% or more. The percentages of disabled people living in urban areas, aged 65 years and over, and who are females constitute 62.4%, 15.2%, and 41.4%, respectively, out of all the disabled people in Turkey(14). Apart from the official data of Turkey, in our study, 27% of the individuals who received the severely disabled rating for ophthalmologic reasons came from urban areas, and 73% came from rural areas. Additionally, 79% of the blind patients came from rural areas, and the patients living in rural areas had signi-ficantly lower rates of having SSI. Health access and utilization of eye care services may be influenced by various sociodemographic factors such as age, sex, and education level(30). In our study, we found that having SSI was associated with patients’ place of residence. Patients with no SSI have to pay their own health expenses when they seek medical care in tertiary centers if they are not referred officially by a local physician, which may be an obstacle to health services. Therefore, the place of residence as a sociodemographic factor might have affected health access in our study, particularly in blind patients. In our study, we noted a higher rate of females than males aged over 65 years who were classed as severely disabled due to blindness; further, females had significantly lower rates of follow-up. Thus, gender affects health access. In all regions worldwide, women have a higher age-standardized prevalence of vision impairment and blindness than men(13). Globally, 4.2% of males and 5.3% of females aged over 70 years are blind, and 18.8% of males and 20.9% of females aged over 70 years are visually impaired,(13) suggesting lower accessibility to health for women compared with that for men. Multivariate analysis showed that patients who were severely disabled due to their ophthalmologi-cal conditions were less likely to visit hospitals than the other severely disabled patients. Compatible with this finding, it was shown that elderly people with visual impairment and/or blindness have partici-pation restrictions and activity loss that are associated with functional and cognitive decline(6-10).
In conclusion, blindness gives rise to severe disability and consti-tutes a large proportion of the diseases that lead to severe disability. The most common ophthalmologic diseases that cause severe disa-bility are cataract, glaucoma, and AMD. Sociodemographic factors that may affect the accessibility to health services of visually impaired and blind people include their place of residence and gender. Finally, visually impaired and blind people are more likely to have lower follow-up rates than other severely disabled people.
REFERENCES
1. Oeppen J, Vaupel JW. Demography. Broken limits to life expectancy. Science. 2002; 296(5570):1029-31.
2. Luigi F. Modulating human aging and age-associated diseases. Biochim Biophys Acta. 2009;1790(10):1133-8.
3. World Health Organization. The global burden of disease: 2004 update. Geneva: WHO Press;2008.
4. World Health Organization. World Health Organization Report on Disability 2011. Geneva: WHO Press; 2011.
5. World Health Organization. Global Initiative for the Elimination of Avoidable Blindness action plan 2006-2011. Geneva: WHO Press; 2007.
6. Alma MA, Van der Mei SF, Feitsma WN, Groothoff JW, Van Tilburg TG, Suurmeijer TP. Loneliness and self-management abilities in the visually impaired elderly. J Aging Health. 2011;23(5):843-61.
7. Avlund K, Lund R, Holstein BE, Due P. Social relations as determinant of onset of disability in aging. Arch Gerontol Geriatr. 2004;38(1):85-99.
8. Glei DA, Landau DA, Goldman N, Chuang YL, Rodriguez G, Weinstein M. Participating in social activities helps preserve cognitive function: an analysis of a longitudinal, population based study of the elderly. Int J Epidemiol. 2005;34(4):864-71. 9. Rovner BW, Casten RJ, Leiby BE, Tasman WS. Activity loss is associated with cognitive
decline in age-related macular degeneration. Alzheimers Dement. 2009;5(1):12-7. 10. Newall NE, Chipperfield JG, Clifton RA, Perry RP, Swift AU, Ruthig JC. Causal beliefs,
social participation, and loneliness among older adults: a longitudinal study. J Soc Pers Rel. 2009;26(2-3):273-90.
11. Resnikoff S, PascoliniD, Etya’ale D.Global data on visual impairment in the year 2002. Bull World Health Organ. 2004;82(11):844-51.
12. Pascolini D, Mariotti SP. Global estimates of visual impairment: 2010. Br J Ophthalmol. 2012;96(5):614-8.
13. Stevens GA, White RA, Flaxman SR, Price H, Jonas JB, Keeffe Jet al. Global prevalence of vision impairment and blindness: magnitude and temporal trends, 1990-2010. Oph thalmology. 2013;120(12):2377-84.
14. Turkish Statistical Institute [Internet]. Turkey Disability Survey 2002. 2nd ed. State Institute of Statistics, Printing Division - Ankara, September 2009. [cited 2015 Nov 2]. Available from: http://www.die.gov.tr
15. Republic of Turkey. Social Security Instutition [Internet] 2011. Statistical yearbook. [cited 2015 Nov 2]. Available from: http://www.ssk.gov.tr/wps/portal/tr/kurumsal/ istatistikler/sgk_istatistik_yilliklari
16. Üstün T, Chatterjı S, Bıckenbach J, Kostanjsek N, SchneıderM. The International Classi-fication of Functioning, Disability and Health: A new tool for understanding disability and health. Disabil Rehabil. 2003;25(11-12):565-71.
17. Olcaysü OO, Kıvanç SA, Altun A, Çinici E, Altınkaynak A, Ceylan E. Causes of disability, low vision and blindness in old age. 2014;17(1):44-9
18. Limburg H, Keunen JE. Blindness and low vision in The Netherlands from 2000 to 2020-modeling as a tool for focused intervention. Ophthalmic Epidemiol. 2009;16(6): 362-9.
19. Turkish Statistical Institute [Internet]. Statistics by Theme; Population projections. [cited 2015 Nov 2]. Available from: http://www.turkstat.gov.tr/PreTablo.do?alt_id=1027. 20. Limburg JJ, Keunen JE, van Rens GH. Elderly people with visual impairment in the
Netherlands. Tijdschr Gerontol Geriatr. 2009;40(4):149-55.
21. Nowak MS, Smigielski J. The prevalence and causes of visual impairment and blind-ness among older adults in the city of Lodz, Poland. Medicine (Baltimore). 2015;94(5): e505.
22. Silva JC, Mújica OJ, Vega E, Barcelo A, Lansingh VC, McLeod J et al. A comparative assessment of avoidable blindness and visual impairment in seven Latin American countries: prevalence, coverage, and inequality. Rev Panam Salud Publica. 2015;37(1): 13-20.
23. Hennis AJ, Wu SY, Nemesure B, Hyman L, Schachat AP, Leske MC. Barbados Eye Stu-dies Group. Nine-year incidence of visual impairment in the Barbados Eye StuStu-dies. Ophthalmology. 2009;116(8):1461-8.
24. Duerksen R, Limburg H, Lansingh VC, Silva JC. Review of blindness and visualimpair-ment in Paraguay: changes between 1999 and 2011. Ophthalmic Epidemiol. 2013; 20(5):301-7.
25. Eye Diseases Prevalence Research Group. Causes and prevalence of visual impairment among adults in the United States. Arch Ophthalmol. 2004;122(4):477-85. 26. Klaver CC, Wolfs RC, Vingerling JR, Hofman A, de Jong PT. Age-specific prevalence
and causes of blindness and visual impairment in an older population: the Rotterdam Study. Arch Ophthalmol. 1998;116(5):653-8.
27. Bourne RR, Stevens GA, White RA, Smith JL, Flaxman SR, Price H, et al. Causes of vision loss worldwide, 1990-2010: a systematic analysis. Lancet Glob Health; 2013;1(6):e339-49. 28. Roberts CB, Hiratsuka Y, Yamada M, Pezzullo ML, Yates K, Takano S, et al. Economic
cost of visual impairment in Japan. Arch Ophthalmol. 2010;128(6):766-71. 29. Cruess AF, Gordon KD, Bellan L, Mitchell S, Pezzullo ML. The cost of vision loss in
Canada. 2. Results. Can J Ophthalmol. 2011;46(4):315-8.