186
ORIGINAL ARTICLE
EXERCISE AND SPORTS MEDICINE CLINIC
OXYGEN UPTAKE KINETICS AT MODERATE AND
EXTREME SWIMMING INTENSITIES
Ana Sousa1
Kelly de Jesus1
Pedro Figueiredo1
João Paulo Vilas-Boas1,2
Ricardo J. Fernandes1,2
1. Centre of Research, Education, Innovation and Intervention in Sport, Faculty of Sport, University of Porto, Portugal.
2.Laboratory of Biomechanics LABIOMEP, University of Porto, Portugal.
Mailing address:
Centro de Investigação, Formação, Inovação e Intervenção em Desporto (CIFI2D), Faculdade de Desporto, Universidade do Porto, Portugal Rua Dr. Plácido Costa 91, 4.200 Portugal.
E-mail: [email protected]
ABSTRACT
Introduction: Traditionally, studies regarding oxygen consumption kinetics are conducted at lower intensities, very different from those in which the sports performance occurs. Objective: Knowing that the magnitude of this physiological parameter depends on the intensity in which the effort occurs, it was intended with this study to compare the oxygen consumption kinetics in the 200 m front crawl at two different intensities: moderate and extreme. Methods: Ten male swimmers of international level performed two tests separated by 24h: (i) progressive and intermittent protocol of 7 x 200 m,
with 30 seconds intervals and with increments of 0.05m.s-1, to determine the anaerobic threshold
correspondent step; and, (ii) 200 m at maximal velocity, in both expiratory gases were continuously collected breath-by-breath. Results: Significant differences were obtained between amplitude and time constant determined in the 200 m at extreme and moderate intensities, respectively (38.53
± 5.30 ml. kg-1.min-1 versus 26.32 ± 9.73 ml. kg-1.min-1 and 13.21 ± 5.86 s versus 18.89 ± 6.53 s
(p ≤ 0.05). No differences were found in time delay (9.47 ± 6.42 s versus 12.36 ± 6.62 s, at extreme
and moderate intensity, respectively (p ≤ 0.05). A negative correlation between time delay and time constant at the moderate intensity was reported (r = - 0.74, p ≤ 0.05). Conclusions: Both intensities were well described by double-exponential fittings and there were significant differences between them in terms of amplitude and time constant.
Keywords: swimming, VO2 kinetics, moderate intensity, extreme intensity.
INTRODUCTION
The magnitude and nature of the adjustment of the oxygen
consumption (VO2) at the beginning of any physical exercise
stron-gly depends on the intensity at which the effort is performed1. In
fact, at moderate intensities, where exercise is performed below
the anaerobic threshold, the VO2 reaches a quick balance state after
a single growth phase, which is named fast component2. At high
intensity though, for example, above the anaerobic threshold, the
VO2 kinetics reveals a new phase – the slow component –,
whi-ch, when appearing after the fast component, delays the onset
of the balance state of VO23. At severe intensities, where exercise
is performed significantly above the anaerobic threshold, the VO2
and blood lactate values ([La-]) are not able to stabilize, and
the-refore, the VO2 kinetics exposes two components (fast and slow),
finishing the exercise before it is possible to obtain a balance state4.
Although it has been described very recently, the extreme inten-sity domain, being performed at inteninten-sity above maximal oxygen
consumption (VO2max), reflects the intensity at which the majority
of the competitive efforts occur2. However, few studies have been
conducted in this domain, being almost unexplored in swimming, especially at higher intensities. The aim of the present work is to
analyze and compare the VO2 kinetics at two distinct swimming
intensities, in conditions as close as possible to the ones obtained
during competition: (i) moderate intensity, analyzing 200 m crawl
at intensity corresponding to the individual anaerobic threshold –
lanind); and (ii) extreme intensity, evaluating 200 m crawl swam at
maximum intensity.
METHODS
Sample
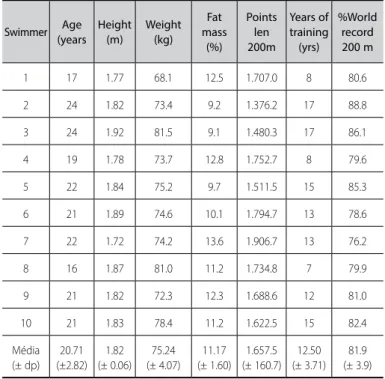
10 male swimmers of international level participated in this stu-dy. The individual and mean (± sd) values of their main physical characteristics and of competitive swimming practice are presented in table 1. The body weight and fat mass values were determined through bioelectrical impedance (Tanita TBF 305, Tokyo, Japan). All subjects were previously informed about the details of the expe-rimental protocol before the data collection, having offered their written consent for the participation. The protocol was approved by the ethics committee of the local Institution.
Instruments and procedures
All experimental sessions occurred in an indoors 25 m acclima-tized swimming pool (27ºC), with relative humidity of 45%. Each
subject performed two distinct protocols in the crawl style, and an
interval of 24 hours between them was respected. A progressive and interval protocol of 7 x 200 m, with 30 seconds of interval with
increments of 0.05m.s-1 between each step5,6. The velocity of the
last step was determined according to the performance hypothe-tically reached at that time at 400 m crawl, subtracting later to six intensity thresholds; swimming velocity was controlled with a light pacer (TAR 1.1, GBK – electronics, Aveiro, Portugal), placed in the bottom of the pool. This test was used to determine the 200 m which was closer (or coinciding) with the velocity corresponding to
the lanind., 24 hours after that, the 200 m crawl at maximum velocity
Table 1. Individual and mean (± dp) values of the main physical characteristics and sports performance of the swimmers.
Swimmer Age (years
Height (m)
Weight (kg)
Fat mass (%)
Points len 200m
Years of training (yrs)
%World record 200 m
1 17 1.77 68.1 12.5 1.707.0 8 80.6 2 24 1.82 73.4 9.2 1.376.2 17 88.8 3 24 1.92 81.5 9.1 1.480.3 17 86.1 4 19 1.78 73.7 12.8 1.752.7 8 79.6 5 22 1.84 75.2 9.7 1.511.5 15 85.3 6 21 1.89 74.6 10.1 1.794.7 13 78.6 7 22 1.72 74.2 13.6 1.906.7 13 76.2 8 16 1.87 81.0 11.2 1.734.8 7 79.9 9 21 1.82 72.3 12.3 1.688.6 12 81.0 10 21 1.83 78.4 11.2 1.622.5 15 82.4 Média
(± dp) 20.71 (±2.82)
1.82 (± 0.06)
75.24 (± 4.07)
11.17 (± 1.60)
1.657.5 (± 160.7)
12.50 (± 3.71)
81.9 (± 3.9)
Figure 1. Experimental instrument used for collection of ventilatory gas.
(1)
(2) the water, and the swimmers were told to perform open laps, always
to the same side and without gliding. The VO2 was measured
throu-gh continuous expired gas collection breath-by-breath throuthrou-gh a
portable gas analyzer (K4b2, Cosmed, Italy), which was connected
to the swimmer through a respiratory tube and valve considered suitable for ventilatory gas parameters collection in swimming
situ-ations8. All that experimental equipment was lifted 2 m above the
water surface on a steel cable, which made it possible to follow the swimmer along the pool, minimizing discomfort to the swimmer’s movements (figure 1).
In order to minimize the noise resulting from the gas collec-tion breath-by-breath, data were then edited to exclude faulty breathing (e.g. coughing), which do not realistically represent the subjacent kinetics, being only considered the values comprised
between the mean ± four standard deviations9. Subsequently,
the data obtained breath-by-breath were softened through a
movable mean of three breaths10 and recorded in mean
peri-ods of five seconds11, increasing the validity of the estimated
parameter. Capillary blood was collected from the earlobe and
used to determine the [La-] using a portable analyzer (Lactate
Pro analyzer, Arcay, Inc). The collections occurred before each
protocol, during the recovery periods (incremental protocol) and at the end of them (at minutes 1, 3, 5 and 7 of recovery).
The [La-] enabled the determination of lan
ind, in the
incremen-tal protocol through the [La-] curve modeling versus velocity,
assuming it was the interception point of the best adjustment of linear and exponential regressions used for determination of the exact point of the beginning of exponential increase of
[La-]12,13. In all swimmers from the sample, the inflexion point of
the [La-] occurred at the 4th step of the incremental protocol.
Heart rate values were continuously monitored (at each five seconds) through a monitor system (Polar Vantage NV, Polar Electro Oy, Kempele, Finland).
In order to analyze the VO2 kinetics, the curves considered
(from the 200m corresponding to the lanind and from 200 m
at maximal velocity) were modeled considering a mono-expo-nential fitting (equation 1):
Where t is the time (s), Vb is the VO2 value at the beginning
of the exercise (ml.kg-1.min-1), A is the amplitude of the fast
component (ml.kg-1.min-1), TD is time of beginning of the fast
component (s) and t is the time constant of the fast component
(s), i.e., the time needed to reach 63% of the plateau of this phase.
Additionally, the VO2 curves corresponding to the Ianind were
also modeled considering two exponential phases (equation 2 – bi-exponential):
Where t is the time (s), Vb is the VO2 value at the beginning of
the exercise (ml.kg-1.min-1), A
1 and A2 are the amplitude of the fast
and slow components (ml.kg-1.min-1), TD
1 and TD2 are the times of
the beginning of the fast and slow components (s) and t1 and t2 are
the time constants of the fast and slow components (s), respectively. The linear method of the minimum squares was implemented in the
Matlab program for the adjustment of this function to the VO2 data.
Statistical Analysis
The mean values (± standard deviation) for the descriptive analysis were obtained for all the variables of the study, for the total sample and each subject, and normality of its distribution was verified through the Shapiro-Wilk test. The SPSS program (linear regression, and the T-Test of repeated measures) was used for the inferential statistical analysis, and significance level was established at 0.05. The F-Test was used for comparison of the
monoexponen-tial and bi-exponenmonoexponen-tial fitting of the VO2 curves corresponding to
the lanind. swimming intensity.
RESULTS
The F-Test (p = 0.91) presented the homogeneity of the variance of the monoexponential and bi-exponential models used to analyze
the 200 m crawl performed at the intensity corresponding to the
lanind, which was confirmed by the equality of mean values through
the T-Test (p = 0.97). Thus, in the present study the VO2 kinetics
188
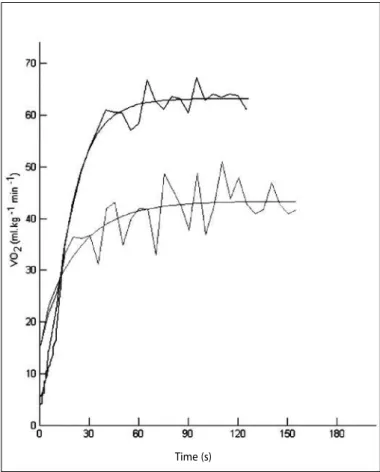
Figure 2. Example of two curve of the oxygen consumption kinetics correspond-ing to two distinct intensities – to the individual anaerobic threshold (gray color) and to the maximum velocity of 200 m crawl (black color).
Table 2.Individual and mean (± sd) values of Alan, A200, tlan, t200, TDlan and TD200
corresponding to the threshold where lanind occurred in the incremental protocol and at 200 m performed at maximum velocity.
Swimmer Alan (ml.-kg-1.
min-1)
A200 (ml.-kg-1.
min-1) tlan (s)
t200 (s)
TDlan (s)
TD200 (s)
#1 38.52 44.83 23.60 18.16 4.90 19.51 #2 31.05 32.03 19.17 22.32 9.99 15.00 #3 22.86 32.54 23.75 8.82 9.51 2.36 #4 26.73 33.57 8.85 9.33 4.99 9.99 #5 37.32 36.81 20.63 14.56 7.90 9.00 #6 18.57 45.18 23.49 22.41 17.37 4.32 #7 28.92 45.63 12.93 7.05 9.99 5.15 #8 34.52 40.72 7.79 11.01 25.0 4.98 #9 31.45 36.02 9.91 7.39 20.0 19.59 #10 22.94 36.97 20.24 11.14 13.99 4.81 Mean
(± sd)
26.32 (± 9.73)
38.43 (± 5.30)*
18.89 (± 6.53)
13.21 (± 5.86)*
12.36 (± 6.62)
9.47 (± 6.42)
Alan, A200 = amplitude of the 200 m at the intensity corresponding to lanind and maximum velocity, respectively; TDlan, TD200 = time delay of the 200 m at intensity corresponding to lanind and maximum velocity, respectively; tlan, t200 = time constant of the 200 m at intensity corresponding to lanind and maximum velocity, respectively. * Significantly different from the respective kinetic parameter corresponding to the intensity individual anaerobic threshold.
Figure 3. Ratio obtained between time of the beginning of the fast component to the intensity corresponding to the individual anaerobic threshold (TDlan) and the
time constant of the fast component to the intensity corresponding to the individual anaerobic threshold (tlan) (y = 26.62 – 0.75x, n = 10, r = -0.74, p ≤ 0.05).
TD
lan
(s)
tlan (s) Time (s)
by a monoexponential function, not being positive to use a bi--exponential function. Figure 2 presents two illustration curves of
the VO2 kinetics of one swimmer, in the 200 m corresponding to
the lanind, and in the 200 m performed at maximum intensity.
The mean values (± sd) of Alan, A200, tlan, t200, TDlan and TD200,
at moderate and extreme intensities, are presented in table 2. Statistically significant differences were obtained in two ki-netic parameters (amplitude and time constant) between the
200 m performed at the lanind and maximal velocity intensities.
Additionally, negative correlations were found between TDlan and
tlan (R = -0.74, p = 0.01, figure 3). Nonetheless, further significant
relations were not found in the remaining studied parameters.
validity and applicability of their results. Concerning swimming,
only Rodríguez et al.14, Rodríguez et al.15 and Sousa et al.7
car-ried out studies at high intensities and at conditions as close as possible to the real swimming conditions, and there are no comparative studies between intensity domains.
Exercise intensity below the Ianind is characterized by the
presence of three distinct phases: cardiodynamic, fast and the
VO2 stabilization which occurs three minutes after the beginning
of the exercise16. The intensity immediately above the lan
ind presents an additional phase (slow component), which delays
the onset in the VO2 stabilization, appearing approximately 10
DISCUSSION
The aim of the present study was to assess and compare the
VO2 kinetics in 200 m crawl performed at two distinct swimming
intensities: moderate (corresponding to the lanind) and extreme
(at maximal intensity). Since these two intensities are considered very important in the swimming training, as they are used for the development of the aerobic and anaerobic capacities,
respec-tively, it seems crucial to provide better understanding on the VO2
minutes after the beginning of the effort2. However, being the upper boundary of the moderate intensity and,
consecutive-ly, the lower one in the high intensity domain, the lanind is an
intensity little studied concerning the VO2 kinetics. However,
Ozyener et al.9 refer that moderate intensities are well-described
by monoexponential fittings, instead of the high intensities (high and sever intensity domains) which are better characterized by bi-exponential fittings.
In the present study, and considering the F-Test values, it
was verified that the intensity corresponding to the lanind, the
VO2 kinetics will be possibly described considering the existence
of a single phase (fast component) and, consequently, the use of a bi-exponential fitting becomes unnecessary. Although no study has been carried out at this specific intensity, other ones conducted at the moderate intensity domain presented
mono-exponential fitting in the VO2 kinetics17-21. Concerning extreme
intensity, monoexponential fittings were previously defined as
being more positive for this intensity domain7.
Concerning the kinetic parameters, we verified that they are significantly different between the two exercise intensities stu-died, especially regarding amplitude and time constant. Thus, higher values of these two parameters were obtained in the 200 m crawl performed at maximal velocity, contrary to the time
delay whose mean values were higher at the intensity
corres-ponding to the lanind. The amplitude values corroborate the ones
presented in the literature, either for the moderate 3,17,19,21 or
for the extreme domain7, where only the later was carried out
with swimming. The tendency for higher values of amplitude in the extreme domain supports the literature carried out in
cycle ergometer18,19,21 and in domains of high intensity22. These
differences are due to the higher values of VO2 reached in the
extreme domain (higher oxygen demand), since as the effort intensity increases, the amplitude gain is higher. This fact is
well--explained in figure 2, where the higher VO2 values reached at
the end of the exercise can be observed.
Despite this, higher VO2 values are also observed at the
beginning of the moderate effort, comparatively to the effort performed at extreme intensity. Such fact is due to the previous
performance of the 200 m crawl steps included in the protocol
used (cf. instrument and procedures section) and that, despite
being performed at low intensity, induced an increase in the VO2
baseline values at the beginning of the following step. However, studies conducted refer that only previous exercise of high inten-sity conditions and influences the following efforts, namely slow
component VO223,24 kinetics. Thus, it seems that the existence of
low intensity plateaus preceding the effort corresponding to
the lanind did not influence the respective VO2 kinetics to lanind.
Significant differences went to the time constant, being higher at
the intensity corresponding to the lanind, clashing hence with some
studies which refer the constancy of this parameter along the
diffe-rent intensities17,19,21. However, it should be mentioned that the later
ones were performed in cycle ergometer and comparing moderate to high intensity and/or severe domains.
In spite of this information, the values of the time constant
observed for the 200 m crawl performed at maximal velocity are
lower than the ones reported in the literature14,15, especially for
the 100 and 400 m distances, but similar to the ones by Sousa et
al.7 for the same distance. Regarding the intensity corresponding
to the lanind,the values presented corroborate the ones reported
in the literature for efforts performed in cycle ergometer17-21.
In the present study, the fact the time constant is not similar between the two intensities seems to be due to the extreme
intensity at which the 200 m crawl were performed. Therefore,
and since the value of the time constant describes the adapta-tion profile of the cardiovascular and muscular systems at the
intensity of the performed effort25, the sudden and exponential
need of VO2 to higher intensities (figure 2) will be able to explain
the lower values of this parameter.
The time delay was the only kinetic parameter where sig-nificant differences have not been verified between the two studied intensities, corroborating the studies which compare the
moderate and high exercise domains17 and moderate and severe
domains19. However, Pringle et al.21 showed that this parameter
ranges between the moderate, high and severe domains. Althou-gh the mean values found in our study are lower than the ones
found in the literature for the moderate domain17,19,21, the values
corresponding to the extreme domain agree with the only study
conducted in the swimming environment for the 200 m distance7.
In the moderate domain, the differences found may be due to the fact the studies mentioned have been conducted in different sports modalities.
The negative correlation observed between the delay and
time constant in the 200 m crawl performed at lanind intensities
has not been previously reported in the literature; nevertheless, in the present sample the swimmers, whose fast component
of VO2 started earlier (shorter time delay), were those who also
needed more time (longer time constant) until they reached
stabilization in the VO2 consumption. Thus, the sports
perfor-mance level of our sample (high level) as well as its specialty (sprinters) seem to be two factors which explain the correlations reported here.
CONCLUSION
Both were well described by mono exponential fittings and significant differences have been verified between them con-cerning amplitude and time constant. Thus, higher values of
these two kinetic parameters have been obtained in 200 m crawl
performed at maximum velocity, contrary to the timed delay whose mean was higher at the intensity corresponding to the
lanind.Additionally, negative correlations have been obtained
between TDlan and tlan.
ACKNOWLEDGEMENTS
Science and Technology Foundation (PTDC/DES/101224/2008; SFRH/BD/72610/2010).
190
REFERENCES
1. Jones A, Burnley M. Oxygen uptake kinetics: an underappreciated determinant of exercise performance. Int J Sport Physiol Perform 2009;4:524-32.
2. Burnley M, Jones A. Oxygen uptake kinetics as a determinant of sports performance. Eur J Sport Sci 2001;7:63-79.
3. Barstow TJ, Mole PA. Linear and nonlinear characteristics of oxygen uptake kinetics during heavy exercise. J Appl Physiol 1991;71:2099-106.
4. Gaesser GA, Poole DC. The slow component of oxygen uptake kinetics in humans. Exercise Sport Sci R 1996;24:35-70.
5. Fernandes RJ, Cardoso CS, Soares SM, Ascensão A, Colaço PJ, Vilas-Boas JP. Time limit and VO2 slow component at intensities corresponding to VO2max in swimmers. Int J Sport Med 2003;24:576-81. 6. Fernandes RJ, Keskinen KL, Colaço P, Querido AJ, Machado L, Morais PA, et al. Time limit at VO2max
velocity in elite crawl swimmers. Int J Sport Med 2008;29:145-50.
7. Sousa A, Figueiredo P, Oliveira N, Oliveira J, Silva A, Keskinen KL, et al. VO2 kinetics in 200-m race-pace front crawl swimming. Int J Sport Med 2011;32:1-6.
8. Baldari C, Guidetti L, Meucci M. Measuring energy expenditure in swimming to assess gross mechanical efficiency. Port J Sport Sci 2011;11(suppl 3):65-8.
9. Ozyener F, Rossiter H, Ward S, Whipp B. Influence of exercise intensity on the on and off-transient kinetics of pulmonary oxygen uptake in humans. J Physiol 2001;533:891-902.
10. Guidetti L, Emerenziani G, Gallotta M, Silva S, Baldari C. Energy cost and energy sources of a ballet dance exercise in female adolescents with different technical ability. Eur J Appl Physiol 2008;103:315-21. 11. Sousa A, Figueiredo P, Oliveira N, Oliveira J, Keskinen KL, Vilas-Boas JP, et al. Comparasion between
VO2peak and VO2max at different time intervals. Open Sports Sci J 2010;3:22-4.
12. Fernandes R, Sousa M, Machado L, Vilas-Boas JP. Step Length and Individual Anaerobic Threshold Assessment in Swimming. Int J Sport Med 2011;32:940-6.
13. Machado L, Almeida M, Morais P, Fernandes RJ, Vilas-Boas JP. Assessing the individual anaerobic threshold: the mathematical model. Port J Sport Sci 2006;6:142 – 144.
14. Rodríguez F, Keskinen K, Malvela M, Keskinen O. Oxygen uptake kinetics during free swimming: a
pilot study. In: Chatard, J.E. (ed). IX Biomechanics and Medicine in Swimming 2003. Publications de l’ Université de Saint- É tienne, 2003;379-84.
15. Rodríguez F, Keskinen K, Keskinen O. Oxygen uptake kinetics during front crawl swimming. Arch Med Sport 2008;25:128.
16. Xu F, Rhodes E. Oxygen uptake kinetics during exercise. Sports Med 1999;27:313-27.
17. Carter H, Jones A, Barstow T, Burnley M, Williams A, Doust J. Oxygen uptake kinetics in treadmill running and cycle ergometry: a comparison. J Appl Physiol 2000;89:899-907.
18. Carter H, Pringle J, Jones A, Doust J. Oxygen uptake during treadmill running across exercise intensity domains. Eur J Appl Physiol 2002;86:347-54.
19. Cleuziou C, Perrey S, Borrani F, Lecoq AM, Courteix D, Germain P, et al. VO2 and EMG activity kinet-ics during moderate and severe constant work rate exercise in trained cyclists. Can J Appl Physiol 2004;29:758-72.
20. Fawkner S, Armstrong N, Potter C, Welsman J. Oxygen uptake kinetics in children and adults after the onset of moderate intensity exercise. J Sport Sci 2002;20:319-26.
21. Pringle J, Doust J, Carter H, Tolfrey K, Campbell I, Jones A. Oxygen uptake kinetics during moderate, heavy and severe intensity “submaximal” exercise in humans: the influence of muscle fibre type and capillarisation. Eur J Appl Physiol 2003;89:289-300.
22. Scheuermann B, Barstow T. O2 uptake kinetics during exercise at peak O2 uptake. J Appl Physiol 2003;95:2014-22.
23. Koppo K, Bouckaert J. In humans the oxygen uptake slow component is reduced by prior exercise of high as well as low intensity. Eur J Appl Physiol 2000;83:559-65.
24. Koppo K, Bouckaert J. The effect of prior high intensity cycling exercise on the VO2 kinetics during high intensity cycling exercise is situated at the additional slow component. Int J Sport Med 2000;22:21-6.