Rev. Bras. Hematol. Hemoter. vol.39 número3
Texto
Imagem
Documentos relacionados
Conclusion: The negative association between human leukocyte antigens and the BCR-ABL transcript suggests that binding and presentation of peptides derived from the chimeric
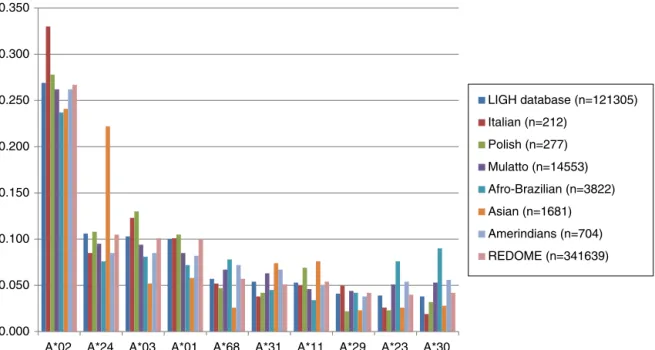
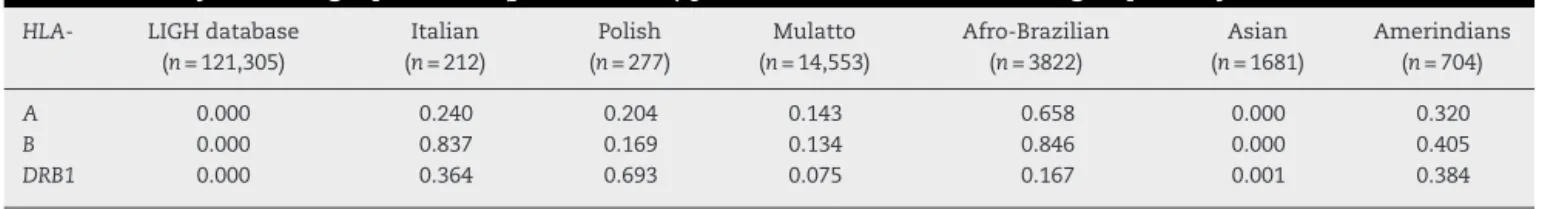
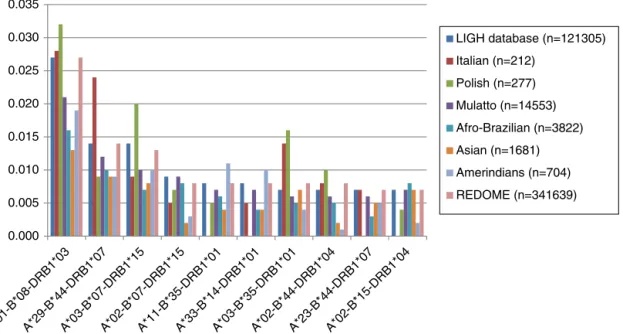
alleles and haplotypes of the human leukocyte antigen sys- tem in Bauru, São Paulo” published in the current edition of the Revista Brasileira de Hematologia e Hemoterapia , aimed
Human leukocyte antigen (HLA) haplotype frequencies calculated for alleles in high linkage disequilibrium may predict for non-HLA antigen match versus mismatch.. There is
A threshold of 100 ng/mL for serum ferritin yielded a sensitivity of 60% and specificity of 59% for IDA detection, employing a low transferrin saturation level as the reference test
Utility of access soluble transferrin receptor (sTfR) and sTfR/log ferritin index in diagnosing iron deficiency anemia. Ann Clin
included 38 patients with a median of four previous treat- ments, 87% of whom had received an auto-SCT, the objective overall response rate and complete response rate were 19% and
Quantitative monitoring of the percentage of the fusion tran- script BCR-ABL1 (breakpoint cluster region – c-Abelson murine leukemia oncogene 1, non-receptor tyrosine kinase) by
(iii) By using quantitative fluorescent beads labeled with a known number of phycoerythrin (PE) molecules, the curve of fluorescence intensity can be extrapolated to evaluate the
