Cancer Risk in a Chinese Population
Zili Zhang
1☯, Jian Wang
1☯, Jianxing He
1☯, Zeguang Zheng
1☯, Xiansheng Zeng
2☯, Chenting Zhang
1, Jinmei
Ye
1, Yajie Zhang
3, Nanshan Zhong
1, Wenju Lu
1,4*1 State Key Laboratory of Respiratory Diseases, Guangzhou Institute of Respiratory Disease, The First Affiliated Hospital, Guangzhou Medical University, Guangzhou, Guangdong, China, 2 Department of Respiratory Medicine, Xiangyang Central Hospital, Xiangyang, Hubei, China, 3 Department of Pathology, Guangzhou Medical University, Guangzhou, Guangdong, China, 4 Department of Laboratory Medicine, The First Affiliated Hospital, Guangzhou Medical University, Guangzhou, Guangdong, China
Abstract
Mucin MUC4, which is encoded by the MUC4 gene, plays an important role in epithelial cell proliferation and differentiation. Aberrant MUC4 overexpression is associated with invasive tumor proliferation and poor outcome in epithelial cancers. Collectively, the existing evidence suggests that MUC4 has tumor-promoter functions. In this study, we performed a case-control study of 1,048 incident lung cancer cases and 1,048 age- and sex frequency-matched cancer-free controls in a Chinese population to investigate the role of MUC4 gene polymorphism in lung cancer etiology. We identified nine SNPs that were significantly associated with increased lung cancer risk (P = 0.0425 for rs863582, 0.0333 for rs842226, 0.0294 for rs842225, 0.0010 for rs2550236, 0.0149 for rs2688515, 0.0191
for rs 2641773, 0.0058 for rs3096337, 0.0077 for rs859769, and 0.0059 for rs842461 in an additive model). Consistent with these single-locus analysis results, the haplotype analyses revealed an adverse effect of the haplotype “GGC” of rs3096337, rs859769, and rs842461 on lung cancer. Both the haplotype and diplotype “CTGAGC” of rs863582, rs842226, rs2550236, rs842225, and rs2688515 had an adverse effect on lung cancer, which is also consistent with the single-locus analysis. Moreover, we observed statistically significant interactions for rs863582 and rs842461 in heavy smokers. Our results suggest that MUC4 gene polymorphisms and their interaction with smoking may contribute to lung cancer etiology.
Citation: Zhang Z, Wang J, He J, Zheng Z, Zeng X, et al. (2013) Genetic Variants in MUC4 Gene Are Associated with Lung Cancer Risk in a Chinese Population. PLoS ONE 8(10): e77723. doi:10.1371/journal.pone.0077723
Editor: Xiaoping Miao, Huazhong University of Science and Technology, China Received August 19, 2013; Accepted September 3, 2013; Published October 21, 2013
Copyright: © 2013 Zhang et al. This is an open-access article distributed under the terms of the Creative Commons Attribution License, which permits unrestricted use, distribution, and reproduction in any medium, provided the original author and source are credited.
Funding: This work was supported by the National Natural Science Foundation of China (81070043, 81071917, 81173112, 81170052, 81220108001), the Chinese Central Government Key Research Projects of the 973 grants (2009CB522107), a Changjiang Scholars and Innovative Research Team in University grant (IRT0961), a Guangdong Natural Science Foundation team grant (1035101200300000), the Guangdong Department of Science and Technology of China (2009B050700041, 2010B031600301), the Guangdong Province Universities and Colleges Pearl River Scholar Funded Scheme (2008) China, a Guangdong Department of Education research grant (cxzd1025), and a Guangzhou Department of Education Yangcheng Scholarship (10A058S, 12A001S). The funders had no role in study design, data collection and analysis, decision to publish, or preparation of the manuscript. Competing interests: The authors have declared that no competing interests exist.
* E-mail: wlu92@yahoo.com
☯ These authors contributed equally to this work.
Introduction
Lung cancer is the most common cancer in the world and accounted for 13% (1.6 million) of total cases and 18% (1.4 million) of cancer deaths in 2008 [1]. In China, the incidence and mortality rates of lung cancer have grown rapidly in the past few decades [2], and it is now the leading cause of cancer mortality; the average 5-year survival rate is <15% [3,4]. The lung cancer epidemic is directly attributable to cigarette smoking, which accounts for 87% of lung cancer cases. However, only a small percentage of smokers (<20%) develop lung cancer in their lifetime [5], suggesting that genetic susceptibility may play a role in lung cancer development.
increased risk of lung cancer in patients with inflammatory airway phenotypes, such as asthma, bronchitis, and emphysema [14,15]. Recent data suggest that cigarette smoke activates airway epithelial cells and immune cells to release proinflammatory cytokines, such as cyclooxygenase-2 (cox-2), interleukins-4, 6, and 8 (IL-4, -6, -8) and tumor necrosis factor-α (TNF-factor-α).
Mucins have long been known to be target molecules of inflammatory reactions, and inflammatory diseases of the epithelium are often characterized by mucin upregulation and hypersecretion [16–20]. Moreover, abnormal MUC4 expression has been reported in various cancers, such as pancreatic adenocarcinomas [21] and colon carcinomas [22], as well as in other lung and airway inflammatory diseases including cystic fibrosis and chronic obstructive pulmonary disease [23–25]. Growth factors are thought to be involved in mucus-secreting cell production because hypersecretory diseases are associated with abnormal epithelial cell growth and proliferation [26].
In addition to its adverse effects in inflammatory diseases, MUC4 also plays a critical role in regulating diverse processes in lung stromal/parenchymal cells, including apoptosis and metastasis. MUC4 acts as an intramembrane ligand for ErbB2/ HER2/neu and potentiates its autophosphorylation [27]. It has been found that MUC4-induced ErbB2/neu signaling may mediate the antiapoptotic function of MUC4 [28]. Moreover, MUC4 may possess a tumor-promotion function, in part by regulating HER2 gene expression. ErbB2/HER2 expression levels have been correlated with tumor size and lymph node metastasis, suggesting the involvement of ErbB2 and ErbB2-mediated signaling in tumorigenesis [29]. Taken together, these observations imply that MUC4 may promote tumor progression in human lung cancer pathogenesis.
The present work was motivated by the biological plausibility that genetic variation in MUC4 could alter its expression level or biochemical function and thus may have an impact on individual lung cancer risk. To test this hypothesis, we conducted a case-control study of 1,048 incident lung cancer cases and 1,048 age- and sex- frequency-matched, cancer-free controls in a Chinese population. We also investigated potential interactions between tagSNPs of the MUC4 gene and cigarette smoking in lung cancer risk.
Methods
Study subjects
The study design and subject recruitment were described as below: briefly, the 1,048 lung cancer patients and 1,048 cancer-free controls were genetically unrelated ethnic Han Chinese from Guangzhou City. Patients with histopathologically confirmed incident lung cancer were consecutively recruited from September 2009 to September 2011 in the Thoracic Surgery Department of The First Affiliated Hospital of Guangzhou Medical University. The 1,048 cancer-free controls that were frequency matched to patients by sex and age (±5 years) were randomly selected from the Health Examination Center of the same hospital during the same time period. Before recruitment, written informed consent was obtained
from each eligible subject, and a structured questionnaire was administered by interviewers to collect information on demographic data and environmental exposure history, including tobacco smoking and alcohol intake. Subjects were identified as nonsmokers or smokers. Individuals who had smoked fewer than 100 cigarettes in their lifetime were defined as nonsmokers; otherwise, they were defined as smokers (those smokers who stopped smoking for >1 year were also defined as smokers). Pack-years were calculated by multiplying the number of packs of cigarettes smoked per day by the number of years the person has smoked. Similarly, participants who had consumed alcoholic beverages at least once a week for the previous year were defined as drinkers, and the others were considered nondrinkers. Family history of cancer was defined as any self-reported cancer in first-degree relatives (parents, siblings, or children). After the interview, a 5-ml venous blood sample was collected from each participant. The study was approved by the institutional review board of Guangzhou Medical University (Ethics Committee of The First Affiliated Hospital: GZMC2009-08-1336).
Selection of SNPs of MUC4
The human MUC4 gene is ~211 kb in size and is located on chromosome 3 in region q29 [30]. To identify SNPs that were related to lung cancer, we first selected 296 of MUC4 SNPs with minor allele frequency (MAF) > 5% from both dbSNP (http://www.ncbi.nlm.nih.gov/SNP, accessed 9/9/2012 and HapMap databases [Han Chinese]) (File S1), and genotyped them in a small subset of samples from 300 randomly selected pairs of case and control subjects from 1048 pairs on an Illumina high-throughput genotyping platform (Genome Analyzer IIx, Illumina Inc., San Diego, CA). Out of this group, we identified nine SNPs (rs863582, rs842226, rs842225, rs2550236, rs2688515, 2641773, rs3096337, rs859769, and rs842461) that exhibited significant frequency differences between cases and controls (data not shown). Genotype frequencies of SNPs can be influenced by sample sizes [31]. To minimize the bias due to small sample size, we next conducted direct sequencing for the whole set of 1,048 pairs of case and control samples using the ABI PRISM 7500 Sequence Detection System (Applied Biosystems, Foster City, CA) to confirm the above genotyping results (Table 1). The results from the two platforms were found to be 100% concordant; therefore, we provided association results from the entire set of 1048 pairs in this paper. Finally, we identified two tagSNPs (rs863582 and rs842461) according to the following criteria: a minimal set of haplotypes that ensure an r2 of at least 0.8 to cover all possible haplotypes that had a frequency of at least 5% as evaluated by the tagSNPs program [32]. In addition, as shown in Figure 1, the reconstructed linkage disequilibrium (LD) plot identified two blocks for the above nine SNPs in 1,048 control subjects: block 1 for rs863582, rs842226, rs842225, rs2550236, rs2688515 and rs 2641773; and block 2 for rs3096337, rs859769 and rs842461. Among these SNPs, we found the one in block2 were in high LD with each other (r2
Genotyping assays
The genomic DNA of subject’s blood samples was extracted with a QIAGEN Blood DNA Kit (Venlo, The Netherlands). An allelic discrimination method using allele-specific fluorogenic probes (the 5 nuclease assay with MGB probes and TAMRA probes, as used in the Taqman assay [33] was chosen for genotyping using a ABI PRISM 7500 Sequence Detection System). Primers and probes are described in Table S2 and were designed by Primer Express 3.0 (Applied Biosystems) and synthesized by Shanghai GeneCore Biotechnologies (Shanghai, China). Polymerase chain reaction (PCR) was performed in 10-μl reaction systems. The PCR protocol consisted of an initial melting step at 95°C for 10 min, 40 cycles of 95°C for 15 s, and 60°C for 1 min. A multicomponent algorithm was used to calculate distinct allele signal contributions from fluorescent measurements for each sample with the ABI 7500HT real-time PCR system. The genotypes were automatically determined by Sequence Detection Systems software 2.3 (Applied BioSystems) (Figure S1). In the genotyping assays, 10% samples were randomly selected to perform repeated assays for each SNP, and the results were 100% concordant.
Statistical analyses
Two-sided χ2 tests were used to assess differences in selected demographic variables, smoking status, pack-years of smoking, family history of cancer, frequencies of MUC4 alleles, and genotypes between the cases and controls. Goodness-of-fit to Hardy-Weinberg equilibrium (HWE) in controls was also evaluated with a χ2-test for each SNP. Akaike’s information criteria (AIC) [34] were applied to select the most parsimonious genetic model for each SNP. Odds ratios (ORs) and corresponding 95% confidence intervals (CIs) were measured with an unconditional logistic regression model with adjustments for age, sex, smoking status, alcohol drinking
Figure 1. Graphical representation of the SNP locations and LD structure of nine genotyped SNPs of MUC4 in 1,048 southern Han Chinese controls. The exact SNP positions are listed in Table 1. Two haplotype blocks (colored) were defined by the Haploview program using the approach described by Gabriel et al. [34] with default settings (the 95% CI for a strong LD was minimal for upper 0.98 and low 0.7, and maximal for a strong recombination of 0.9, and a fraction of strong LD in informative comparisons was at least 0.95). The rs number (top, from right to left) corresponds to the SNP name, and the numbers in squares are D' values (|D'|×100). The measure of LD (D') among all possible pairs of SNPs is shown graphically according to red shading, where white represents very low D', and dark red represents very high D'.
doi: 10.1371/journal.pone.0077723.g001 Table 1. Genotyped MUC4 SNPs.
Gene name NCBI Chromosome Inter-marker Location Base MAF Pc Pd P value
Geno-and locus SNP ID Positiona distances in gene change for typing
(bp) region In Databaseb Case Control HWEe rate (%)
MUC4, rs863582 195478694 5058 Intron 21 T>C 0.386 0.3259 0.2899 0.0116 0.0315 0.9022 99.95 3q29 rs842226 195478861 167 Intron 21 C>T 0.082 0.3228 0.2872 0.0129 0.0372 0.8944 98.81 rs842225 195479748 887 Intron 21 A>G 0.438 0.3867 0.3474 0.0091 0.0513 0.6684 97.85 rs2550236 195522321 42573 Intron 1 G>A 0.164 0.3327 0.2974 0.0152 0.1144 0.9966 97.52 rs2688515 195527471 5150 Intron 1 A>G 0.452 0.3672 0.3244 0.0036 0.0223 0.9952 99.33 rs2641773 195528226 755 Intron 1 A>C 0.452 0.3716 0.3298 0.0048 0.0171 0.9857 98.90 rs3096337 195533332 5106 Intron 1 A>G 0.185 0.3087 0.2634 0.0012 0.0081 0.6992 100.0 rs859769 195534413 1081 Intron 1 T>G 0.415 0.3459 0.3004 0.0016 0.0059 0.8740 99.81 rs842461 195535614 1201 Intron 1 A>C 0.170 0.3097 0.2643 0.0012 0.0048 0.8830 99.67 a SNP position in NCBI dbSNP (http://www.ncbi.nlm.nih.gov/SNP, accessed 9/9/2012)
b MAF from both HapMap and dbSNP databases, the MAF in bold is from the HapMap database (Han Chinese) cP value for difference in allele distributions between cases and controls
d Generated by 10,000 permutations
status, and family history of cancer. Stratification analyses were also performed by variables of interest, such as age, sex, smoking status, alcohol drinking status, family history of cancer, and histologic types. The pairwise LD among the SNPs was calculated using Lewontin’s standardized coefficient D', and LD coefficient r2 [35], and haplotype blocks were defined by the method described by Gabriel et al. [36] using publicly available Haploview software (http://www.broad.mit.edu/ personal/jcbarret/haplo/) with default settings (the CI for a strong LD was minimal for upper 0.98 and low 0.7, and maximal for a strong recombination of 0.9, and a fraction of strong LD in informative comparisons was at least 0.95). Each common haplotype (MAF > 0.05) was compared between all cases and controls and in each stratum of cumulative smoking dose to determine whether smoking influenced the risk associated with MUC4 variants by using haplo.stats (available at http://mayoresearch.mayo.edu/mayo/research/schaid_lab/ index.cfm). In addition, a PHASE 2.1 Bayesian algorithm [37] was used to validate the haplotype frequencies estimated by Haplo.stats and infer diplotype frequencies based on the observed genotypes. Diplotype (haplotype dosage, an estimate of the number of haplotype copies) was the most probable haplotype pair for each individual. Unconditional logistic regression analyses were used to estimate ORs and 95% CIs for case-control subjects carrying one to two copies versus zero copies of each common haplotype for the dichotomized diplotypes (Table S3). The issue of multiple tests was controlled by performing 10,000 permutation tests.
To explore potential interactions between the tagSNPs and smoking status, we performed multiple tests to assess result consistency, including analyses of specific categories of cumulative smoking exposure (i.e., pack-years), genotype-smoking joint-effects, and interaction models that considered both discrete (nonsmokers, light smokers [≤20 pack-years] and heavy smokers [>20 pack-years]) and continuous (square root of pack-years) variables for cumulative smoking exposure. Statistical analyses were performed using SAS 9.2 software (Cary, NC, USA).
Results
Study population characteristics
The characteristics of the 1,048 lung cancer patients and 1,048 cancer-free controls are described in Table S4. The lung cancer cases and controls were adequately matched for age and sex (P = 0.7597 and 0.7734, respectively). Cigarette smoking was associated with increased risk of lung cancer among heavy smokers (OR = 1.66 and 95% CI = 1.37-2.03, data not shown). Among the 1,048 lung cancer cases, 790 (75.38%) were defined as non-small-cell lung cancer (384 adenocarcinoma, 368 squamous cell carcinoma, and 37 large-cell carcinoma), 121 (11.55%) were small-large-cell lung cancer, and 138 (13.17%) patients had other carcinomas.
Association between individual SNPs and lung cancer risk
As summarized in Table 1, the genotype frequency distributions of the nine selected SNPs ((rs863582, rs842226,
rs842225, rs2550236, rs2688515, 2641773, rs3096337, rs859769, and rs842461) in control subjects were all consistent with those expect from the HWE model (all P > 0.05). One SNP (rs2688515) in this Chinese population represented an MAF that was 12.76% lower than reported in the dbSNP database (http://www.ncbi.nlm.nih.gov/SNP, accessed 9/9/2012), whereas the other SNPs (rs842226) represented an MAF 20.52% higher than those reported in the HapMap SNP database (Han Chinese), which may reflect either a diverse population difference or frequency bias due to small sample sizes from which the databases were derived. Allele frequencies of all SNPs showed significant differences between the 1048 case and control pairs (P = 0.0116 for rs863582, P = 0.0129 for rs842226, P = 0.0091 for rs842225, P = 0.0152 for rs2550236, P = 0.0036 for rs2688515, P = 0.0048 for rs2641773, P = 0.0012 for rs3096337, P = 0.0016 for rs859769, and P = 0.0012 for rs842461).
Significant associations were observed for all nine SNPs (P = 0.0425 for rs863582, 0.0333 for rs842226, 0.0294 for rs842225, 0.0010 for rs2550236, 0.0149 for rs2688515, 0.0191 for rs 2641773, 0.0058 for rs3096337, 0.0077 for rs859769, and 0.0059 for rs842461 in a additive model) based on the best fit of the AIC. The two tagSNPs (rs863582 and rs842461) remained significant after applying 10,000 permutations (P value from empirical distribution of minimal P values = 0.0315).
Multivariate logistic regression models showed that after adjusting for confounding factors, compared with wild-type carriers in a dominant model, a significantly increased lung cancer risk was associated with the variant genotypes of rs863582 (T>C) (adjusted OR = 1.39 and 95% CI = 1.02-1.56 for CT/CC genotypes) and rs842461 (A>C) (adjusted OR = 1.25 and 95% CI = 1.05-1.49 for CA/CC genotypes) (Table 2).
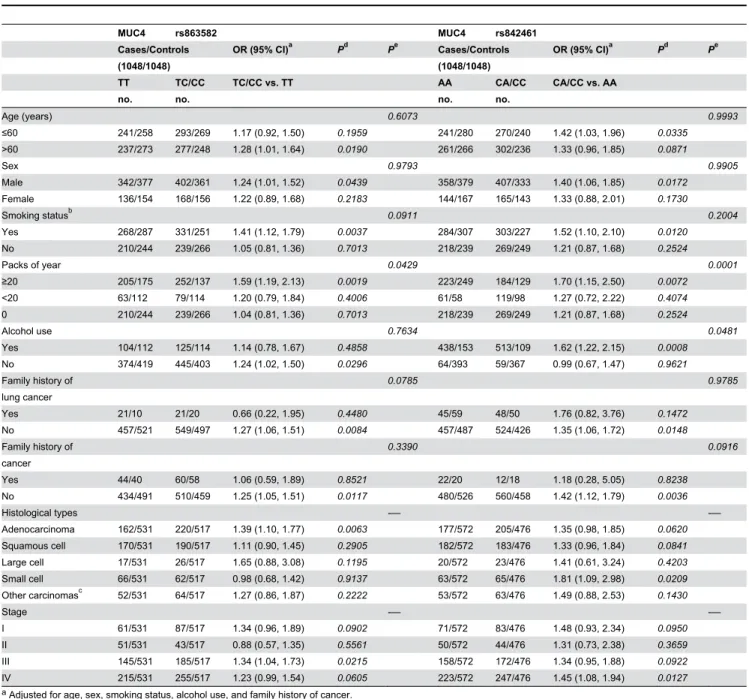
We further assessed the associations of the rs863582 (T>C) and rs842461 (A>C) variant genotypes with lung cancer risk stratified by selected variables and histological types. As shown in Table 3, compared with the common wild-type homozygous genotype, the adverse effect of rs863582 (T>C) was more evident in smokers (adjusted OR = 1.41 and 95% CI = 1.12-1.79), especially heavy smokers (≥ 20 pack-years, adjusted OR = 1.59 and 95% CI = 1.19-2.13) and in those with severe lung cancer (adjusted OR = 1.34 and 95% CI = 1.04-1.73). Consistent with these results of rs863582 (T>C) genotypes and lung cancer risk analysis, rs842461 (A>C) variant genotype analyses also revealed almost identical change tendencies in different subgroups.
Association between haplotypes/diplotypes and lung cancer risk
A global score test showed statistically significant differences in haplotype frequency distribution between the cases and controls for blocks 1 (χ2 = 43.67, df = 22, P value = 0.0039, P simb = 0.0021) and 2 (χ2 = 12.05, df = 4, P value = 0.0169, Psimb = 0.0107) (Table 4).
Table 2. Genotype frequencies of selected MUC4 SNPs among cases and controls and their association with lung cancer risk.
Genetic model Genotype Cases Controls Pa Logistic regression Pc
No. (%) No. (%) OR (95% CI)b
rs863582
Additive TT 478 (45.61) 531 (50.72) 0.0425 1.00 (ref.)
CT 457 (43.61) 425 (40.59) 1.22 (1.01, 1.47) 0.0356
CC 113 (10.78) 91 (8.69) 1.39 (1.02, 1.89) 0.0392
Dominant CT/CC 570 (54.39) 516 (49.28) 0.0194 1.25 (1.05, 1.49) 0.0132
rs842226
Additive CC 476 (46.21) 532 (51.10) 0.0333 1.00 (ref.)
TC 443 (43.01) 420 (40.35) 1.14 (0.54, 2.39) 0.7310
TT 111 (10.78) 89 (8.55) 1.43 (1.04, 1.96) 0.0257
Dominant TC/TT 554 (53.79) 509 (48.9) 0.0260 1.38 (1.03, 1.85) 0.0293
rs842225
Additive AA 380 (37.29) 433 (41.96) 0.0294 1.00 (ref.)
GA 490 (48.09) 481 (46.61) 1.04 (0.77, 1.40) 0.7959
GG 149 (14.62) 118 (11.43) 1.38 (1.03, 1.85) 0.0301
Dominant GA/GG 639 (62.71) 599 (58.04) 0.0308 1.10 (1.01, 1.21) 0.0344
rs2550236
Additive GG 447 (44.26) 511 (49.42) 0.0010 1.00 (ref.)
AG 454 (44.95) 431 (41.68) 1.18 (0.84, 1.67) 0.3373
AA 109 (10.79) 92 (8.90) 1.42 (1.04, 1.94) 0.0298
Dominant AG/AA 563 (55.74) 523 (50.58) 0.0194 1.31 (1.01, 1.69) 0.0395
rs2688515
Additive AA 418 (40.08) 475 (45.72) 0.0149 1.00 (ref.)
GA 484 (46.40) 454 (43.69) 1.13 (0.87, 1.47) 0.3686
GG 141 (13.52) 110 (10.59) 1.45 (1.08, 1.95) 0.0126
Dominant GA/GG 625 (59.92) 564 (54.28) 0.0093 1.26 (0.99, 1.58) 0.0521
rs2641773
Additive AA 410 (39.58) 467 (45.04) 0.0191 1.00 (ref.)
CA 482 (46.52) 456 (43.97) 1.13 (0.86, 1.47) 0.3812
CC 144 (13.90) 114 (10.99) 1.42 (1.06, 1.91) 0.0176
Dominant CA/CC 626 (60.42) 570 (54.96) 0.0119 1.24 (0.99, 1.56) 0.0646
rs3096337
Additive AA 506 (48.28) 574 (54.77) 0.0058 1.00 (ref.)
GA 437 (41.70) 396 (37.79) 1.22 (0.92, 1.61) 0.1664
GG 105 (10.02) 78 (7.44) 1.58 (1.14, 2.18) 0.0058
Dominant GA/GG 542 (51.72) 474 (45.23) 0.0030 1.36 (1.08, 1.71) 0.0096
rs859769
Additive TT 452 (43.25) 516 (49.28) 0.0077 1.00 (ref.)
GT 463 (44.31) 433 (41.36) 1.14 (0.90, 1.46) 0.2769
GG 130 (12.44) 98 (9.36) 1.53 (1.13, 2.06) 0.0057
Dominant GT/GG 593 (56.75) 531 (50.72) 0.0057 1.26 (1.02, 1.57) 0.0323
rs842461
Additive AA 502 (48.13) 572 (54.69) 0.0059 1.00 (ref.)
CA 436 (41.80) 395 (37.76) 1.22 (0.92, 1.62) 0.1610
CC 105 (10.07) 79 (7.55) 1.57 (1.13, 2.16) 0.0065
Dominant CA/CC 541 (51.87) 474 (45.31) 0.0027 1.36 (1.08, 1.71) 0.0099
a Genotype frequencies in cases and controls were compared using two-sided χ2-tests. b Adjusted for age, sex, pack-years of smoking, and family history of cancer. cP value from unconditional logistic regression analyses.
ref.: reference.
harbored the rs3096337 G allele and the rs842461 C allele, and these two alleles were both associated with significantly increased lung cancer risk in the single-locus analysis. Furthermore, the stratified analyses revealed that lung cancer risk was further increased among heavy smokers carrying the haplotype “GGC” (adjusted OR = 1.60 and 95% CI =
1.19-2.15). In block 1, both the haplotype and the diplotype analyses revealed an adverse effect of the haplotype “CTGAGC” of rs863582, rs842226, rs2550236, rs842225, rs2688515, and rs2641773 (especially among heavy smokers [adjusted OR = 1.57 and 95% CI = 1.16-2.13]), and this effect is consistent with the single-locus analysis results (Table S3).
Table 3. Stratified analyses between MUC4 rs863582 and rs842461 genotypes and lung cancer risk.
MUC4 rs863582 MUC4 rs842461
Cases/Controls OR (95% CI)a Pd Pe Cases/Controls OR (95% CI)a Pd Pe
(1048/1048) (1048/1048)
TT TC/CC TC/CC vs. TT AA CA/CC CA/CC vs. AA
no. no. no. no.
Age (years) 0.6073 0.9993
≤60 241/258 293/269 1.17 (0.92, 1.50) 0.1959 241/280 270/240 1.42 (1.03, 1.96) 0.0335
>60 237/273 277/248 1.28 (1.01, 1.64) 0.0190 261/266 302/236 1.33 (0.96, 1.85) 0.0871
Sex 0.9793 0.9905
Male 342/377 402/361 1.24 (1.01, 1.52) 0.0439 358/379 407/333 1.40 (1.06, 1.85) 0.0172
Female 136/154 168/156 1.22 (0.89, 1.68) 0.2183 144/167 165/143 1.33 (0.88, 2.01) 0.1730
Smoking statusb 0.0911 0.2004
Yes 268/287 331/251 1.41 (1.12, 1.79) 0.0037 284/307 303/227 1.52 (1.10, 2.10) 0.0120
No 210/244 239/266 1.05 (0.81, 1.36) 0.7013 218/239 269/249 1.21 (0.87, 1.68) 0.2524
Packs of year 0.0429 0.0001
≥20 205/175 252/137 1.59 (1.19, 2.13) 0.0019 223/249 184/129 1.70 (1.15, 2.50) 0.0072
<20 63/112 79/114 1.20 (0.79, 1.84) 0.4006 61/58 119/98 1.27 (0.72, 2.22) 0.4074
0 210/244 239/266 1.04 (0.81, 1.36) 0.7013 218/239 269/249 1.21 (0.87, 1.68) 0.2524
Alcohol use 0.7634 0.0481
Yes 104/112 125/114 1.14 (0.78, 1.67) 0.4858 438/153 513/109 1.62 (1.22, 2.15) 0.0008
No 374/419 445/403 1.24 (1.02, 1.50) 0.0296 64/393 59/367 0.99 (0.67, 1.47) 0.9621
Family history of 0.0785 0.9785
lung cancer
Yes 21/10 21/20 0.66 (0.22, 1.95) 0.4480 45/59 48/50 1.76 (0.82, 3.76) 0.1472
No 457/521 549/497 1.27 (1.06, 1.51) 0.0084 457/487 524/426 1.35 (1.06, 1.72) 0.0148
Family history of 0.3390 0.0916
cancer
Yes 44/40 60/58 1.06 (0.59, 1.89) 0.8521 22/20 12/18 1.18 (0.28, 5.05) 0.8238
No 434/491 510/459 1.25 (1.05, 1.51) 0.0117 480/526 560/458 1.42 (1.12, 1.79) 0.0036
Histological types -— -—
Adenocarcinoma 162/531 220/517 1.39 (1.10, 1.77) 0.0063 177/572 205/476 1.35 (0.98, 1.85) 0.0620
Squamous cell 170/531 190/517 1.11 (0.90, 1.45) 0.2905 182/572 183/476 1.33 (0.96, 1.84) 0.0841
Large cell 17/531 26/517 1.65 (0.88, 3.08) 0.1195 20/572 23/476 1.41 (0.61, 3.24) 0.4203
Small cell 66/531 62/517 0.98 (0.68, 1.42) 0.9137 63/572 65/476 1.81 (1.09, 2.98) 0.0209
Other carcinomasc 52/531 64/517 1.27 (0.86, 1.87) 0.2222 53/572 63/476 1.49 (0.88, 2.53) 0.1430
Stage -— -—
I 61/531 87/517 1.34 (0.96, 1.89) 0.0902 71/572 83/476 1.48 (0.93, 2.34) 0.0950
II 51/531 43/517 0.88 (0.57, 1.35) 0.5561 50/572 44/476 1.31 (0.73, 2.38) 0.3659
III 145/531 185/517 1.34 (1.04, 1.73) 0.0215 158/572 172/476 1.34 (0.95, 1.88) 0.0922
IV 215/531 255/517 1.23 (0.99, 1.54) 0.0605 223/572 247/476 1.45 (1.08, 1.94) 0.0127
a Adjusted for age, sex, smoking status, alcohol use, and family history of cancer.
b Those who had smoked less than 1 cigarette per day and <1 year in their lifetime were considered nonsmokers; otherwise they were considered smokers (including
individuals who had quit for >1 year). c Mixed-cell or undifferentiated carcinoma.
dP value from unconditional logistic regression analyses.
eP value of a test of the multiplicative interaction between rs863582 (T>C) and rs842461 (A>C) and selected cancer risk variables, calculated using standard unconditional logistic regression models.
Gene-smoking interaction analysis
As summarized in Table 5, we first classified cumulative smoking dose as a discrete variable (nonsmokers, light smokers, and heavy smokers) to avoid the issue of potential participant misclassification for smoking exposure. The adjusted ORs of the rs863582 TC/CC versus TT genotypes increased significantly as pack-years increased in both the cumulative smoking exposure and the genotype-smoking joint-effects analyses, although the comparisons between light and nonsmokers did not reach statistical significance. When we considered nonsmokers with TT or TC/CC as the reference group in the joint-effects model, heavy smokers with the same genotypes had the greatest risk for lung cancer (OR = 1.73 and 95% CI = 1.27-2.36; OR = 2.50 and 95% CI = 1.85-3.39), suggesting that it is a major risk factor for lung cancer. The genotype-smoking interaction model revealed significant multiplicative interaction between the rs863582 polymorphism (TC/CC versus TT) and trichotomized cumulative smoking dose (P < 0.0001). We also observed a consistent and robust result when considering smoking as continuous cumulative smoking dose (square root of pack-years) (P < 0.0001). Similar to the results of rs863582, rs842461 exhibited almost identical change tendencies in genotype and cumulative smoking dose analysis. Notably, the adjusted ORs of the rs842461 CA/CC versus AA genotypes increased significantly as pack-years increased in both the cumulative smoking exposure and genotype-smoking joint-effects analyses, although the comparisons between light and nonsmokers also did not reach statistical significance. When taking nonsmokers with AA or CA/CC as the reference group in the joint-effects model, heavy smokers with the same genotypes had the greatest risk for lung
cancer (OR = 1.82 and 95% CI = 1.35-2.46; OR = 2.43 and 95% CI = 1.78-3.32), suggesting that it is a major risk factor for lung cancer. The genotype-smoking interaction model revealed significant multiplicative interaction between the rs842461 polymorphism (CA/CC versus AA) and trichotomized cumulative smoking dose (P = 0.0001). We also found a consistent and robust result when considering smoking as continuous cumulative smoking dose (square root of pack-years) (P = 0.0024).
Discussion
In the present case-control study, we investigated the effect of multiple common MUC4 gene variants and their interaction with cigarette exposure on lung cancer risk in a Southern Han Chinese population. We found that nine SNPs (rs863582, rs842226, rs842225, rs2550236, rs2688515, 2641773, rs3096337, rs859769, and rs842461) were significantly associated with lung cancer risk. Consistent with the results of single-locus analysis, the haplotype analyses revealed an adverse effect of the haplotype “GGC” of rs3096337, rs859769, and rs842461 on lung cancer. Both the haplotype and diplotype “CTGAGC” of rs863582, rs842226, rs2550236, rs842225, and rs2688515 had adverse effects on lung cancer risk, which is consistent with the single-locus analysis results. Moreover, we observed a statistically significant interaction for rs863582 and rs842461 with cigarette smoking when tested as either a discrete or continuous variable. These findings support our hypothesis that MUC4 polymorphisms and their interaction with smoking may contribute to lung cancer etiology. To the best of our knowledge, this is the first study to assess associations for
Table 4. Association between common MUC4 haplotypes in each block, and lung cancer risk in overall population and subpopulation stratified by pack-years of smoking.
Haplotypea Overall population Non Light Heavy
smokers smokers smokers
Case Control P Psimb OR (95%CI)c Global score test OR (95%CI)d OR (95%CI)d OR (95%CI)d Block 1
TCAGAA 0.5489 0.6095 0.0007 0.0011 1.00 (ref.) χ2 = 43.67 1.00 (ref.) 1.00 (ref.) 1.00 (ref.) CTGAGC 0.2867 0.2618 0.0059 0.0186 1.25 (1.05, 1.50) df = 22 1.15 (0.88, 1.51) 0.92 (0.57, 1.49) 1.57 (1.16, 2.13) TCGGGC 0.0363 0.0370 0.8965 0.8983 1.08 (0.77, 1.52) P = 0.0039 1.08 (0.65, 1.79) 0.87 (0.59, 2.42) 0.87 (0.52, 1.47) TCGGAA 0.0203 0.0176 0.6437 0.6474 1.31 (0.81, 2.11) Psimb = 0.0021 1.33 (0.68, 2.58) 1.20 (0.36, 4.00) 1.50 (0.61, 3.68) TCAAGC 0.0152 0.0105 0.2515 0.2518 1.62 (0.91, 2.87) 1.35 (0.58, 3.10) 0.67 (0.13, 3.58) 3.42 (0.92, 8.71) CTGGAA 0.0131 0.0109 0.5369 0.5267 1.30 (0.73, 2.33) 0.98 (0.40, 2.43) 2.07 (0.60, 7.11) 1.38 (0.50, 3.84)
Block 2 χ2 = 12.05
ATA 0.6516 0.6975 0.0017 0.0019 1.00 (ref.) df =4 1.00 (ref.) 1.00 (ref.) 1.00 (ref.) GGC 0.3082 0.2629 0.0013 0.0015 1.30 (1.09, 1.55) P = 0.0169 1.18 (0.91, 1.52) 1.20 (0.76, 1.89) 1.60 (1.19, 2.15) AGA 0.0363 0.0377 0.8148 0.8679 1.01 (0.73, 1.42) Psimb = 0.0107 1.05 (0.64, 1.73) 1.49 (0.54, 4.16) 0.77 (0.47, 1.26) a Block 1 includes the six common with Minor Haplotype Frequency (MHF) ≥ 0.01 from 27 possible haplotypes; Block 2 includes the three common with MHF ≥ 0.01 from 6 possible haplotypes; Polymorphic bases were in 5'-3' order as listed in Table 1. Loci chosen for block 1, SNP1-6; loci chosen for block2, SNP7-9.
b Generated by 10,000 permutations.
c Adjusted for age, sex, pack-years of smoking, and family history of cancer. d Adjusted for age, sex, and family history of cancer.
ref.: reference
a broad spectrum of genetic variants individually and collectively as haplotypes of the MUC4 gene and lung cancer risk.
It is biologically plausible that MUC4 may be involved in lung cancer etiology. For example, MUC4 is thought to be a very specific (100%) and sensitive (91.4%) marker in paraffin-embedded lung adenocarcinoma tissue, which could be useful in diagnostic practice in the distinction between malignant mesothelioma and adenocarcinoma [38]. Moreover, MUC4 overexpression was found to correlate with poor prognosis in small-sized lung adenocarcinomas [39]. Accumulating evidence suggests that MUC4 might also be a potential diagnostic and prognostic marker for other malignancies, such as ductal carcinoma[40–42].
We first of all found that the two tagSNPs, rs842461and rs863582 were associated with lung cancer risk. In the single-locus association analysis, variant genotypes of these two SNPs exhibited a significantly increased risk of lung cancer individually, even after 10,000 permutations. Moreover, we found “GGC” was accounted for a 60% increase in lung cancer risk among heavy smokers, which was consistent with the effect of variant rs842461 genotypes among the same subgroup, suggesting that the adverse effect of “GGC” was indeed driven by the rs842461 C allele and the rs3096337 G allele. These two SNPs were both located in haplotype block 2, which showed a significant and consistent association with lung cancer risk. Notably, block 2 corresponds to intron 1. Existing
evidence indicates that the sequence in intron 1 of human genes may play an important role in transcriptional regulation. The role of intron 1 of MUC4 in gene regulation and the influence of rs842461 are unknown. Although the functional relevance of rs842461 is not yet clear, it is possible that it may increase transcription activator affinity or decrease that of transcription suppressors to the intronic enhancer, thus upregulating MUC4 expression levels. Further study is warranted to provide experimental evidence in support of this hypothesis.
Our present study also indicates that the effect of rs863582 or rs842461 appears to be strongly modified by cumulative cigarette smoking. Interestingly, the variant genotypes had no effect in nonsmokers or light smokers but were risk factors among heavy smokers compared with their respective wild-type genowild-types. For example, heavy smoking (≥20 pack-years) alone only conferred a 1.58-fold increased lung cancer risk for rs863582, but the effect of heavy smoking with the same genotypes was almost 1.73- or 2.50-fold when TT or TC/CC genotype was used as the respective reference in the joint-effects model, indicating a risk-enhancing relationship between smoking and rs863582 genotype variants. Consistent with these results, the rs842461 variant genotype analyses also revealed almost identical change tendencies. The underlying mechanism involved in the interaction between MUC4 and smoking is not clear. A large number of biologically active molecules, such as cytokines, bacterial products, growth
Table 5. Interaction analyses of the MUC4 rs863582 and rs842461 genotypes and cumulative smoking dose.
Cumulative Genotype Case Control Stratified Joint-effect modelb Genotype-smoking
smoking dose no. no. analysesa interaction model
OR (95%CI)c OR (95%CI)d OR (95%CI)e Pfinteraction Pginteraction
rs863582 < 0.0001 < 0.0001
Nonsmokers TT 221 249 1.00 (ref.) 1.00 (ref.) 0.93 (0.72, 1.19) Nonsmokers TC/CC 246 269 1.09 (0.85, 1.41) 1.08 (0.84, 1.39) 1.00 (ref.) Light smokers TT 58 107 1.00 (ref.) 0.73 (0.49, 1.08) 0.67 (0.46, 1.00) Light smokers TC/CC 63 110 1.07 (0.68, 1.68) 0.80 (0.54, 1.17) 0.74 (0.51, 1.08) Heavy smokers TT 211 175 1.00 (ref.) 1.73 (1.27, 2.36) 1.60 (1.19, 2.17) Heavy smokers TC/CC 261 138 1.58 (1.18, 2.11) 2.70 (1.98, 3.68) 2.50 (1.85, 3.39)
rs842461 0.0001 0.0024
Nonsmokers AA 218 269 1.00 (ref.) 1.00 (ref.) 0.85 (0.66, 1.09) Nonsmokers CA/CC 239 249 1.18 (0.92, 1.53) 1.18 (0.92, 1.52) 1.00 (ref.) Light smokers AA 61 119 1.00 (ref.) 0.74 (0.51, 1.08) 0.63 (0.43, 1.02) Light smokers CA/CC 58 98 1.14 (0.72, 1.78) 0.87 (0.58, 1.28) 0.73 (0.49, 1.09) Heavy smokers AA 223 184 1.00 (ref.) 1.82 (1.35, 2.46) 1.54 (1.14, 2.08) Heavy smokers CA/CC 249 129 1.61 (1.21, 2.15) 2.87 (2.11, 3.92) 2.43 (1.78, 3.32) a Analyses in each stratum of cumulative smoking dose (nonsmokers, light smokers [<20 pack-years] and heavy smokers [≥20 pack-years]). b Joint effects of rs863582 and rs842461 genotypes and cumulative smoking dose.
c The reference group was comprised of TT and AA genotypes with adjustments for age, sex, and family history of cancer.
d Nonsmokers combined with the TT and AA genotypes were the reference group for analysis with adjustments for age, sex, and family history of cancer. e Nonsmokers combined with TC/CC and CA/CC were the reference for analysis with adjustments for age, sex, and family history of cancer.
f The genotype-smoking interaction model incorporated specific categories of pack-years (nonsmokers, light smokers, and heavy smokers) as a discrete variable. g The genotype-smoking interaction model incorporated the square root of pack-years as a continuous variable.
ref.: reference
factors, differentiation agents, and other factors (e.g., tobacco smoke) have been found to regulate MUC4 expression in vitro and/or in vivo in various cell types [43–46]. Therefore, it is likely that smoking might significantly induce MUC4 expression, and it is possible that the variant allele G of rs3096337 or C of rs842461 also leads to a higher basal expression level of MUC4 under normal circumstances. As MUC4 acts as a tumor promoter for lung cancer, the variant allele G of rs3096337 or C of rs842461 exerts a greater adverse effect than that of the wild-type allele among heavy smokers. Therefore, the subjects carrying the rs3096337 variant G or rs842461 variant C may have not have increased lung cancer risk under normal conditions but do have an elevated risk when the G or C allele is in strong LD with a variant allele of another gene (e.g., growth factor genes) that may induce MUC4 expression in response to heavy smoking. Nevertheless, such speculation requires further support from additional functional studies.
There are three main strengths of this study. First, to the best of our knowledge, no study has evaluated MUC4 SNPs for associations with lung cancer. Because lung cancer is a multifactorial disease that likely involves multiple SNPs in genes, we assessed a broader spectrum of MUC4 variants individually as alleles and collectively as haplotypes, which may be more powerful than analyzing a single allele or locus. Second, all lung cancer diagnoses were confirmed by histologic methods, and complete questionnaire data were systematically collected. The adjusted ORs in both stratified and joint-effect analyses for different pack-year categories of smoking were similar in magnitude and direction to the point estimates obtained from fitted ORs of the interaction models. Third, the statistical powers in gene and gene-environment interaction analyses (File S2) in this study were sufficient. These consistent results suggest that our findings are not likely to be due to chance. Ultimately, an investigation of a candidate gene requires many SNPs for individual association analysis [47,48], but such testing will increase the false-positive (type I error) rate under nominal significance thresholds (e.g., a = 0.05) except when the selected SNPs are all in high LD with each other. Namely, when background LD exists between SNPs, but they are assumed to be completely independent, then the popular Bonferroni correction would overcorrect for the inflated false-positive rate, resulting in reduced study power [49]. For calculating the significance of SNPs in LD with each other, a permutation test was used to adjust for multiple tests while preserving the correlation structure among linked markers [50–53]. In this way, the false-positive rate for a large number of tests was well controlled in the present study. Despite the strengths and biologic plausibility of the associations observed in the present study, inherent biases may have resulted in spurious findings. Firstly, the lung cancer cases were enrolled from hospitals, and the controls were selected from community health stations and a health examination center, so inherent selection bias cannot be completely excluded. However, we minimized potential confounding factors by matching the controls to the cases on age, sex, and residential area (urban or rural). Secondly, the sample size of the present study may not be large enough either to detect a small effect from very low penetrance SNPs
or to identify significant associations of the effect in different strata in subgroup analysis adequately. Thirdly, except for smoking status, other factors such as occupational exposure and nutritional status, which might interact with MUC4 genotypes or act as potential confounding factors, were not included in our study. Possible interactions between MUC4 genotypes and these risk factors should be thoroughly investigated in future work. Ultimately, the functional relevance of rs863582 and rs842461 are unknown and should be assessed.
In conclusion, our study provides evidence that MUC4 polymorphisms and their interactions with smoking status may contribute to lung cancer etiology in a Chinese population. Moreover, we also demonstrated that genetic susceptibility, coupled with a modifiable lifestyle factor (i.e., smoking status), and appeared to confer a significantly higher risk of lung cancer than either factor alone. These findings need to be substantiated by larger-scale studies in different ethnic populations.
Supporting Information
Figure S1. MUC4 rs863582 T>C, rs842226 C>T, rs842225 A>G, rs2550236 G>A, rs2688515 A>G, rs2641773 A>C, rs3096337 A>G, rs859769 T>G, and rs842461 A>C; genotyping by Taqman assays.
(TIF)
Table S1. Linkage disequilibrium (D´ and r2) between SNPs in MUC4 in control subjects.
(DOC)
Table S2. The primers and probes for Taqman-PCR on 9
genotyped SNPs of MUC4 gene.
(DOC)
Table S3. Main effects of common diplotypes on lung cancer risk.
(DOC)
Table S4. Frequency distributions of selected variables in lung cancer and cancer-free control subjects.
(DOC)
File S1. Chromosome position of 296 selected SNPs of MUC4 gene, their MAF values and function from dbSNP
(accessed 9/9/2012) and/or Hapmap_CHB_Rel28
databases.
(XLSX)
File S2. Table A: Statistical powers in gene analysis; Table B: Statistical powers in gene and environment interaction analysis.
Author Contributions
Conceived and designed the experiments: WL Z. Zhang JW YZ NZ. Performed the experiments: Z. Zhang CZ JY. Analyzed the
data: WL Z. Zhang JW. Contributed reagents/materials/ analysis tools: JH Z. Zheng XZ. Wrote the manuscript: WL Z. Zhang.
References
1. Jemal A, Bray F, Center MM, Ferlay J, Ward E et al. (2011) Global cancer statistics. CA Cancer J Clin 61: 69-90. doi:10.3322/caac.20107. PubMed: 21296855.
2. Zhang H, Cai B (2003) The impact of tobacco on lung health in China. Respirology 8: 17-21. doi:10.1046/j.1440-1843.2003.00433.x. PubMed: 12856737.
3. Chen WQ (2009) [Estimation of cancer incidence and mortality in China in 2004-2005]. Zhonghua Zhong Liu Za Zhi 31: 664-668. PubMed: 20021861.
4. Vainio H, Bianchini F (2001) Evaluation of cancer-preventive agents and strategies a new program at the International Agency for Research on Cancer. Ann N Y Acad Sci 952: 177-180. PubMed: 11795439. 5. Tsou JA, Hagen JA, Carpenter CL, Laird-Offringa IA (2002) DNA
methylation analysis: a powerful new tool for lung cancer diagnosis. Oncogene 21: 5450-5461. doi:10.1038/sj.onc.1205605. PubMed: 12154407.
6. Nadel JA (2001) Role of epidermal growth factor receptor activation in regulating mucin synthesis. Respir Res 2: 85-89. doi:10.1186/rr43. PubMed: 11686870.
7. Adler KB, Fischer BM, Wright DT, Cohn LA, Becker S (1994) Interactions between respiratory epithelial cells and cytokines: relationships to lung inflammation. Ann N Y Acad Sci 725: 128-145. PubMed: 8030984.
8. Takeyama K, Jung B, Shim JJ, Burgel PR, Dao-Pick T et al. (2001) Activation of epidermal growth factor receptors is responsible for mucin synthesis induced by cigarette smoke. Am J Physiol Lung Cell Mol Physiol 280: L165-L172. PubMed: 11133506.
9. Jones DG, Dittmer MM, Reading LC (1973) Proceedings: Synaptic junction development in guinea-pig cerebral cortex. J Anat 116: 470. 10. Balkwill F, Mantovani A (2001) Inflammation and cancer: back to
Virchow? Lancet 357: 539-545. doi:10.1016/S0140-6736(00)04046-0. PubMed: 11229684.
11. Fitzpatrick FA (2001) Inflammation, carcinogenesis and cancer. Int Immunopharmacol 1: 1651-1667. doi:10.1016/S1567-5769(01)00102-3. PubMed: 11562058.
12. Godschalk R, Nair J, van Schooten FJ, Risch A, Drings P et al. (2002) Comparison of multiple DNA adduct types in tumor adjacent human lung tissue: effect of cigarette smoking. Carcinogenesis 23: 2081-2086. doi:10.1093/carcin/23.12.2081. PubMed: 12507931.
13. Ames BN, Gold LS, Willett WC (1995) The causes and prevention of cancer. Proc Natl Acad Sci U S A 92: 5258-5265. doi:10.1073/pnas. 92.12.5258. PubMed: 7777494.
14. Sasco AJ, Merrill RM, Dari I, Benhaïm-Luzon V, Carriot F et al. (2002) A case-control study of lung cancer in Casablanca, Morocco. Cancer Causes Control 13: 609-616. doi:10.1023/A:1019504210176. PubMed: 12296508.
15. Cohen BH, Diamond EL, Graves CG, Kreiss P, Levy DA et al. (1977) A common familial component in lung cancer and chronic obstructive pulmonary disease. Lancet 2: 523-526. PubMed: 95731.
16. Marin MG (1994) Update: pharmacology of airway secretion. Pharmacol Rev 46: 35-65. PubMed: 8190749.
17. Fischer BM, Rochelle LG, Voynow JA, Akley NJ, Adler KB (1999) Tumor necrosis factor-alpha stimulates mucin secretion and cyclic GMP production by guinea pig tracheal epithelial cells in vitro. Am J Respir Cell Mol Biol 20: 413-422. doi:10.1165/ajrcmb.20.3.3393. PubMed: 10030839.
18. Longphre M, Li D, Gallup M, Drori E, Ordoñez CL et al. (1999) Allergen-induced IL-9 directly stimulates mucin transcription in respiratory epithelial cells. J Clin Invest 104: 1375-1382. doi:10.1172/ JCI6097. PubMed: 10562299.
19. Dabbagh K, Takeyama K, Lee HM, Ueki IF, Lausier JA et al. (1999) IL-4 induces mucin gene expression and goblet cell metaplasia in vitro and in vivo. J Immunol 162: 6233-6237. PubMed: 10229869.
20. Li JD, Dohrman AF, Gallup M, Miyata S, Gum JR et al. (1997) Transcriptional activation of mucin by Pseudomonas aeruginosa lipopolysaccharide in the pathogenesis of cystic fibrosis lung disease. Proc Natl Acad Sci U S A 94: 967-972. doi:10.1073/pnas.94.3.967. PubMed: 9023366.
21. Balagué C, Gambús G, Carrato C, Porchet N, Aubert JP et al. (1994) Altered expression of MUC2, MUC4, and MUC5 mucin genes in
pancreas tissues and cancer cell lines. Gastroenterology 106: 1054-1061. PubMed: 8143972.
22. Ogata S, Uehara H, Chen A, Itzkowitz SH (1992) Mucin gene expression in colonic tissues and cell lines. Cancer Res 52: 5971-5978. PubMed: 1394223.
23. Leikauf GD, Borchers MT, Prows DR, Simpson LG (2002) Mucin apoprotein expression in COPD. Chest 121: 166S-182S. doi:10.1378/ chest.121.5_suppl.166S. PubMed: 12010847.
24. Lamblin G, Degroote S, Perini JM, Delmotte P, Scharfman A et al. (2001) Human airway mucin glycosylation: a combinatory of carbohydrate determinants which vary in cystic fibrosis. Glycoconj J 18: 661-684. doi:10.1023/A:1020867221861. PubMed: 12386453. 25. Buisine MP, Devisme L, Copin MC, Durand-Réville M, Gosselin B et al.
(1999) Developmental mucin gene expression in the human respiratory tract. Am J Respir Cell Mol Biol 20: 209-218. doi:10.1165/ajrcmb. 20.2.3259. PubMed: 9922211.
26. Davies DE, Polosa R, Puddicombe SM, Richter A, Holgate ST (1999) The epidermal growth factor receptor and its ligand family: their potential role in repair and remodelling in asthma. Allergy 54: 771-783. PubMed: 10485380.
27. Jepson S, Komatsu M, Haq B, Arango ME, Huang D et al. (2002) Muc4/sialomucin complex, the intramembrane ErbB2 ligand, induces specific phosphorylation of ErbB2 and enhances expression of p27(kip), but does not activate mitogen-activated kinase or protein kinaseB/Akt pathways. Oncogene 21: 7524-7532. doi:10.1038/sj.onc. 1205970. PubMed: 12386815.
28. Komatsu M, Jepson S, Arango ME, Carothers Carraway CA, Carraway KL (2001) Muc4/sialomucin complex, an intramembrane modulator of ErbB2/HER2/Neu, potentiates primary tumor growth and suppresses apoptosis in a xenotransplanted tumor. Oncogene 20: 461-470. doi: 10.1038/sj.onc.1204106. PubMed: 11313977.
29. Yu D, Hung MC (2000) Overexpression of ErbB2 in cancer and ErbB2-targeting strategies. Oncogene 19: 6115-6121. doi:10.1038/sj.onc. 1203972. PubMed: 11156524.
30. Gross MS, Guyonnet-Duperat V, Porchet N, Bernheim A, Aubert JP et al. (1992) Mucin 4 (MUC4) gene: regional assignment (3q29) and RFLP analysis. Ann Genet 35: 21-26. PubMed: 1351710.
31. Jankovic M, Spinetta JJ, Martins AG, Pession A, Sullivan M et al. (2004) Non-conventional therapies in childhood cancer: guidelines for distinguishing non-harmful from harmful therapies: a report of the SIOP Working Committee on Psychosocial Issues in Pediatric Oncology. Pediatr Blood Cancer 42: 106-108. doi:10.1002/pbc.10418. PubMed: 14752802.
32. Stram DO, Haiman CA, Hirschhorn JN, Altshuler D, Kolonel LN et al. (2003) Choosing haplotype-tagging SNPS based on unphased genotype data using a preliminary sample of unrelated subjects with an example from the Multiethnic Cohort Study. Hum Hered 55: 27-36. doi: 10.1159/000071807. PubMed: 12890923.
33. Livak KJ (1999) Allelic discrimination using fluorogenic probes and the 5' nuclease assay. Genet Anal 14: 143-149. doi:10.1016/ S1050-3862(98)00019-9. PubMed: 10084106.
34. Akaike H (1974) A new look at the statistical model identification. IEEE Trans Automat C ontr AC 19: 716-723.
35. Lewontin RC (1988) On measures of gametic disequilibrium. Genetics 120: 849-852. PubMed: 3224810.
36. Gabriel SB, Schaffner SF, Nguyen H, Moore JM, Roy J et al. (2002) The structure of haplotype blocks in the human genome. Science 296: 2225-2229. doi:10.1126/science.1069424. PubMed: 12029063. 37. Stephens M, Donnelly P (2003) A comparison of bayesian methods for
haplotype reconstruction from population genotype data. Am J Hum Genet 73: 1162-1169. doi:10.1086/379378. PubMed: 14574645. 38. Llinares K, Escande F, Aubert S, Buisine MP, de Bolos C et al. (2004)
Diagnostic value of MUC4 immunostaining in distinguishing epithelial mesothelioma and lung adenocarcinoma. Mod Pathol 17: 150-157. doi: 10.1038/modpathol.3800027. PubMed: 14657954.
40. Singh AP, Chaturvedi P, Batra SK (2007) Emerging roles of MUC4 in cancer: a novel target for diagnosis and therapy. Cancer Res 67: 433-436. doi:10.1158/0008-5472.CAN-06-3114. PubMed: 17234748. 41. Saitou M, Goto M, Horinouchi M, Tamada S, Nagata K et al. (2005)
MUC4 expression is a novel prognostic factor in patients with invasive ductal carcinoma of the pancreas. J Clin Pathol 58: 845-852. doi: 10.1136/jcp.2004.023572. PubMed: 16049287.
42. Tamada S, Shibahara H, Higashi M, Goto M, Batra SK et al. (2006) MUC4 is a novel prognostic factor of extrahepatic bile duct carcinoma. Clin Cancer Res 12: 4257-4264. doi:10.1158/1078-0432.CCR-05-2814. PubMed: 16857800.
43. Perrais M, Pigny P, Ducourouble MP, Petitprez D, Porchet N et al. (2001) Characterization of human mucin gene MUC4 promoter: importance of growth factors and proinflammatory cytokines for its regulation in pancreatic cancer cells. J Biol Chem 276: 30923-30933. doi:10.1074/jbc.M104204200. PubMed: 11418607.
44. Choudhury A, Moniaux N, Ulrich AB, Schmied BM, Standop J et al. (2004) MUC4 mucin expression in human pancreatic tumours is affected by organ environment: the possible role of TGFbeta2. Br J Cancer 90: 657-664. doi:10.1038/sj.bjc.6601604. PubMed: 14760381. 45. Andrianifahanana M, Agrawal A, Singh AP, Moniaux N, van Seuningen
I et al. (2005) Synergistic induction of the MUC4 mucin gene by interferon-gamma and retinoic acid in human pancreatic tumour cells involves a reprogramming of signalling pathways. Oncogene 24: 6143-6154. doi:10.1038/sj.onc.1208756. PubMed: 16007204. 46. Mariette C, Perrais M, Leteurtre E, Jonckheere N, Hémon B et al.
(2004) Transcriptional regulation of human mucin MUC4 by bile acids
in oesophageal cancer cells is promoter-dependent and involves activation of the phosphatidylinositol 3-kinase signalling pathway. Biochem J 377: 701-708. doi:10.1042/BJ20031132. PubMed: 14583090.
47. Ohashi J, Tokunaga K (2001) The power of genome-wide association studies of complex disease genes: statistical limitations of indirect approaches using SNP markers. J Hum Genet 46: 478-482. doi: 10.1007/s100380170048. PubMed: 11501946.
48. Pritchard JK, Cox NJ (2002) The allelic architecture of human disease genes: common disease-common variant...or not? Hum Mol Genet 11: 2417-2423. doi:10.1093/hmg/11.20.2417. PubMed: 12351577. 49. Nyholt DR (2004) A simple correction for multiple testing for
single-nucleotide polymorphisms in linkage disequilibrium with each other. Am J Hum Genet 74: 765-769. doi:10.1086/383251. PubMed: 14997420. 50. Churchill GA, Doerge RW (1994) Empirical threshold values for
quantitative trait mapping. Genetics 138: 963-971. PubMed: 7851788. 51. Dudbridge F, Gusnanto A, Koeleman BP (2006) Detecting multiple
associations in genome-wide studies. Hum Genomics 2: 310-317. doi: 10.1186/1479-7364-2-5-310. PubMed: 16595075.
52. Dudbridge F, Koeleman BP (2004) Efficient computation of significance levels for multiple associations in large studies of correlated data, including genomewide association studies. Am J Hum Genet 75: 424-435. doi:10.1086/423738. PubMed: 15266393.