NHESSD
3, 6997–7051, 2015Calibration and evaluation of the
Canadian FFWI System for the UK
M. C. De Jong et al.
Title Page
Abstract Introduction
Conclusions References
Tables Figures
◭ ◮
◭ ◮
Back Close
Full Screen / Esc
Printer-friendly Version Interactive Discussion
Discussion
P
a
per
|
Discussion
P
a
per
|
Discussion
P
a
per
|
Discussion
P
a
per
|
Nat. Hazards Earth Syst. Sci. Discuss., 3, 6997–7051, 2015 www.nat-hazards-earth-syst-sci-discuss.net/3/6997/2015/ doi:10.5194/nhessd-3-6997-2015
© Author(s) 2015. CC Attribution 3.0 License.
This discussion paper is/has been under review for the journal Natural Hazards and Earth System Sciences (NHESS). Please refer to the corresponding final paper in NHESS if available.
Calibration and evaluation of the
Canadian Forest Fire Weather Index (FWI)
System for improved wildland fire danger
rating in the UK
M. C. De Jong1, M. J. Wooster1,2, K. Kitchen3, C. Manley4, and R. Gazzard5
1
King’s College London, Department of Geography, London, UK 2
National Centre for Earth Observation (NCEO), Reading, UK 3
Met Office, Exeter, UK 4
Forestry Commission England, 620 Bristol Business Park, Coldharbour Lane, Frenchay, Bristol, BS16 1EJ, UK
5
Forestry Commission England, Bucks Horn Oak, Farnham, Surrey, GU10 4LS, UK
Received: 28 April 2015 – Accepted: 29 September 2015 – Published: 23 November 2015 Correspondence to: M. C. De Jong (mark.dejong@kcl.ac.uk)
NHESSD
3, 6997–7051, 2015Calibration and evaluation of the
Canadian FFWI System for the UK
M. C. De Jong et al.
Title Page
Abstract Introduction
Conclusions References
Tables Figures
◭ ◮
◭ ◮
Back Close
Full Screen / Esc
Printer-friendly Version Interactive Discussion
Discussion
P
a
per
|
Discussion
P
a
per
|
Discussion
P
a
per
|
Discussion
P
a
per
|
Abstract
Wildfires in the United Kingdom (UK) can pose a threat to people, infrastructure and the natural environment (e.g. to the carbon in peat soils), and their simultaneous occurrence within and across UK regions can periodically place considerable stress upon the resources of Fire and Rescue Services. “Fire danger” rating systems
5
(FDRS) attempt to anticipate periods of heightened fire risk, primarily for early-warning purposes. The UK FDRS, termed the Met Office Fire Severity Index (MOFSI) is based on the Fire Weather Index (FWI) component of the Canadian Forest FWI System. MOFSI currently provides operational mapping of landscape fire danger across England and Wales using a simple thresholding of the final FWI component
10
of the Canadian System. Here we explore a climatology of the full set of FWI System components across the entire UK (i.e. extending to Scotland and Northern Ireland), calculated from daily 2 km gridded numerical weather prediction data, supplemented by meteorological station observations. We used this to develop a percentile-based calibration of the FWI System optimised for UK conditions. We find the calibration to be
15
well justified, since for example the values of the “raw” uncalibrated FWI components corresponding to a very “extreme” (99th percentile) fire danger situation can vary by up to an order of magnitude across UK regions. Therefore, simple thresholding of the uncalibrated component values (as is currently applied) may be prone to large errors of omission and commission with respect to identifying periods of significantly elevated
20
fire danger compared to “routine” variability. We evaluate our calibrated approach to UK fire danger rating against records of wildfire occurrence, and find that the Fine Fuel Moisture Code (FFMC), Initial Spread Index (ISI) and final FWI component of the FWI system generally have the greatest predictive skill for landscape fires in Great Britain, with performance varying seasonally and by land cover type. At the height of
25
NHESSD
3, 6997–7051, 2015Calibration and evaluation of the
Canadian FFWI System for the UK
M. C. De Jong et al.
Title Page
Abstract Introduction
Conclusions References
Tables Figures
◭ ◮
◭ ◮
Back Close
Full Screen / Esc
Printer-friendly Version Interactive Discussion
Discussion
P
a
per
|
Discussion
P
a
per
|
Discussion
P
a
per
|
Discussion
P
a
per
|
at least one FWI component per event was found to surpass the 95th percentile. Overall, we demonstrate the significant advantages of using a calibrated, percentile-based approach for classifying UK fire danger, and believe our findings provide useful insights for any future redevelopment of the current operational UK FDRS.
1 Introduction
5
Wildfires in the UK may not be as frequent or intense as those found in other regions of the world e.g. North America or Australia, but uncontrolled landscape-scale fires do occur throughout much of the country, particularly in the spring but also during the summer months (Davies and Legg, 2008; Albertson et al., 2009). Anthropogenic (and to a lesser extent, naturally occurring) fires have played a critical role in shaping UK
10
ecosystems – notably in upland heath areas, but also in peatlands and grasslands (Davies et al., 2008). While individual UK wildfires rarely present a very serious risk to human life, they can pose a significant risk to livelihoods, infrastructure and important components of the UK natural environment, particularly in upland moorland areas where carbon stores in peat soils can be put at risk (Davies and Legg, 2008; Davies
15
et al., 2008). In 2010–2012, the Department for Communities and Local Government (2013) reported that a total of 2899 wildfires were recorded by Fire and Rescue Services (FRS) across Great Britain (the UK without Northern Ireland). These fires are almost exclusively anthropogenic, typically resulting from accidental ignitions, and occasionally from arson or escaped “prescribed” burns conducted for the purposes of
20
land management, for example the maintenance and improvement of moorland grouse habitat (Davies et al., 2006; Albertson et al., 2009). The impact of UK wildfires can be greatly exacerbated when periods of low fuel moisture (such as may occur in early spring, or during droughts) coincide with wind speeds conducive to fire spread. During these periods, a large number of sustained ignitions may result in many landscape
25
NHESSD
3, 6997–7051, 2015Calibration and evaluation of the
Canadian FFWI System for the UK
M. C. De Jong et al.
Title Page
Abstract Introduction
Conclusions References
Tables Figures
◭ ◮
◭ ◮
Back Close
Full Screen / Esc
Printer-friendly Version Interactive Discussion
Discussion
P
a
per
|
Discussion
P
a
per
|
Discussion
P
a
per
|
Discussion
P
a
per
|
resources within the UK FRS, both in terms of personnel and also fire fighting response assets (Davies and Legg, 2008). Accordingly, use of a fire danger rating system (FDRS) to help forecast when and where these wildfire episodes are more likely is of growing interest to those who manage or have to respond to landscape-scale fire events. An FDRS system of sufficient reliability, available in a timely operational manner to UK
5
FRS, could enhance short term wildfire response planning and resource allocation (Eastaugh et al., 2012).
The Met Office currently operates an FDRS for England and Wales – the Met Office Fire Severity Index (MOFSI; Met Office, 2015) – that is based upon the well-established Canadian Forest Fire Weather Index (FWI) System (Van Wagner, 1987).
10
In the MOFSI system, numerical weather prediction (NWP) data produced by the Met Office’s operational forecast model is used to produce fire danger forecasts up to 5 days ahead (Met Office, 2015). The MOFSI system is capable of highlighting periods of “exceptional fire danger” across regions of England and Wales (Met Office, 2005), but to date relatively little calibration of the underlying FWI System model and its
sub-15
components has been conducted, so the overall outputs are only relatively crudely tuned to UK environments via a series of broad thresholding operations. As such, we suspect that there remains significant potential for improving the tailored use of the Canadian FWI System in the UK, as has been conducted in a number of other fire-affected environments around the world (e.g. de Groot et al., 2007; Taylor and
20
Alexander, 2006).
An FDRS system built upon UK-specific empirical relationships between meteorological conditions, individual fuel type conditions and fire behaviour would probably permit the most accurate assessment of UK fire danger, as has been developed extensively in Canada (Van Wagner, 1987). Initial attempts to develop such
25
NHESSD
3, 6997–7051, 2015Calibration and evaluation of the
Canadian FFWI System for the UK
M. C. De Jong et al.
Title Page
Abstract Introduction
Conclusions References
Tables Figures
◭ ◮
◭ ◮
Back Close
Full Screen / Esc
Printer-friendly Version Interactive Discussion
Discussion
P
a
per
|
Discussion
P
a
per
|
Discussion
P
a
per
|
Discussion
P
a
per
|
for use in UK conditions, with the aim of enhancing the ability and accuracy of UK fire danger mapping based on Met Office NWP forecasts. We focus on an approach using locally and seasonally calculated percentiles of the individual components of the FWI System to highlight periods of extreme fire danger conditions, a method routinely used in the USA (Andrews et al., 2003) and applied by Dowdy et al. (2009, 2010) in Australia,
5
and Camia and Amatulli (2010) at a European level. The approach has the advantage of accounting for both the historic variability and range of the FWI System components at each location in the targeted area, and thus allows assessment of any current forecast of a particular “fire danger index” with respect to past values representative for that location and time of year. We evaluate our approach using historic fire records
10
from the UK Fire and Rescue Service Incident Recording System (IRS) database, available across Great Britain (Department for Communities and Local Government, 2012, 2013).
2 Background
2.1 Fire Danger Rating Systems
15
The term “fire danger” generally “refers to an assessment of both fixed and variable factors of the fire environment (i.e. fuels, weather and topography) that determine the ease of ignition, rate of spread, difficulty of control, and impact of wildland fires” (Merrill and Alexander, 1987 in Taylor and Alexander, 2006, p. 122). An FDRS is generally designed to systematically evaluate and integrate these factors into
20
qualitative and/or numerical indices of fire potential, primarily in order to guide fire management activities (Stocks et al., 1989; Lee et al., 2002). The most comprehensive FDRS, such as the Canadian Forest Fire Danger Rating System (CCFDRS; Stocks et al., 1989), incorporate multiple factors and datasets into their calculations, though many less sophisticated FDRS are based almost entirely upon meteorological data
25
NHESSD
3, 6997–7051, 2015Calibration and evaluation of the
Canadian FFWI System for the UK
M. C. De Jong et al.
Title Page
Abstract Introduction
Conclusions References
Tables Figures
◭ ◮
◭ ◮
Back Close
Full Screen / Esc
Printer-friendly Version Interactive Discussion
Discussion
P
a
per
|
Discussion
P
a
per
|
Discussion
P
a
per
|
Discussion
P
a
per
|
moisture content of dead fuels – typically the most flammable component of the fire environment (Chuvieco et al., 2009). The MOFSI employed across England and Wales is an example of a meteorologically-based FDRS, since it is based entirely upon the meteorological module of the CCFDRS, the Canadian Forest Fire Weather Index (FWI) System (Van Wagner, 1987).
5
2.2 The Canadian Forest Fire Weather Index System
The FWI System of Van Wagner (1987) is one of the most widely used FDRS worldwide (Taylor and Alexander, 2006; Lawson and Armitage, 2008). The FWI System was originally developed for use in jack/lodgepole pine forest environments – a dominant Canadian forest type particularly prone to fire – using calculations based solely
10
upon meteorological inputs (air temperature, wind speed, relative humidity and 24 h cumulative rainfall, assessed at noon local time) (Van Wagner, 1987). The FWI System consists of six components. The first three are “moisture codes” – the Fine Fuel Moisture Code (FFMC), the DuffMoisture Code (DMC) and the Drought Code (DC), each relating to the moisture content of the three major ground fuels commonly
15
found in a mature pine forest environment; the fine surface litter, loosely compacted organic material (“Duff”), and deeper organic layers/large surface fuels, respectively (Van Wagner, 1987). These moisture codes, developed to relate to the water content of dead vegetation and the “duff” and organic soils that are derived from it, are then used within the FWI System to determine three further “fire behaviour index”
20
components, each providing information related to the potential behaviour of a fire should an ignition occur. The Initial Spread Index (ISI) represents the potential rate of fire spread, the Buildup Index (BUI) indicates the total amount of available combustible fuel, and the final “FWI” component combines the ISI and BUI to provide a measure of the potential frontal intensity of a fire. While originally developed for use in Canadian
25
NHESSD
3, 6997–7051, 2015Calibration and evaluation of the
Canadian FFWI System for the UK
M. C. De Jong et al.
Title Page
Abstract Introduction
Conclusions References
Tables Figures
◭ ◮
◭ ◮
Back Close
Full Screen / Esc
Printer-friendly Version Interactive Discussion
Discussion
P
a
per
|
Discussion
P
a
per
|
Discussion
P
a
per
|
Discussion
P
a
per
|
actual fire behaviour seen in local fuels (e.g. Fogarty et al., 1998; de Groot et al., 2005, 2007; Taylor and Alexander, 2006; Bedia et al., 2012, 2014; Karali et al., 2014; Venäläinen et al., 2014). In tests, the FWI System has generally been found to perform very well compared to other FDRS when utilised in other environments (e.g. Dowdy et al., 2010; Viegas et al., 1999).
5
2.3 FDRS in the UK: the Met Office Fire Severity Index
The UK MOFSI system (Met Office, 2015) makes use of the final FWI component of the FWI System, which is calculated using UK numerical weather prediction (NWP) forecasts and classified into one of five fire danger categories (representing “low” to “exceptional” fire danger). The MOFSI was originally designed as a decision support
10
tool for land management organisations (e.g. Natural England, Natural Resources Wales) who, under the UK Government’s Countryside and Rights of Way (CRoW) (2000) Act, are responsible for restricting access to public land in England and Wales when fire danger reaches “exceptional” levels. The Met Office considered several alternative FDRS as the basis for the MOFSI, with the FWI System selected as it
15
was considered to highlight periods of high fire danger under a range of different weather conditions, could identify periods of both short-term increased fire risk and periods when fire-risk increased gradually over time, and appeared to respond well to changing fire risk levels in different UK vegetation types (Kitchen et al., 2006; Met Office, 2005). In addition to its use under the CRoW (2000) Act in England and
20
NHESSD
3, 6997–7051, 2015Calibration and evaluation of the
Canadian FFWI System for the UK
M. C. De Jong et al.
Title Page
Abstract Introduction
Conclusions References
Tables Figures
◭ ◮
◭ ◮
Back Close
Full Screen / Esc
Printer-friendly Version Interactive Discussion
Discussion
P
a
per
|
Discussion
P
a
per
|
Discussion
P
a
per
|
Discussion
P
a
per
|
2.4 Limitations of the MOFSI for forecasting fire danger in the UK
Since its instigation in 2002, the MOFSI has proven suitable for its primary purpose of triggering the closure of public land under the CRoW (2000) Act during periods of “exceptional” fire danger. However, it is considered that there exists significant scope for improving the details of this system, and for developing its use as a wider decision
5
support tool for land managers, government agencies and emergency services (Legg et al., 2007; Davies and Legg, 2008). We suggest that the current system has several key limitations:
1. The current MOFSI “exceptional” category used to trigger land closures under the CRoW (2000) Act was defined relatively subjectively based upon FWI conditions
10
observed in the years 1976, 1995 and 2003 when UK wildfires were particularly widespread (Met Office, 2005). The lower categories were then defined based upon a geometric progression from this threshold. None of these thresholds have any immediately understandable meaning in relation to fire danger – e.g. they are not calibrated to any specific changes in potential ecological damage or
15
suppression difficulty. As suggested by Fogarty (1998), there is much potential for improved fire danger rating if the FWI system (and associated fire danger categories) was adopted to make use of relationships between the individual FWI components and corresponding fuel moisture/fire behaviour in UK fuels. Such relationships are well understood for boreal forests (Alexander and de
20
Groot, 1988; Taylor and Alexander, 2006), and have been derived for tropical grasslands (de Groot et al., 2005, 2007) and Mediterranean fuels (Viegas et al., 1999, 2001). However, these relationships have proved challenging to establish in common UK fuels such as heather and gorse (Davies et al., 2006, 2009; Anderson and Anderson, 2009), and additional experimental burning campaigns
25
likely necessary for further such developments here are difficult to conduct.
NHESSD
3, 6997–7051, 2015Calibration and evaluation of the
Canadian FFWI System for the UK
M. C. De Jong et al.
Title Page
Abstract Introduction
Conclusions References
Tables Figures
◭ ◮
◭ ◮
Back Close
Full Screen / Esc
Printer-friendly Version Interactive Discussion
Discussion
P
a
per
|
Discussion
P
a
per
|
Discussion
P
a
per
|
Discussion
P
a
per
|
climatic variations seen across the country, both in terms of latitude and in terms of elevation. Whilst the relative importance of live and dead fuel moisture content (FMC) is not yet fully understood in UK fire prone environments e.g. heather
(Calluna vulgaris) moorlands (Davies et al., 2009), it is clear that the FMC of both
live and dead fuels is strongly influenced by meteorology (Chuvieco et al., 2009),
5
and low FMC of either type of fuel is likely to play an important role in a location’s flammability. The physical processes governing the wetting and drying of dead fuels is unlikely to vary with location in the country (Taylor and Alexander, 2006), and as a result raw FWI component values should relate well to the FMC of dead fuels of a particular class (e.g. the fine surface fuels) wherever they are located.
10
However, the relationships between meteorological-based fire danger indices and the FMC of live plants is much more variable, due for example to species-specific water balance mechanisms (Chuvieco et al., 2009). In fact, in past work in the UK, only weak relationships have been found between raw values of the FWI system components and live (and indeed even dead) FMC (Legg et al., 2007;
15
Legg and Davies, 2009). However, Dowdy et al. (2010) did find that extreme (e.g. 98th percentile) values of the FWI system components correspond consistently to periods of extensive fire activity in Australia, and a similar percentile based approach is used in the USA to highlight elevated fire danger and to determine FRS staffing levels (Andrews et al., 2003). Hence a percentile-based approach
20
is due for evaluation in the UK, in order to ascertain whether it can provide an improvement in FDRS skill level beyond the use of a single threshold across the entire UK.
3. The existing fire danger rating in MOFSI is only derived using the final FWI component of the FWI System, even though from a fire management perspective
25
NHESSD
3, 6997–7051, 2015Calibration and evaluation of the
Canadian FFWI System for the UK
M. C. De Jong et al.
Title Page
Abstract Introduction
Conclusions References
Tables Figures
◭ ◮
◭ ◮
Back Close
Full Screen / Esc
Printer-friendly Version Interactive Discussion
Discussion
P
a
per
|
Discussion
P
a
per
|
Discussion
P
a
per
|
Discussion
P
a
per
|
fire danger in non-forest environments may be better reflected by the Fine Fuel Moisture Code (FFMC) and Initial Spread Index (ISI) components of the FWI System alone. The FWI is derived from a combination of all the other components, including the DC and Duff Moisture Code (DMC) that appear rather specific to the type of densely forested environments under which deep organic soils can
5
form. Accordingly, across the UK these components are likely to be of varying relevance – while potentially of minimal use in e.g. grassland environments, they may highlight the extremely dry periods in which peatland areas begin to dry out (Krivtsov et al., 2008), and thus indicate when ecologically damaging peat fires may occur.
10
To tackle limitations (1) to (3) we developed and evaluated a new, percentile-based FDRS for potential use in the UK. The new approach is still percentile-based upon the FWI System, but now makes use of individual forecasts of each of the FWI System components which are interpreted in the context of their historical range at a local level (2 km grid cells) as percentiles. The approach here does not attempt to take explicit
15
account of the complex relationships between specific fuel type, live fuel moisture, and fire behaviour, and therefore is intended for highlighting extreme fire danger purely from a meteorological perspective rather than giving e.g. an indication of potential ecological damage or levels of suppression difficulty. Developing these elements in future would augment the system further, however, we do believe that this
percentile-20
based approach improves upon the existing system by removing the subjectivity of threshold selection found in the MOFSI and making thresholds clearly understandable, whilst also accounting for the regional climate variations seen across the country.
3 Datasets
The new UK FDRS developed herein is based upon, and tested with, two principal
25
NHESSD
3, 6997–7051, 2015Calibration and evaluation of the
Canadian FFWI System for the UK
M. C. De Jong et al.
Title Page
Abstract Introduction
Conclusions References
Tables Figures
◭ ◮
◭ ◮
Back Close
Full Screen / Esc
Printer-friendly Version Interactive Discussion
Discussion
P
a
per
|
Discussion
P
a
per
|
Discussion
P
a
per
|
Discussion
P
a
per
|
the extremes (and thus percentiles) of each component for each 2 km×2 km grid cell
and season across the country. This dataset formed the foundation of the percentile-based FDRS. (2) A record of fire incidence across Great Britain extracted from the UK FRS Incident Recording System (IRS) database (Sect. 3.2) and enhanced by land cover data (Sect. 3.3) was then used to examine percentiles of the FWI components
5
during past wildfire periods.
3.1 FWI climatology data
In order to base identification of the percentile values of the FWI System components on sound statistics, ideally a dataset capturing the long term intra-seasonal variability of each FWI component is required, particularly because UK weather conditions that
10
appear to lead to exceptional wildfire danger, and thus “extreme” values of the FWI components, seem to be relatively infrequent. The revised UK FDRS system developed herein is to be based upon daily 2 km×2 km resolution Met Office NWP forecasts, and
so this long-term “FWI climatology” should ideally also be derived from a historical archive of these same data. Unfortunately, iterative changes and enhancements to
15
the Met Office NWP system meant that a consistent archive at 2 km×2 km spatial
resolution across the entire UK is only obtainable since 2010, and thus we were limited to a four year (2010–2013) record (hereafter termed the “NWP-derived” FWI dataset). To develop a longer term climatology, we accessed a much more temporally extensive (several decades) of station-based meteorological observations taken at 38
20
sites across the UK, and used these to derive the same set of FWI System components (hereafter termed the “met station-derived FWI” dataset).
Since the ultimate aim of the UK FDRS is to derive useful fire danger forecasts from NWP forecasts, the met station-derived FWI dataset was primarily employed in assessing whether the limited four year length of the NWP-derived FWI dataset was
25
NHESSD
3, 6997–7051, 2015Calibration and evaluation of the
Canadian FFWI System for the UK
M. C. De Jong et al.
Title Page
Abstract Introduction
Conclusions References
Tables Figures
◭ ◮
◭ ◮
Back Close
Full Screen / Esc
Printer-friendly Version Interactive Discussion
Discussion
P
a
per
|
Discussion
P
a
per
|
Discussion
P
a
per
|
Discussion
P
a
per
|
3.1.1 NWP-derived FWI data
For the period 1 January 2010–16 December 2013, we calculated a daily “NWP-derived” FWI dataset from the 24 h (midday to midday) Met Office NWP model accumulated rainfall and matching daily noon air temperature, wind speed and relative humidity data for each 2 km×2 km grid cell. Due to problems with the NWP archive, no
5
data were available for the periods 1 January 2013–20 June 2013 and 5 August 2013– 30 September 2013, inclusive, and the resulting dataset consisted of 1217 individual daily forecasts of each of the six FWI System components.
3.1.2 Met station-derived FWI data
The “met station-derived” FWI dataset was calculated from noon air temperature,
10
relative humidity and wind speed values and 24 h cumulative rainfall totals extracted from hourly observation records for 38 UK meteorological stations. The stations used were operational during the 2010–2013 NWP data period, and all have much longer term data availability; the longest running station dataset covers a 44.0-year period from 1 January 1970 until 31 December 2013, with the median and shortest
15
running station datasets extending back from December 2013 for 21.9 and 13.3 years, respectively. Sites are well distributed around the UK, ensuring capture of regional climate variations.
3.2 Historic fire data: the Great Britain Fire and Rescue Service Incident
Recording System dataset
20
Since March 2009, detailed information on all fires reported to Great Britain’s FRS has been stored within a national Incident Recording System (IRS) (Department for Communities and Local Government (DCLG), 2012, 2013). In excess of 210 000 outdoor “vegetation fire” records were logged within this database between March 2009 and May 2013, and all were made available for use in this study by Forestry
NHESSD
3, 6997–7051, 2015Calibration and evaluation of the
Canadian FFWI System for the UK
M. C. De Jong et al.
Title Page
Abstract Introduction
Conclusions References
Tables Figures
◭ ◮
◭ ◮
Back Close
Full Screen / Esc
Printer-friendly Version Interactive Discussion
Discussion
P
a
per
|
Discussion
P
a
per
|
Discussion
P
a
per
|
Discussion
P
a
per
|
Commission England/DCLG. No similar dataset relating to vegetation fire occurrence in Northern Ireland was available, so Great Britain (England, Scotland and Wales) was the focus of the evaluation component of our work. The IRS provides information on a wide range of factors relating to each vegetation fire incident, and of particular relevance here were:
5
– Fire location (Coded as a six-figure British National Grid Reference).
– Time between reporting and extinction of the fire.
– Fire footprint size estimate (hectares).
– Number of fire fighting utilities in attendance.
For the purpose of this study, only the major “wildfires” were of primary interest.
10
Consequently, IRS vegetation fire incidents were considered wildfires only when they met one or more of the following criteria used to define a true “wildfire” event (Scottish Government, 2013):
– Footprint of affected area>1 ha
– A minimum of 6 h to extinguish
15
– Attendance by>3 fire fighting appliances
A total of 2897 vegetation fire events occurring during the 2010–2013 NWP-derived FWI dataset period met one or more of these “wildfire” criteria, and were retained for further analysis. Data from 2013 were omitted due to the lack of NWP-derived FWI data for the first half of this year.
20
3.3 Landcover data
NHESSD
3, 6997–7051, 2015Calibration and evaluation of the
Canadian FFWI System for the UK
M. C. De Jong et al.
Title Page
Abstract Introduction
Conclusions References
Tables Figures
◭ ◮
◭ ◮
Back Close
Full Screen / Esc
Printer-friendly Version Interactive Discussion
Discussion
P
a
per
|
Discussion
P
a
per
|
Discussion
P
a
per
|
Discussion
P
a
per
|
made in terms of data quality for the sake of recording speed. As such, caution is required when using these data in scientific studies. Analysis of fire record data pre-instigation of the IRS system (MacKinnon, 2008; McMorrow et al., 2011) found that Fire and Rescue Services frequently recorded the parked locations of the FRS appliances as the incident location (potentially up to 3 km apart). The IRS system is
5
believed to have improved location accuracy (McMorrow et al., 2011), however there is likely to be uncertainty associated with the correct identification of landcover type in the database. Therefore, instead of using the land cover classifications recorded in the IRS dataset, we determined the land cover type for each fire incident using a combination of three spatial land cover datasets. The UK Land Cover Map 2007
10
(LCM2007; Morton et al., 2011) was used to classify most (83 %) incidents, however for the 12 % of incidents occurring in areas mapped in the more spatially detailed Forestry Commission England National Forest Inventory (NFI; Forestry Commission England, 2012) this was used instead. For some incidents where the two datasets overlapped spatially, there was disagreement between the NFI and LCM2007 classification (e.g. an
15
area classified as woodland by the NFI but as arable by the LCM2007). In these cases (5 %), the highly detailed Ordnance Survey MasterMap® Topography Layer dataset (Ordnance Survey, 2014), digitised from aerial photography, was used to determine the classification. The resulting land cover classifications were then aggregated into one of seven broad categories; broadleaved woodland, coniferous woodland, arable,
20
grassland, heath/bog/marsh, urban and other.
4 Methodology
4.1 Development and initial testing of a percentile-based FDRS
For each 2 km×2 km grid square in the NWP-derived FWI dataset, we determined
the seasonal values of the 10th to 90th percentile of each FWI component (in 10 %
25
NHESSD
3, 6997–7051, 2015Calibration and evaluation of the
Canadian FFWI System for the UK
M. C. De Jong et al.
Title Page
Abstract Introduction
Conclusions References
Tables Figures
◭ ◮
◭ ◮
Back Close
Full Screen / Esc
Printer-friendly Version Interactive Discussion
Discussion
P
a
per
|
Discussion
P
a
per
|
Discussion
P
a
per
|
Discussion
P
a
per
|
reference datasets were also calculated for the 1st, 5th, 95th, 97th and 99th percentiles, to capture the extremes of each FWI component’s range at each grid cell location in greater detail. These reference datasets form the foundation of the percentile-based FDRS; any NWP-derived forecast of a FWI component for a particular grid cell and season could now be converted to a percentile value by linearly interpolating between
5
the reference dataset values. As an indicator of fire danger frequency, FWI component conditions would be expected to have exceeded the 99th percentile for only 3–4 days in any given season during the 3–4 year period of the NWP data. Since weather conditions corresponding to episodes of elevated fire danger typically persist for several days at a time (Met Office, 2005), the 99th percentile is broadly comparable to a “one in
10
several year extreme” that the original MOFSI “exceptional” fire danger category was intended to represent (Met Office, 2005; Davies and Legg, 2008), though now with the equivalent FWI values being tailored to each UK grid cell rather than having a single value for the entire country.
4.2 Evaluating the suitability of the NWP-derived FWI dataset as the basis for
15
an FDRS
To assess whether the newly constructed NWP-derived FWI dataset (and thus the percentile reference datasets derived from it) are a suitable basis for a new FDRS, we needed to address whether these ∼4 years of FWI System data are representative
of the longer term met station-derived FWI climatology. This was done by a statistical
20
comparison of the NWP-derived FWI dataset and the much longer-term met station-derived FWI dataset.
In fact, agreement between the NWP- and met station-derived FWI data at matched locations was found to be relatively poor on a day-to-day basis (not shown here). As has been discussed elsewhere (Legg et al., 2007; Dowdy et al., 2010), this is likely a result
25
of differences in the spatial scales of the two datasets (individual meteorological station locations vs 2 km×2 km grid cells), which can be particularly important for rainfall due
NHESSD
3, 6997–7051, 2015Calibration and evaluation of the
Canadian FFWI System for the UK
M. C. De Jong et al.
Title Page
Abstract Introduction
Conclusions References
Tables Figures
◭ ◮
◭ ◮
Back Close
Full Screen / Esc
Printer-friendly Version Interactive Discussion
Discussion
P
a
per
|
Discussion
P
a
per
|
Discussion
P
a
per
|
Discussion
P
a
per
|
(e.g. Hoadley et al., 2004; Finkele et al., 2006; Field et al., 2014). However, on close inspection, a comparison of the 99th percentiles of the met station-derived and NWP-derived FWI datasets suggests that their upper extremes are similar. To demonstrate this, 99th percentiles were calculated seasonally for each meteorological station in the met station-derived FWI dataset for the January 2010–December 2013 period
5
(termed the “post-2010” met station-derived FWI dataset 99th percentiles), matching the temporal extent of the NWP-derived FWI dataset. For each FWI component, these percentile values were then compared to those from the 99th percentile reference dataset (extracted from the 2 km grid cells containing the meteorological stations) using OLS linear regression.
10
Furthermore, to investigate whether the variation in FWI components between 2010 and 2013 is reasonably representative of a longer term FWI climatology, the 99th percentiles were calculated seasonally for each meteorological station in the met station-derived FWI dataset for the period prior to January 2010 (termed the “pre-2010” met station-derived FWI dataset 99th percentiles). OLS linear regression models were
15
then calculated for the pre-2010 and post-2010 met station-derived 99th percentile data for each FWI component to compare the two periods.
4.3 Exploring the percentile based FDRS using historic fire records
After developing our percentile-based FDRS using the NWP-derived dataset (Sect. 3.1), we examined the behaviour of the FWI System components in relation to
20
the historic fire records from the IRS database (Sect. 3.3). These data were explored in detail for a number of particularly “extreme” wildfire incidents (Sect. 4.3.1), and then more broadly in relation to all IRS fire events using the rank percentile curve approach of Eastaugh et al. (2012) to identify the FWI System components that best highlight fire danger in the UK (Sect 4.3.2). Additionally, the distributions of raw FFMC data during
25
NHESSD
3, 6997–7051, 2015Calibration and evaluation of the
Canadian FFWI System for the UK
M. C. De Jong et al.
Title Page
Abstract Introduction
Conclusions References
Tables Figures
◭ ◮
◭ ◮
Back Close
Full Screen / Esc
Printer-friendly Version Interactive Discussion
Discussion
P
a
per
|
Discussion
P
a
per
|
Discussion
P
a
per
|
Discussion
P
a
per
|
4.3.1 Analysis of FWI System components during several “extreme” historic
wildfire events
We investigated the temporal evolution and peak values of the FWI components during the ten largest incidents in the IRS dataset. These events were selected based upon the criteria that they had the largest number of fire fighting appliances in attendance,
5
one of several key indicators identified by the Scottish Government (2013). Additionally, to illustrate the potential impact of our new spatial varying percentile-based FDRS, and to highlight the differences between it and the MOFSI system, we then classified the midnight 12 h NWP-derived forecast of the FWI component for 2 May 2011 using both the MOFSI and percentile-based FDRS approaches. This date was selected as it
10
coincides with one of the most extreme UK wildfire periods experienced during 2010– 2013, when 61 wildfires were identified as simultaneously burning across Great Britain from the IRS dataset. For both approaches, the proportion of UK grid cells where these fires were burning and the total UK area assigned to each MOFSI category/above a specific percentile were calculated.
15
4.3.2 Comparing performance of the FWI System components across all IRS
wildfire events
Since each of the FWI components can be considered a fire danger index in its own right (Camia and Amatulli, 2009), and in certain environments some components are believed to be better predictors of extreme fire danger than others (Van Wagner, 1988),
20
it is useful to compare the performance of each component relative to one another. As noted by Verbesselt et al. (2006a), evaluating the performance of fire danger rating systems is challenging since the concept of fire “danger” is rather ill-defined. Nevertheless, whilst fires can occur under many different “fire weather” situations, it should be the case that ignitions are more likely to be sustained and wildfires more
25
NHESSD
3, 6997–7051, 2015Calibration and evaluation of the
Canadian FFWI System for the UK
M. C. De Jong et al.
Title Page
Abstract Introduction
Conclusions References
Tables Figures
◭ ◮
◭ ◮
Back Close
Full Screen / Esc
Printer-friendly Version Interactive Discussion
Discussion
P
a
per
|
Discussion
P
a
per
|
Discussion
P
a
per
|
Discussion
P
a
per
|
comparisons to records of historical fire occurrence and fire behaviour (e.g. Viegas et al., 1999; Andrews et al., 2003; Verbesselt et al., 2006b; Dowdy et al., 2010; Arpaci et al., 2013; Eastaugh and Hasenauer, 2014). A percentile based evaluation method is appealing for such a comparison, since these data were readily available to us and are uninfluenced by the differences in frequency distributions and scales of the
5
raw components. Comparing differences in percentiles on fire/non-fire days between indices, as used by previously by Andrews et al. (2003), can form a simple yet effective evaluation method, but the choice of percentiles for evaluation can influence which index is considered to have greatest skill (Eastaugh et al., 2012). Therefore, we elected to use the “ranked percentile curve” approach devised in the review of fire danger index
10
comparators conducted by Eastaugh et al. (2012). This method has subsequently also been applied by Arpaci et al. (2013) and Eastaugh and Hasenauer (2014).
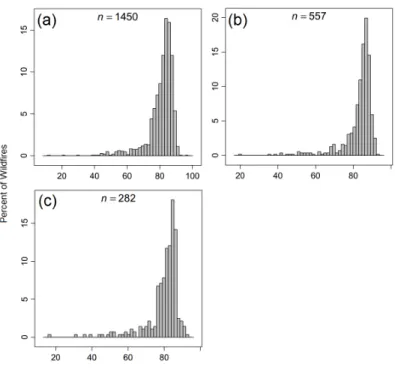
A brief description of the “rank percentile curve” approach of Eastaugh et al. (2012) is provided here. For daily time resolution fire danger indices, all index values are first converted to percentiles, and the percentiles on days on which fires occurred (“fire
15
days”) are extracted and plotted by ascending rank to create a “ranked percentile curve”. A nonparametric regression model is then fit to this curve using the Theil–Sen method (Theil, 1950a, b, c; Sen, 1968), selected because it is more resistant to outliers than are other regression techniques (due to the fact that the slope and intercept are determined using a median based approach; Helsel and Hirsch, 2002; Granato, 2006).
20
This resistance to outliers is well suited to the evaluation of fire danger indices, since the causes of wildfires extend well beyond the meteorological factors that are the only factor accounted for by the indices (e.g. variations in human activities – caused for example by weekendvs.weekday activities – might tend to lead to many more ignitions on particular days or times of year for example). For illustrative purposes, Fig. 1
25
NHESSD
3, 6997–7051, 2015Calibration and evaluation of the
Canadian FFWI System for the UK
M. C. De Jong et al.
Title Page
Abstract Introduction
Conclusions References
Tables Figures
◭ ◮
◭ ◮
Back Close
Full Screen / Esc
Printer-friendly Version Interactive Discussion
Discussion
P
a
per
|
Discussion
P
a
per
|
Discussion
P
a
per
|
Discussion
P
a
per
|
observed percentile value divided by the total number of fire days and intercept=0; and an index with some predictive skill, where slope and intercept values fall between the “perfect” and “no skill” indices. Accordingly, intercept and slope values from the Theil–Sen model fits to the fire danger index data can be used to assess index skill, and allow comparison between different indices.
5
The relationships between fire behaviour, fuel moisture and meteorology change across different environments and by time of year (e.g. Davies and Legg, 2008, 2011; Pardilla and Vega-Garcia, 2011), thus, the performance of the FWI components in forecasting UK fire danger is likely to vary seasonally and between land cover types. Accordingly, in our study we performed two seasonal rank percentile curve analyses of
10
the FWI components during wildfire incidents – the first at a national level for spring, summer and autumn, and the second disaggregated by land cover type for spring and summer – too few fire events occurred in autumn to perform an adequate analysis at land cover level, and the winter NWP-derived FWI data were considered to be unsatisfactory for further analysis (see Sect. 5.2 for more details). A study by Legg
15
et al. (2007) investigated the predictive power of the raw FWI components in Scotland by examining data on fire days and non-fire days in grass, heath, bush/gorse and forest woodland environments. They concluded that the FFMC, ISI and FWI have broadly equivalent discriminatory power for fire occurrence, while the DC is of little value. Our study builds upon this approach as we make use of data for the whole of Great Britain,
20
and we believe that a climatologically based percentile approach may be more powerful than using raw FWI component data.
Most UK wildfires recorded in the IRS dataset do not extend beyond one day in duration. For each of these 1 day events the daily value of each FWI component coinciding with the event was extracted from the corresponding NWP-derived dataset
25
NHESSD
3, 6997–7051, 2015Calibration and evaluation of the
Canadian FFWI System for the UK
M. C. De Jong et al.
Title Page
Abstract Introduction
Conclusions References
Tables Figures
◭ ◮
◭ ◮
Back Close
Full Screen / Esc
Printer-friendly Version Interactive Discussion
Discussion
P
a
per
|
Discussion
P
a
per
|
Discussion
P
a
per
|
Discussion
P
a
per
|
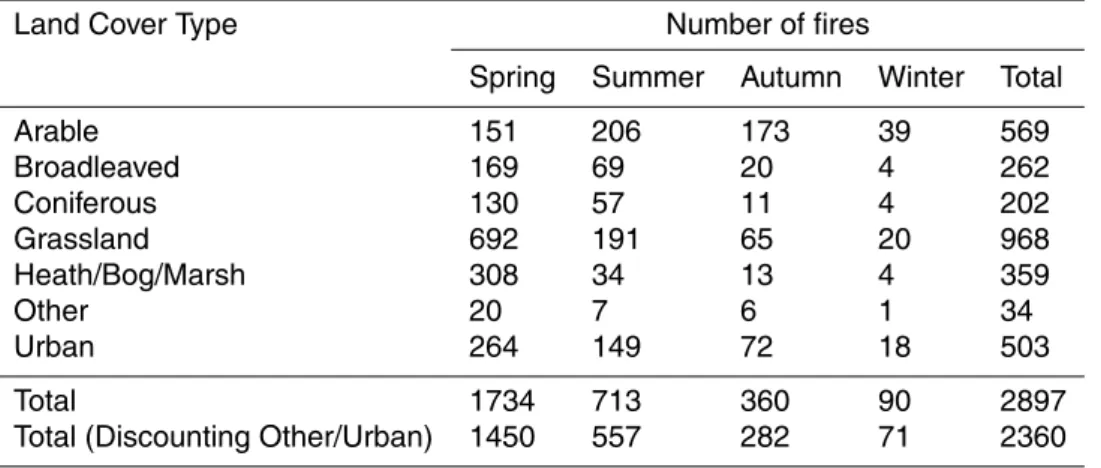
percentile reference datasets. Rank percentile curves and Theil–Sen models were then constructed for each FWI component, both at a national level and split by broad UK land cover type. For both the national and land cover disaggregated level analyses only wildfires identified as occurring in “arable”, “broadleaved”, “coniferous”, “grassland”, or “heath/bog/marsh” environments were considered since these accounted for the
5
majority (81 %) of recorded British wildfires (see Table 1), and fires in classes such as “urban” will actually be occurring in an unknown land use sub-class (e.g. grassland, parkland etc).
5 Results and discussion
5.1 Characteristics of historic UK fires: analysis of the IRS database
10
The spatial and seasonal distribution of wildfire activity in Great Britain (2010–2012) and the spatial distribution of the aggregated UK land cover types is shown in Fig. 2. A breakdown of wildfire activity by both land cover class and season is also provided in Table 1. From Fig. 2b it is apparent that wildfires occur in all areas of the UK, although the number of wildfires per 2 km×2 km Met Office grid cell was highest in South Wales,
15
South East England and the southern Pennines region of northern England. From Fig. 2c wildfire occurrence can also be seen to be highly seasonal, with the majority (60 %) of events occurring in spring (March, April and May) or summer (25 %; June, July and August). Considerably fewer wildfires occurred in autumn (12 %; September, October and November) and winter (3 %; December, January and February). Wildfires
20
in “grassland” account for the largest proportion of all land cover types (Table 1), both on an annual basis (33 %) and during spring (40 %). “Heather/bog/marsh” wildfires are also considerable (18 %) in spring, and are probably a consequence of the prescribed heather burning occurring during this season (Albertson et al., 2009). The majority of summer wildfires occur in “arable” (29 %) or “grassland” (27 %) land cover types, with
25
NHESSD
3, 6997–7051, 2015Calibration and evaluation of the
Canadian FFWI System for the UK
M. C. De Jong et al.
Title Page
Abstract Introduction
Conclusions References
Tables Figures
◭ ◮
◭ ◮
Back Close
Full Screen / Esc
Printer-friendly Version Interactive Discussion
Discussion
P
a
per
|
Discussion
P
a
per
|
Discussion
P
a
per
|
Discussion
P
a
per
|
5.2 Evaluation of the suitability of the NWP-derived FWI dataset as the basis
for an FDRS
Figure 3 presents the seasonal relationships between the 99th percentile values of the FWI components derived from (a) meteorological station data and NWP data from grid cells geographically intersected by these stations (for the 2010–2013 period), and
5
(b) meteorological station data for pre- and post-2010 periods for the same stations, with OLS linear regression fits and coefficients of determination (r2). The geographical locations of the meteorological stations used for this analysis are shown in Fig. 2b.
As observed in Fig. 3a, a strong association between post-2010 met station-derived and NWP-derived FWI percentiles exists for all FWI System components during UK
10
spring and summer (r2 min: 0.55, median: 0.82, max: 0.93). With the exception of ISI (r2=0.33), strong relationships are also found during autumn (medianr2=0.70). Relatively low bias is observed in the spring, summer and autumn seasons, with slope values for all FWI components lying between 0.73 and 1.30. As the extreme percentiles of the NWP-derived and the met station-derived FWI data are generally
15
in good agreement, the NWP-derived FWI data was considered a suitable basis for a FDRS in spring, summer and autumn. Poorer association is observed between winter percentiles (r2 min: 0.19, median: 0.35, max: 0.78), and considerable positive biases are evident in the DC intercept value (166.26) and DMC, BUI and FWI slope values (2.67, 2.93 and 2.58, respectively). However, as the summer/spring period is generally
20
of most concern for wildfires in the UK (see Fig. 2 and Table 1) this is not considered to be a significant issue.
Figure 3b shows that while many of the relationships between the pre- vs. post-2010 met station-derived FWI dataset 99th percentiles are relatively strong (r2>0.5); they are generally weaker than those between the NWP-derived and post-2010 met
25
NHESSD
3, 6997–7051, 2015Calibration and evaluation of the
Canadian FFWI System for the UK
M. C. De Jong et al.
Title Page
Abstract Introduction
Conclusions References
Tables Figures
◭ ◮
◭ ◮
Back Close
Full Screen / Esc
Printer-friendly Version Interactive Discussion
Discussion
P
a
per
|
Discussion
P
a
per
|
Discussion
P
a
per
|
Discussion
P
a
per
|
(Fig. 2c), the poor DC agreement (r2=0.4) is strongly influenced by data from a single meteorological station located in Marham, Norfolk. Outside of this station, the spring and summer 99th percentiles from the 2010–2013 period agree reasonably well with the 99th percentiles observed in the longer term for the other FWI components (median
r2for all FWI components in spring and summer=0.64).
5
Our findings above suggest that the NWP-derived FWI dataset captures reasonably well the long term variability of the FWI components seen in the UK during spring and summer (and for most FWI components, during autumn as well), and thus forms a suitable foundation for a percentile-based FDRS. Given the weak relationships observed both between met station-derived and NWP-derived data and pre- and
post-10
2010 data in the winter months, we believe that this approach is not suitable for assessing winter fire danger in its current form, and so the remaining work carried out in this paper focus on the months of spring, summer and autumn. In any case, as Fig. 2c shows, winter wildfires are much rarer in the UK than fires at other times of year. It is also worth noting that an operational system developed using our approach
15
would likely become more robust over time as the years included in the FWI climatology expanded, which could improve some of the weaker relationships highlighted above.
5.3 Spatial variation in percentiles and its implications for an FDRS
For all FWI components and seasons, a large degree of spatial variability exists in the percentile reference datasets. Figure 4 illustrates the spatial variation of the 99th
20
percentile of the FWI for each season across the UK. In summer, the 99th percentile varies by over an order of magnitude; from 1.6 in North West Scotland to 56 in South East England, clearly demonstrating the benefits of using a “percentile based” FWI threshold that is allowed to vary spatially across the country, rather than the current MOFSI system where the fire danger class for the entire UK is set using a spatially
25
NHESSD
3, 6997–7051, 2015Calibration and evaluation of the
Canadian FFWI System for the UK
M. C. De Jong et al.
Title Page
Abstract Introduction
Conclusions References
Tables Figures
◭ ◮
◭ ◮
Back Close
Full Screen / Esc
Printer-friendly Version Interactive Discussion
Discussion
P
a
per
|
Discussion
P
a
per
|
Discussion
P
a
per
|
Discussion
P
a
per
|
intended to highlight. However, whilst “exceptional” summer fire danger as defined by the MOFSI is signified by an FWI value exceeding 52.4, the 99th percentile of the FWI only actually reaches this value in a small region of South East England. Thus this small area is likely to be the only one in which the “exceptional” category of the MOFSI system correctly reflects a “one in several year extreme” of fire weather.
5
As can also be seen from Fig. 4, much lower FWI thresholds are required to represent “one in several year” (99th percentile) extreme conditions in parts of northern/western England, Wales, Scotland and Northern Ireland. Thus adopting locally calculated percentiles as thresholds for fire danger bandings avoids the geographical bias inherent in the existing MOFSI system, and would much more
10
realistically reflect “one in several year extreme” fire weather conditions for the entire UK.
5.4 Analysis of FWI System components during several “extreme” historic
wildfire events
Figure 5 shows the temporal evolution of the forecast FWI components for the widely
15
reported spring 2011 Swinley forest fire that burned 300 ha of woodland in Berkshire, South East England. While not the largest British wildfire event on record in terms of burnt area, the Swinley forest fire is of particular note due to the fact that an enormous number (202) of fire fighting appliances were in attendance (Department for Communities and Local Government, 2013), the location was the rural-urban interface
20
of a densely populated area, and crown fire activity occurred (which is itself a rare event in the UK; Kitchen, 2012). While the incident as reported by the IRS spans the period of 27 April–9 May, the fire only became highly significant in terms of fire suppression efforts between 2 and 6 May (Kitchen, 2012). At this time, multiple independent fire fronts developed; crowning occurred in a 5 m high pine thicket; and the fire spread
25
NHESSD
3, 6997–7051, 2015Calibration and evaluation of the
Canadian FFWI System for the UK
M. C. De Jong et al.
Title Page
Abstract Introduction
Conclusions References
Tables Figures
◭ ◮
◭ ◮
Back Close
Full Screen / Esc
Printer-friendly Version Interactive Discussion
Discussion
P
a
per
|
Discussion
P
a
per
|
Discussion
P
a
per
|
Discussion
P
a
per
|
in magnitude above the 95th–99th percentile during the event. Given that a forecast would be available from the Met Office NWP system at least three days prior to the actual date on which peak fire activity occurred, this appears to confirm that the FWI forecasts converted into percentile thresholds do contain significant information that could be useful as a short term operational planning and decision making tool for UK
5
FRS. Similar behaviour of the FWI components is observed at the other major UK wildfire events examined – Table 2 summarises the maximum percentile exceeded by each component during each event. In all ten of these fire events, at least one of the FWI components exceeds its 95th percentile value.
5.5 Comparison of the percentile-based FDRS to the current MOFSI system
10
during a historic period of widespread “exceptional” UK wildfire activity
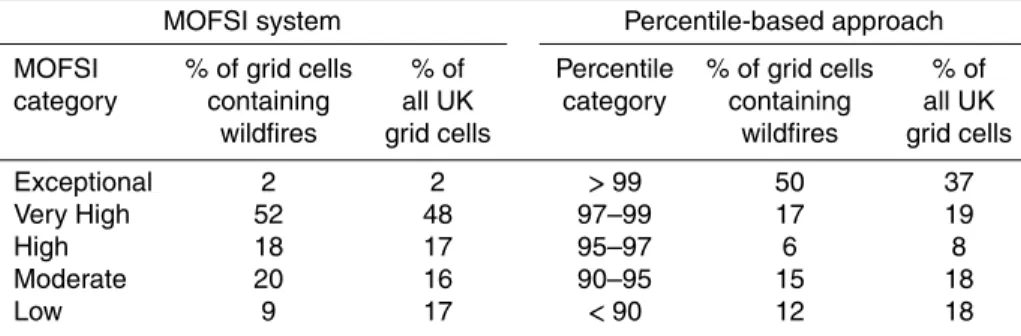
UK Fire danger on 2 May 2011 as classified using (a) the MOFSI and (b) the percentile-based approaches is mapped in Fig. 6, with active fires marked as hollow circles. The proportion of the UK grid cells where wildfires were burning and the total UK area assigned to each MOFSI category and above a specific percentile are summarised
15
in Table 3. Other than the “exceptional” MOFSI category and the 99th percentile, the MOFSI categories are not directly relatable to specific percentiles, as they are based upon a geometric progression down from the exceptional threshold rather than being based upon specific “1 in X year” events. This makes an intercomparison relatively subjective, but as anticipated, large spatially dependent differences are seen
20
between fire danger mapped using the MOFSI and percentile-based classification systems (Fig. 6). In this example, the highest fire danger is forecast in southern areas of the UK using the MOFSI approach (Fig. 6a), despite wildfire activity actually occurring nationwide. The percentile based approach appears to much better indicate the extreme nature of the fire weather conditions that existed across much of the
25
country at this time (Fig. 6b).
Using the percentile-based FDRS proposed here, the modal FWI category is the
NHESSD
3, 6997–7051, 2015Calibration and evaluation of the
Canadian FFWI System for the UK
M. C. De Jong et al.
Title Page
Abstract Introduction
Conclusions References
Tables Figures
◭ ◮
◭ ◮
Back Close
Full Screen / Esc
Printer-friendly Version Interactive Discussion
Discussion
P
a
per
|
Discussion
P
a
per
|
Discussion
P
a
per
|
Discussion
P
a
per
|
occurred (50 % of grid cells) and all UK grid cells (37 % of grid cells) (Table 3), as would be expected from a correctly operating forecasting system at a time when pan-UK fire danger is extremely high. In contrast, under the MOFSI system very few (2 %) wildfires actually occurred in areas designated as being in the “exceptional” fire danger class and the vast majority (98 %) occurred in other areas.
5
5.6 Comparing performance of the FWI System components across all IRS
wildfire events
5.6.1 Evaluation of the FWI System components at national level
Seasonal rank percentile curves and Theil–Sen models for each FWI component at national (all land cover types) level, constructed using the maximum value of each
10
FWI component during each wildfire event, are presented in Fig. 7. From Fig. 7a and c, it can be seen that FFMC and ISI are the best performing indices with respect to wildfire occurrence in spring and autumn, respectively. The FFMC, ISI and FWI components exhibit generally similar forecasting skill during these seasons, considerably outperforming the DMC, BUI and DC. The FWI shows the greatest skill
15
in summer (Fig. 7b), with an intercept similar to that observed in spring. While FFMC and ISI skill is relatively worse in summer than in spring, DMC, DC, and BUI all perform somewhat better.
Our results highlight the fact that during spring, the moisture content of slow drying fuels (reflected in the DMC, DC and BUI) is generally high, preventing combustion
20
even if an ignition were present. However, fires are frequent in spring due to the so called “spring dip” – where the moisture content of live vegetation is generally lower than in summer due to limited leaf canopy development (Davies and Legg, 2008; Alexander and Cruz, 2012) – and thus fires are more likely to take hold if an ignition is sustained. As a result, spring wildfires are dependent on whether fine fuels are dry
25
NHESSD
3, 6997–7051, 2015Calibration and evaluation of the
Canadian FFWI System for the UK
M. C. De Jong et al.
Title Page
Abstract Introduction
Conclusions References
Tables Figures
◭ ◮
◭ ◮
Back Close
Full Screen / Esc
Printer-friendly Version Interactive Discussion
Discussion
P
a
per
|
Discussion
P
a
per
|
Discussion
P
a
per
|
Discussion
P
a
per
|
occur during either prolonged dry periods or drought (Met Office, 2005), when the fuel moisture of slow drying dead fuels of larger diameter, and even live fuels, can become lowered. In these cases the slower reacting FWI components (i.e. DMC, DC and BUI) have a chance to peak, and thus their performance improves slightly in the summer months. Furthermore, despite the decrease in performance of the FFMC/ISI relative to
5
the spring, the improvements seen in the DMC, BUI and DC in the summer ultimately lead to the final component of the system, the FWI, exhibiting the best performance during the summer period.
Figure 7 shows that during all seasons, the DC performs poorly for predicting wildfire occurrence, particularly in spring, when it has almost zero skill. This is likely due
10
to its time-lag of 52 days (time to lose ∼2/3 of free moisture above equilibrium)
(Van Wagner, 1987), which significantly limits its sensitivity to the type of short term (maximum ∼5 day) weather system changes common in the UK. As an indicator of
long term drought conditions (Camia and Amatulli, 2010), the DC is probably best used to indicate when a particularly severe fire season is imminent, rather than to forecast
15
the timing or location of individual wildfire events. If the DC is elevated while other conditions are favourable for fire establishment (e.g. high wind speeds, high ignition potential of fine fuels), fires intensity and suppression difficulty is likely to be high.
5.6.2 Evaluation of the FWI System components by landcover type
Seasonal rank percentile curves and Theil–Sen models for each FWI component at
20
land cover type level, constructed using the maximum value of each FWI component during each wildfire event, are presented in Figs. 8 and 9, respectively, and highlight that performance of the FWI components varies considerably by vegetation type and season.
During spring (Fig. 8), the best performing index in broadleaved, grassland and
25
NHESSD
3, 6997–7051, 2015Calibration and evaluation of the
Canadian FFWI System for the UK
M. C. De Jong et al.
Title Page
Abstract Introduction
Conclusions References
Tables Figures
◭ ◮
◭ ◮
Back Close
Full Screen / Esc
Printer-friendly Version Interactive Discussion
Discussion
P
a
per
|
Discussion
P
a
per
|
Discussion
P
a
per
|
Discussion
P
a
per
|
substantially better than the other components overall in grassland and arable areas, most likely a result of quick drying fine fuels dominating these land cover types during this season. A similar effect is observed in heath/bog/marsh environments; while deeper slow drying peat layers may burn during very dry conditions, most spring fires occur in the potentially dry canopies of heather stands (Davies and Legg, 2011). In
5
coniferous – and to a lesser extent, broadleaved – environments, performance of the DMC and BUI components increases. DMC and BUI perform similarly to the ISI in coniferous environments, and outperform FFMC. With the exception of the FFMC, all FWI components perform best in coniferous environments, and the FWI component (the final “summary” index of the FWI System) demonstrates the greatest overall skill.
10
The improved skill shown here relative to other environments, particularly in coniferous woodlands, likely reflects the increased availability of slow drying fuels (duff, dead and live woody material) in these environments.
During summer (Fig. 9) the FWI component exhibits the greatest predictive skill, in this case across all land cover types. The skill of the indices related to
slow-15
drying fuels (DMC, DC, BUI) increases or shows little change relative to the skill in spring for each corresponding land cover type, with the improvements in coniferous, grassland and heath/marsh/bog land covers the most significant. This is consistent with how fire behaviour changes from spring to summer in the UK (as highlighted in Sect. 5.6.1). These components likely reflect the increasing importance of slower
20
drying live and dead woody fuels to the overall fuel load in these environments (Arpaci et al., 2013). In heath/bog/marsh areas this may reflect the drying processes that litter, moss and peat layers can undergo in summer, as has been suggested by Davies et al. (2006) and Krivtsov et al. (2008). Conversely, with the exception of coniferous and heath/marsh/bog environments, summer FFMC and ISI performance decreases
25
NHESSD
3, 6997–7051, 2015Calibration and evaluation of the
Canadian FFWI System for the UK
M. C. De Jong et al.
Title Page
Abstract Introduction
Conclusions References
Tables Figures
◭ ◮
◭ ◮
Back Close
Full Screen / Esc
Printer-friendly Version Interactive Discussion
Discussion
P
a
per
|
Discussion
P
a
per
|
Discussion
P
a
per
|
Discussion
P
a
per
|
compared to coniferous environments during spring. The indices generally display the poorest performance in arable land in both spring and summer; perhaps a result of farming practices and societal factors (e.g. ignitions in baled crops) being of significant importance for fires in these environments. The overall poor DC performance found across all seasons in Sect. 5.6.1 is also observed when indices are evaluated by
5
vegetation type.
It is interesting to note that for each of the individual “extreme” wildfire events discussed in Sect. 5.4 and summarised in Table 2, while at least one of the FWI components exceeds its 95th percentile value during each of the ten fire events examined, it is not always the component identified in this ranked percentile curve
10
analysis as having greatest forecasting skill for that particular season and land cover type. For example, during both the Upton (Dorset) and Swinefleet (East Yorkshire) major summer wildfires, the ISI exceeds the highest percentile, despite the FWI performing better in general in heath/bog/marsh environments such as these in the summer months (Fig. 9). Similarly during the Lightwater (Surrey) spring wildfire, the
15
highest percentile exceeded is in the FFMC, despite the FWI, DMC, ISI and BUI all performing better overall in coniferous forests in spring (Fig. 8). This highlights the importance of considering the behaviour of all FWI components when attempting to interpret forecasts of fire danger, rather than just relying upon the component that appears to performs best overall for a given season and land cover.
20
5.6.3 Raw FWI component values during historic wildfires: the FFMC as an
on/offswitch for fire danger?
While advocating the adoption of our percentile-based approach to fire danger forecasting in the UK, we also examined the “raw” component (i.e. non-percentile) values of the NWP-derived FWI component forecasts in grid cells where wildfire events
25