44
Copyright © 2014 by Academic Publishing House
Researcher
Published in the Russian Federation
European Journal of Medicine. Series B
Has been issued since 2014.ISSN: 2409-6296
Vol. 1, No. 1, pp. 44-51, 2014
DOI: 10.13187/ejm.s.b.2014.1.44
www.ejournal27.com
UDC 61
Type 2 Diabetes Mellitus, Depression and Neuropsychological Profiles Among Adults in Ghana
1 Jacob Owusu Sarfo* 2 C. Charles Mate-Kole
1All Nations University College, Ghana
Department of Nursing, School of Humanities and Social Sciences Lecturer
*E-mail: sarfojo@yahoo.com 2University of Ghana, Ghana
Department of Psychology, School of Social Sciences, College of Humanities Professor
Abstract
The aim of this study was to measure, in relation to depressive symptoms, the neuropsychological changes among individuals living with Type 2 diabetes mellitus (DM2) in Ghana. One hundred (100) participants comprising 50 patients with DM2 and 50 healthy controls matched on age and education were recruited. The raw scores were standardised into composite variables of executive function, learning/memory, visuoconstructional skills, visuospatial function and overall cognitive function. For all the neuropsychological domains, the diabetic group obtained significantly lower scores than the healthy control group. Depression was noted to have a negative relationship with all the neuropsychological domains. In addition, there was no significant difference between the depressed (diabetic and healthy control) subgroups on visuoconstructional skills. Likewise, there was no significant difference between the non-depressed (diabetic and healthy control) subgroups on visuospatial performance. These findings underscore the importance of early clinical neuropsychological assessment and further studies on DM2 neuropsychology.
Keywords: Depression; Executive Function; Type 2 Diabetes Mellitus; Learning; Memory;
Visuoconstructional Function; Visuospatial Function; Neuropsychological Assessment; Adults.
Introduction
Diabetes mellitus (DM) is a metabolic disorder indicted by a chronic state of hyperglycaemia, accompanied by a disorder of food nutrients‘ metabolism as a result of associated problems in insulin secretion, insulin action, or both [1]. The major DM classifications are Type 1 diabetes mellitus (DM1) [formerly called Insulin-Dependent Diabetes Mellitus], Type 2 diabetes mellitus (DM2) [formerly called Non-Insulin Dependent Diabetes Mellitus], and Gestational Diabetes Mellitus (which occurs as a result of pregnancy). The use of numbers (1 and 2) rather than Roman numerals (I and II) is to prevent any confusion when differentiating between the types [1].
45
be fatal or might lead to perpetual losses [2]. To support this claim, brain imaging studies have shown photographic portions of cellular deaths, among patients with DM [3-4]. In addition, DM2 studies have shown some declines and imbalances in neurotransmitters like acetylcholine, glutamate and Gama Acetyl Butyric Acid, which occur due to poor glucose supply [5].
After cognitive deficits were first noted in DM1 to predispose affected individuals to some cognitive deficits [6], recent studies have reported on some distinctive neuropsychological changes among individuals diagnosed with either DM1 or DM2. Generally, the neurological consequences of blood glucose levels on cerebral functioning among patients with DM have constantly presented some dysfunctions in areas of attention, processing speed, memory, and executive function [7].
Among individuals with DM2, profound neuropsychological deficits may be worsened by a combination of old age and other comorbidities [8]. Notable among these comorbidities were cardiovascular disorders [9]-[10] musculoskeletal conditions [11] and dementia [12].
In addition to these conditions, depression, which is a more common affective symptom in DM2 cases, may aggravate the degree of cognitive decline [13]-[15]. For example, among Hispanics, the majority of the clinically depressed group were noted to be individuals diagnosed with DM compared to the control group. In addition, symptoms of depression among individuals diagnosed with DM have been attributed to poorly managed blood glucose and dietary habits [16].
In examining the relationship between DM, depression and cognitive impairments among the older population in Hong Kong with DM receiving care between 1998 and 2001, it was discovered that those with DM were 1.3 times more likely to have neurocognitive dysfunctions and 1.3 times more likely to have depressive disorders, compared to older non-diabetics (when age, sex and educational level were controlled) [17]. In a similar trend, depressed individuals diagnosed with DM showed neuropsychological declines when compared with the control group [15]. In addition, while some studies had been done with respect to the relationship between depression and poor cognitive function in DM subjects little has been done using sub-Saharan samples.
Although most studies have attributed poor neuropsychological deficits to poor glycaemic controls [18]-[20], significant impairments have been found even among DM patients with good glycaemic control [21]. Hassing and colleagues [22] found no initial DM-related neuropsychological deficits, although they reported a longitudinal episodic memory decline. Notwithstanding these conflicting findings on DM neuropsychological deficits and the role of depression, this study sought to extend the number of cognitive domains that are usually reported in related studies.
The aim of this present was to examine the effect that depressive symptoms have on the neuropsychological changes that occur among individuals living with DM2 in Ghana.
Method Participants
A purposive sample of hundred (100) adults, consisting of 50 patients with Type 2 diabetes and 50 healthy controls were only matched on age and education. The mean years of DM diagnosis was approximately 5 years. The mean Fasting glucose (mg/dL) of the depressed diabetic subgroup was approximately 124 while in the non-depressed diabetic subgroup it was 93. The exclusion criteria for participants included any history of cognitive contra-indications. These encompassed dementia, central nervous system disease, unstable medical illness, DSM-IV-TR Axes I and II disorders, drug or alcohol dependence and head trauma.
Measures
The Mini Mental State Examination (MMSE) was used to screen for pre-existing cognitive dysfunction and particular areas of cognitive dysfunction [23]. Executive function was measured using Part A and B of the Trail Making Test [24] and Modified Card Sorting Test [25]. These tests were used to measure processing speed, sequence alternation, cognitive flexibility, visual search, motor performance and complex attention [26]. The California Verbal Learning Test-Second Edition (CVLT-II) [27] was used to assess the use of spontaneous semantic associations, and verbal memory recall [26]. Digit Span Subtest (Digit Forward and Digit Backward) [28] was used to measure both auditory attention and span of immediate verbal memory recall [26].
46
information processing speed and coordination [30]. The Judgment of Line Orientation test (JLO) [31] was used to measure visuospatial abilities of individuals. The эrief Symptom Inventory‘s Depression subscale [32] was used to measure participants‘ depressive symptomй
Procedure
Institutional Review Boards approvals were obtained from both the Noguchi Memorial Research Institute (NMRI) and National Diabetes Research Center (NDRC). Subsequently, written consents were obtained from all participants before data collection was done. After a thorough initial screening using the MMSE [23], all selected participants were given a battery of neuropsychological tests which lasted for an average of two hours. Breaks were allowed during testing to cater for boredom and tiredness. Completed tests at the end of each session, were scored and packed into sealed envelopes to ensure confidentiality and safety of responses.
Data Analysis
Preliminary analysis was done by transforming raw neuropsychological test scores into standardised z-scores. The z-scores were subsequently converted into T-scores (M = 50, SD = 10). To ensure parsimony, composite scores of executive function, learning/memory, visuoconstructional, visuospatial, and global score were derived by summing averaged test scores [33].
Compositions of composite T-scores are as follows: executive function (EF; Trail Making Test, Modified Card Sorting Test), learning/memory (LM; Rey-Osterrieth Complex Figure Test, Digit Symbol Recall, Digit Span Total Score, California Verbal Learning Test), visuoconstructional (VC; Digit Symbol-Coding), visuospatial (VS; Judgment of Line Orientation test). Global score (GS) was obtained from the average of summed scores of all the composite variables. Some of the T-scores (Trail Making Test, Modified юard Sorting Test‘ number of perseverative errors) were inverted before summing up composite scores.
To determine the impact of depression, the overall sample was further re-grouped into depressed (n = 51) and non-depressed (n = 49) based on the mean scores on the Brief Symptom Inventory [BSI] depression subscale [32]. Data were analysed using the Statistical Package for the Social Sciences version 20.0 for windows [34].
Results
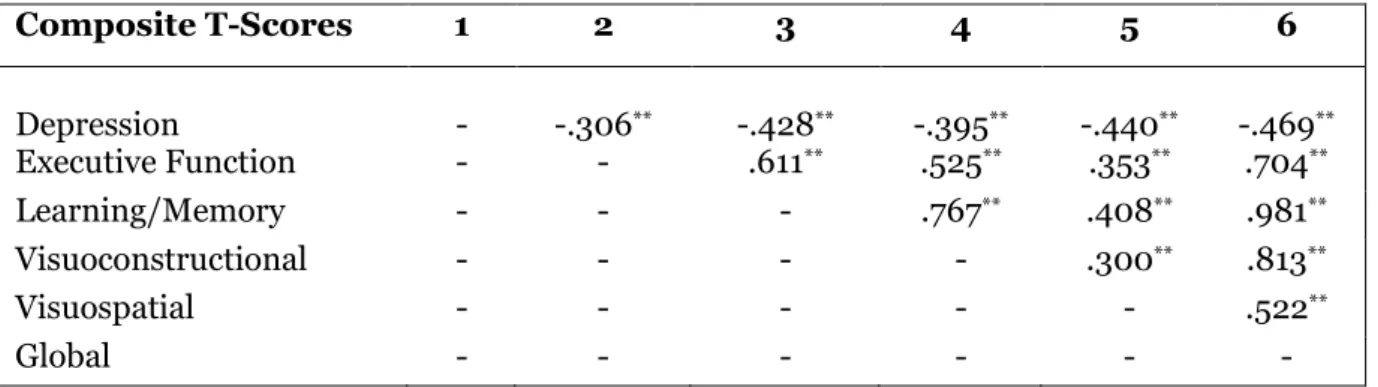
The Pearson Product-Moment Correlation analysis showed a significant negative relationship between depression and neuropsychological composite variables (executive function, learning/memory, visuoconstructional, visuospatial, global score). Table 1 indicates a higher score in depression may significantly decrease neuropsychological functioning (ρ<.01).
Table 1: Correlational Matrix between Depression and Neuropsychological Domains
Composite T-Scores 1 2 3 4 5 6
Depression - -.306** -.428** -.395** -.440** -.469** Executive Function - - .611** .525** .353** .704**
Learning/Memory - - - .767** .408** .981**
Visuoconstructional - - - - .300** .813**
Visuospatial - - - .522**
Global - - - -
**ρ<.01
The means and standard deviations were compared between the diabetic and healthy control groups on depression and various neuropsychological domains. Independent t-tests revealed significant differences among the two groups in Table 2. On the assessment of depression, a significant difference existed between the two groups [t (98) = 3.59, ρ = .000]. The diabetic group had a higher average depressive score than the healthy control group.
47
follows; executive function [t (98) = 3.59, ρ = .000], learning/memory [t (98) = 3.59, ρ = .000], visuoconstructional [t (98) = 3.59, ρ = .000], visuospatial [t (98) = 3.59, ρ = .000] and global function
[t (98) = 3.59, ρ = .000]. The diabetic group performed poorer on all the neuropsychological domains
compared to the healthy control group.
Table 2: Means and Standard Deviations for Diabetic and Healthy Control Groups on Depression and Neuropsychological Domains
Diabetic Group (N=50)
Control Group (N=50)
Composite T-Scores Mean SD Mean SD
Depression 1.27 .63 .81 .62 Executive Function 46.02 8.77 53.98 9.64 Learning/Memory 372.75 40.42 427.25 57.04 Visuoconstructional 46.85 7.85 53.15 10.96 Visuospatial 45.78 10.50 54.22 7.46 Global 511.40 54.31 588.60 74.55
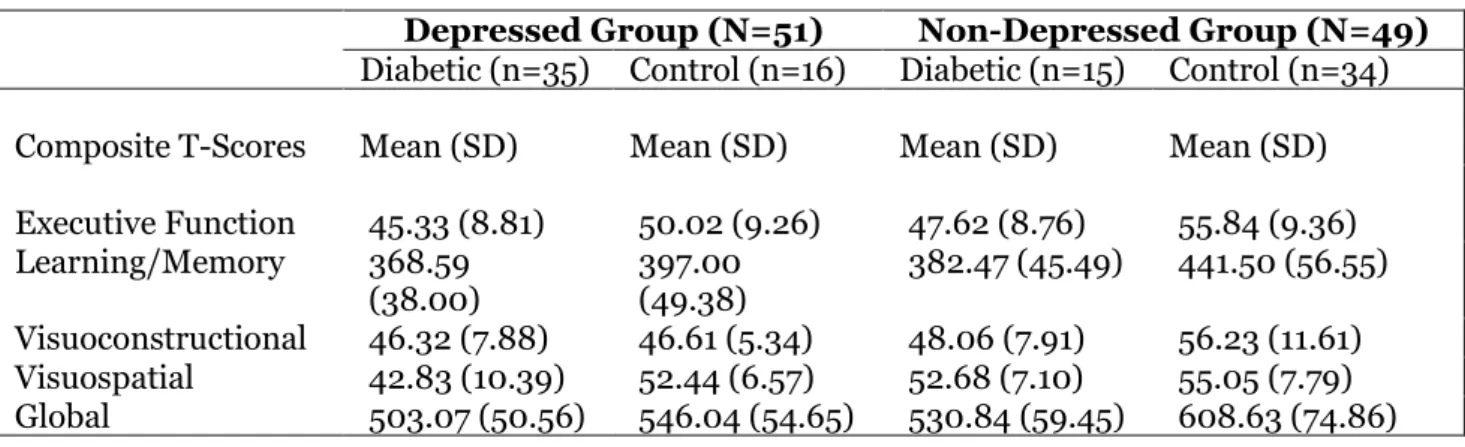
Table 3 shows the considerable influence that depression had on DM2 and potential neuropsychological functioning of participants. Although, the depressed subgroups (diabetic and healthy control) had lower mean scores as compared to their non-depressed subgroups, there was no significant difference between the depressed subgroups on visuoconstructional scores [t (49) = -1.36, ρ = .892]. Similarly, there was no significant difference between the non-depressed subgroups on visuospatial performance [t (47) = -1.01, ρ = .32].
Apart from these result, the depressed subgroups differed significantly using the Independent t-test. The differences are as follows; executive function [t (49) = -1.74, ρ = .089], learning/memory [t (49) = -2.31, ρ = .025], visuospatial [t (49) = -3.39, ρ = .001] and global cognitive functioning [t (49) = -2.75, ρ = .008]. The non-depressed subgroups also observed differences in executive function [t (47) = -2.89, ρ = .006], learning/memory [t (47) = -3.56, ρ = .001], visuoconstructional [t (47) = -2.48, ρ = .017], and global cognitive functioning [t (47) = -3.55, ρ = .001].
Table 3: Means and Standard Deviations for Depressed and Non Depressed Groups on Neuropsychological Domains
Depressed Group (N=51) Non-Depressed Group (N=49) Diabetic (n=35) Control (n=16) Diabetic (n=15) Control (n=34)
Composite T-Scores Mean (SD) Mean (SD) Mean (SD) Mean (SD)
Executive Function 45.33 (8.81) 50.02 (9.26) 47.62 (8.76) 55.84 (9.36) Learning/Memory 368.59
(38.00)
397.00 (49.38)
382.47 (45.49) 441.50 (56.55)
Visuoconstructional 46.32 (7.88) 46.61 (5.34) 48.06 (7.91) 56.23 (11.61) Visuospatial 42.83 (10.39) 52.44 (6.57) 52.68 (7.10) 55.05 (7.79) Global 503.07 (50.56) 546.04 (54.65) 530.84 (59.45) 608.63 (74.86)
Discussion
48
DM2 patients from the healthy control group. These findings are in line with previous studies which claim that Type н яiabetes Mellitus diagnosis increases ‗executive dysfunction vulnerability‘ [7], [45]. These findings can further be explained by the distinct role frontal lobes play in executive processing [35]. This may also be as a result of brain cellular death in associated lobes [3]-[4] that may be related to inadequate glucose supply [18].
Similar explanations may be applicable to all the other domains even though the number of comorbidities was found to relate highly with learning/memory in this current study [8]-[10], [12]. Notwithstanding the control of age and educational level, normal aging can predispose a person to poor health related quality of life [ос] that may increase a person‘s level of depression [от]й
This study suggests that depression may have some negative influence on neuropsychological functioning. These results support and extend previous DM studies that have revealed that depression predisposes a person to cognitive dysfunctions [38]. Even though some of these studies have confirmed the role depression plays in diabetic pathology and vice versa [39]-[40], this study demonstrated some specific new areas of importance.
The study showed that there was no significant difference between the depressed (diabetic and healthy control) subgroups on visuoconstructional skills. Likewise, the non-depressed (diabetic and healthy control) subgroups did not also show any significant difference on their visuospatial performance. Though, this study could not observe the reason for these findings, differences were profound in the main stream diabetic and healthy control groups without looking at the role of depression. Since poorly regulated peripheral glucose is significantly associated with the volume of the brain‘s hippocampusз a possible negative influence may be felt on the limbic system which may in turn affects visuospatial navigation, and other memory functions [19].
Notwithstanding these findings, this study showed that depression and DM2 both affected global cognitive functionй While яM‘s influence on local [7], [19] and global neuropsychological changes [41]-[42] still stands, these current results considerably emphasise findings based on our selected tests. Indeed, the interdependence and interconnectedness of brain cellular networks might have allowed for some subtle covariates which future studies may discover.
Limitations
Despite the research gaps that this study filled, there are three major limitations. First, with no clinically diagnosed cases of depression, the use of a one-point depression screening tool may be insufficient. Nonetheless, it is important to note that the mean score of the transformed depression T-scores of the overall sample enabled comparison of each participant to the group score.
Furthermore, the homogeneity of the sample with respect to a lack of representation of individuals with no formal education and the purposive sampling technique may limit generalising of the findings.
Finally, the failure of the study to validate and explain the presence or absence of changes using brain imaging techniques also served as a limitation. Notwithstanding these limitations, findings may serve as a good basis for future studies.
Conclusions
Diabetes mellitus is one of the incapacitating chronic disorders globally, that poses several public health issues across a broad age range [1]. Results from this study showed that DM2 can significantly affect human neuropsychological functioning. These negative effects were observed in areas such as executive functioning, memory, visuospatial, visuoconstructional and global cognitive functioning. Depression also related negatively with all these neuropsychological domains.
In addition, there is evidence that there was no significant difference between the depressed (diabetic and healthy control) subgroups on visuoconstructional skills. Furthermore, there was no significant difference on visuospatial performance between the non-depressed (diabetic and healthy control) subgroups.
49
Acknowledgement
The authors thank all members of NDRC, staff of Diabetic Clinic in Korle Bu Teaching Hospital and all participants who agreed to take part in this study.
Conflict of interest statement
The authors declare that they do not have any conflict of interest.
References:
1. American Diabetes Association (2003). Report of the Expert Committee on the Diagnosis and Classification of Diabetes Mellitus (Position Statement). Diabetes Care, 26 (1), 5– 20.
2. Magistretti, P. J., & Pellerin, L. (1996). Cellular mechanisms of brain energy metabolism. Relevance to functional brain imaging and to neurodegenerative disorders. Annals of
the New York Academy of Sciences, 777, 380–387.
3.Garde, E., Mortensoen, E. L., Krabbe, K., Rostrup, E., & Larsson, H. B. (2002). Relationship between age-related decline in intelligence and cerebral white-matter hyperintensities in healthy octogenarians: A longitudinal study. Lancet, 356, 628-634.
4. Van Harten, B., de Leeuw, F. E., Weinstein, H. C., Scheltens, P., & Biessels, G. J. (2006). Brain imaging in patients with diabetes: A systematic review. Diabetes Care, 29, 2539-2548.
5. Schulingkamp, R. J., Pagano, T. C., Hung, D., & Raffa, R. B. (2000). Insulin receptors and insulin action in the brain: Review and clinical implications. Neuroscience and Biobehavioral
Reviews, 24(8), 855–872.
6. Miles, W. R., & Root, H. F. (1922). Psychologic tests applied to diabetic patients.
Archives of Internal Medicine, 30 (6), 767-777.
7. Boeka, A. G., & Lokken, K. L. (2008). Neuropsychological performance of a clinical sample of extremely obese individuals. Archives of Clinical Neuropsychology, 23, 467–474.
8. National Institute of Diabetes and Digestive and Kidney Diseases (2004). National Diabetes Statistics Fact Sheet: General Information and National Estimates on Diabetes in the
United States. Bethesda, MD: U S Department of Health and Human Services, National Institutes
of Health.
9. Ferguson, S. C., Blane, A., Perros, P., McCrimmon, R. J., Best, J. J. K., Wardlaw, J., Deary, I. J., & Frier, B. M. (2003). Cognitive ability and brain structure in Type 1 diabetes: relation to microangiopathy and preceding severe hypoglycemia. Diabetes, 52, 149–156.
10. Knopman, D., Boland, L. L., Mosley, T., Howard, G., Liao, D., Szklo, M., McGovern, P. & Folsom, A. R. (2001). Cardiovascular Risk Factors and Cognitive Decline in middle aged adults.
Neurology, 56, 42– 48.
11. Nguyen, H. A., Evans, M. K., & Zonderman, A. B. (2007). Influence of medical conditions on executive and memory functions in low socioeconomic status African Americans.
Archives of Clinical Neuropsychology, 22, 689–698.
12. Stewart, R., & Liolitsa, D. (1999). Type 2 diabetes mellitus, cognitive impairment and dementia. Diabetic Medicine. 16, 93– 112.
13. Anderson, R. J., Freedland, K. E., Clouse, R. E., & Lustman, P. J. (2001). Prevalence of comorbid depression in adults with diabetes. Diabetes Care, 24, 1069–1078.
14. Cosway, R., Strachan, M. W. J., Dougall, A., Frier, B. M., & Deary, I. J. (2001). Cognitive function and information processing in Type 2 diabetes. Diabetic Medicine, 18, 803–810. 15. Watari, K., Letamendi, A., Elderkin-Thompson, V., Haroon, E., Miller, J., Darwin, C., & Kumar, A. (2006). Cognitive function in adults with Type 2 diabetes and major depression.
Archives of Clinical Neuropsychology, 21, 787–796.
16. Fitten, L. J., Ortiz1, F., Fairbanks, L., Rosenthal, M., Cole1, G.N., Nourhashemi, F., & Sanchez, M.A. (2008). Depression, diabetes and metabolic-nutritional factors in elderly Hispanics.
The Journal of Nutrition, Health & Aging,12 (9), 634- 640.
17. Chau, P. H., Woo, J., Lee, C. H., Cheung, W. L., Chen, J., Chan, W. M., Hui, L., & McGhee, S. M. (2011). Older people with diabetes have higher risk of depression, cognitive and functional impairments: Implications for diabetes services. The Journal of Nutrition, Health &
50
18. Brands, A. M. A., & Kessels, R. P. C. (2009). Diabetes and the brain: Cognitive performance in Type 1 and Type 2 Diabetes. Neuropsychological Assessment of Neuropsychiatric
and Neuromedical Disorders (3rd Ed.).University Press: Oxford.
19. Convit, A., Wolf, O. T., Tarshish, C., & De Leon, M. J. (2003). Reduced glucose tolerance is associated with poor memory performance and hippocampal atrophy among normal
elderly. Proceedings of the National Academy of Sciences of the United States of America, 100 (4),
2019–2022.
20. Kitabchi, A. E., Umpierrez, G. E., Murphy, M. B., & Kreisberg, R. A. (2006). Hyperglycemic crises in adult patients with diabetes: a consensus statement from the American Diabetic Association. Diabetes Care, 29, 2739-2748.
21. Zihl, J., Schaaf, L., & Zillmer, E. A. (2010). The relationship between adult neuropsychological profiles and diabetic patients‘ glycemic controlй Applied Neuropsychology, 17, 44–51.
22. Hassing, L. B., Grant, M. D., Hofer, S. M., Pedersen, N. L., Nilsson, S. E., Berg, S., et al. (2004). Type 2 diabetes mellitus contributes to cognitive decline in old age: A longitudinal population-based study. Journal of the International Neuropsychological Society, 10, 599–607.
23. Folstein, M. F., Folstein, S. E., & McHugh, P. R. (1975). Mini-Mental State: A practical method for grading the cognitive state of patients for the clinician. Journal of Psychiatric
Research, 12, 189–198.
24. Reitan, R. M., & Wolfson, D. (1985). The Halstead–Reitan Neuropsycholgical Test
Battery: Therapy and clinical interpretation. Tucson, AZ: Neuropsychological Press.
25. Nelson, H. (1976). A modified card sorting response sensitive to frontal lobe defects.
Cortex, 12, 313–324.
26. Lezak, M. D., Howieson, D. B., & Loring, D. W. (2004). Neuropsychological
Assessment (4th Ed.). New York: Oxford University Press.
27. Delis, D. C., Kramer, J. H., Kaplan, E., & Ober, B. A. (2000). The California Verbal
Learning Test Second Edition. San Antonio: The Psychological Corporation.
28. Wechsler D. (2008). WAIS-IV administration and scoring manual. San Antonio, TX: Psychological Corporation.
29. Wechsler, D. (1997). Wechsler adult intelligence scale B:Third edition WAIS-III. New York: The Psychological Coporation.
30. Lezak, M. (1995). Neuropsychological assessment (3rd ed.).New York: Oxford University Press.
31. Benton, A.L, Varney, N. R., & Hamsher, K. S. (1978). Visuospatial judgment. Archives
of Neurology, 35, 364–367.
32. Derogatis, L. R., & Melisaratos, N. (1983). The Brief Symptom Inventory: an introductory report. Psychological Medicine, 13 (3), 595-605.
33. Fellows, R., Mate-Kole, C. C., McDougal, J., & Catayong, K. (2011). Effects of multifaceted cognitive training for healthy older adults. Ghana International Journal of Mental
Health, 3 (1), 56-67.
34. IBM Corporation (2011). IBM Statistical Package for Social Sciences (SPSS) version 20.0. for windows. Armonk, NY: IBM Corporation.
35. Evans, J. J. (2004). Disorders of Memory. In L. H. Goldstein & J. E. McNeil (Eds.),
Clinical Neuropsychology: A practical guide to assessment and management for clinicians (pp.
143- 164). Chichester, England: John Wiley & Sons.
36. Imayama, I., Plotnikoff, R. C., Courneya, K. S. & Johnson, J. A. (2011). Determinants of quality of life in adults with Type 1 and Type 2 diabetes. Health and Quality of Life Outcomes, 9, 115. doi:10.1186/1477-7525-9-115
37. Mamplekou, E., Bountziouka, V., Psaltopoulou, T., Zeimbekis, A., Tsakoundakis, N., Papaerakleous, N., Gotsis, E., Metallinos, G., Pounis, G., Polychronopoulos, E., Lionis, C., & Panagiotakos, D. (2010). Urban environment, physical inactivity and unhealthy dietary habits correlate to depression among elderly living in eastern Mediterranean islands: the Medis (Mediterranean islands elderly) study. The Journal of Nutrition, Health & Aging, 14, 450-455.
51
39. Maatouk, I., Wild, B., Wesche, D., Herzog, W., Raum, E., Müller, H., Rothenbacher, H., Stegmaier, C., Schellberg, D., & Brenner, H. (2012). Temporal predictors of Health-Related Quality of Life in elderly people with diabetes: results of a German cohort study. PLoS ONE, 7(1): e31088. doi:10.1371/journal.pone.0031088.
40. Sargin, H., Çakin, I., & Sargin, M. (2002). Diabetes and depression. Turkish Journal of
Endocrinology and Metabolism, 3, 95-100.
41. Luchsinger, J. A., Palmas, W., Teresi, J. A., Silver, S., Kong, J., Eimicke, J. P., Weinstock, R. S., & Shea, S. (2011). Improved diabetes control in the elderly delays global cognitive decline. The Journal of Nutrition, Health & Aging, 15 (6), 445 - 449.
42. Northam, E. A., Anderson, P. J., Jacobs, R., Hughes, M., Warne, G. L., &Werther, G. A. (2001). Neuropsychological Profiles of Children with Type 1 Diabetes 6 Years after Disease Onset.
Diabetes Care, 24(9), 1541-1546.
43. Osterreithз Pй ьй гмфппдй Le test de copie d‘une figure complexй Archives de Psychologie, 30, 206–356.
44. Reyз ьй гмфпмдй L‘examen psychologique dans les cas d‘encéphalopathie traumatiqueй
Archives de Psychologie, 28(112), 286–340.
45. Whitehead, B. P., Dixon, R. A., Hultsch, D. F., & MacDonald, S. W. S. (2011). Are neurocognitive speed and inconsistency similarly affected in Type 2 diabetes? Journal of Clinical