External control over the
fluoridation of the public
water supply in Bauru, SP,
Brazil
ABSTRACT
OBJECTIVE: To assess the fluoridation of the public water supply and compare
these results with previous data.
METHODS: The study was carried out from March 2004-2005 in Bauru, a city of
Southeastern Brazil. Every month, on dates established randomly, 60 water samples were collected from the 19 supply sectors of the city, totaling 737 samples. The fluoride concentration in the water samples was determined in duplicate, using an ion-specific electrode (Orion 9609) coupled to a potentiometer. Following analysis, the samples were classified as acceptable or unacceptable according to their fluoride concentration. Descriptive statistical analysis was utilized.
RESULTS: The mean fluoride concentration observed in the different collection
months ranged from 0.37 to 1.00 mg/l. Around 85% of the samples were classified as acceptable.
CONCLUSIONS: One year after implementing external control, an improvement in
the water fluoridation conditions was observed in comparison with previous results obtained in the city. The implementation of water supply fluoridation monitoring by means of surveillance systems must be stimulated: this is fundamental for controlling dental caries.
KEYW O RD S: Fluoridation. Water quality control. Water monitoring. Water supply. H ealth surveillance.
Irene RamiresI
Luciana Prado M aiaI
D aniela dos Santos RigolizzoI
José Roberto Pereira LaurisII
M arília Afonso Rabelo BuzalafIII
I Faculdade de Odontologia de Bauru (FOB).
Universidade de São Paulo (USP). Bauru, SP, Brasil
I I Departamento de Odontopediatria,
Ortodontia e Saúde Coletiva. FOB. USP. Bauru, SP, Brasil
I I IDepartamento de Ciências Biológicas.
FOB. USP. Bauru, SP, Brasil
Correspondence:
Marília Afonso Rabelo Buzalaf Faculdade de Odontologia de Bauru - FOB/USP
Departamento de Ciências Biológicas Área de Bioquímica
Al. Dr. Octávio Pinheiro Brisolla, 9-75 17012-901 Bauru, SP, Brasil
E-mail: [email protected]
INTRODUCTION
The World Health Organization and other institutions recognize and indicate fluoridation as a public health
measure.4,8,9 In Brazil, the Ministry of Health and the
representative bodies for dentistry recommend fluori-dation of the water supply, in accordance with the norms issued by this Ministry. Ordinance No. 518, dated March 25, 2004, “establishes procedures and responsibilities relating to control and surveillance over the quality of water for human consumption”.*
Sanitary surveillance is a specific subsector of pub-lic health relating to sanitary control for the environ-ment, food and medical and pharmaceutical practice. Moreover, it deals with control over products, tech-nologies and services that are directly related to the complex comprising health, disease, care and qual-ity of life, with the aim of protecting this complex. Sanitary surveillance actions are health actions that seek to protect and maintain individual health and consequently collective health. They are also a tool for economic organization of society, since these pro-tective actions include not only citizens and con-sumers but also producers.**
Monitoring is a valuable resource among the actions within the field of sanitary surveillance, and includes services and laboratories. It has the aims of identify-ing prominent or virtual risks of diseases and provid-ing assurances regardprovid-ing products, services and envi-ronments*** that require continuous attention and which are widely used in the industrial sector and
routinely used in public water supply services.**,***
All the positive aspects of water supply fluoridation depend on maintaining and stabilizing the fluoride
content at the appropriate level.2-6,8 Some studies10,11
have shown the importance of maintaining small quan-tities of fluoride in the oral cavity for effective control over dental caries. This concept of dynamic caries re-duction is based on studies on the effects of fluoride during demineralization. Frequent increments in fluo-ride levels in the mouth reduce the mineral loss, thus
reducing the progression of the caries.4,10,11
Furthermore, studies10,11 have shown that, in
popula-tions supplied with fluoridated water, the fluoride concentration on the plaque is not significantly in-creased over a large proportion of the day through the use of fluoridated toothpaste. Although the fluo-ride concentration on the plaque and in saliva in-creases abruptly during the use of a fluoridated tooth-paste or a fluoridated mouthwash, it declines rapidly thereafter. After one or two hours, it becomes close to or even the same as the basal concentrations. One or more transient elevations in fluoride levels may oc-cur during the day, according to the frequency of each individual’s use of toothpaste. Thus, in a region sup-plied with fluoridated water, the fluoride concentra-tions over most of the day may be similar and conse-quent to the use of fluoridated water, regardless the use of fluoridated toothpaste.
Continual monitoring of fluoridation equipment and maintenance of the fluoride concentration within the recommended levels are constant problems in the
supply systems.2,5,7-9
Fluoridation of the public water supply was imple-mented in Bauru, in October 1975. Since then, some studies have shown that the Water and Sewage De-partment has some degree of difficulty in keeping the fluoride concentration within the recommended
levels for the region.2,7
The need to develop control mechanisms for fluorida-tion has led to the emergence of the concept of exter-nal control. According to Narvai, “exterexter-nal control is the principle that, if an item or service implies a risk or represents a protection factor for public health, then in addition to the producer’s control over the production, distribution and consumption process, there must also be control by State institutions”. The implementation of surveillance systems based on external control may make an effective contribution towards improving the
quality of the fluoridation.6,****,*****
Because of the importance of continuity in adapting and maintaining the fluoride levels, it was decided to implement external control over the fluoridation of the public water supply in Bauru (Southern Brazil), with f inancial support from the Faculdade de Odontologia de Bauru (Bauru Dental School - FOB/
*Ministério da Saúde. Portaria n. 518, de 25 de março de 2004. Estabelece os procedimentos e responsabilidades relativas ao controle e vigilância da qualidade da água para o consumo humano e seu padrão de potabilidade, e dá outras providências. Diário Oficial da União. 16 mar 2004; Seção 1:266-70.
**Costa EA. Vigilância sanitária e proteção da saúde. In: Ministério da Saúde, Secretaria de Gestão do Trabalho e da Educação na Saúde, Departamento de Gestão da Educação na Saúde. Direito Sanitário e Saúde Pública. Brasília (DF); 2003; p.179-206.
***Waldman E. Vigilância epidemiológica como prática de saúde pública [tese de doutorado]. São Paulo: Faculdade de Saúde Pública da Universidade de São Paulo; 1991.
****Narvai PC. Vigilância sanitária da fluoretação das águas de abastecimento público no município de São Paulo, Brasil, no período de 1990-1999 [tese de livre-docência]. São Paulo: Faculdade de Saúde Pública da Universidade de São Paulo; 2001.
USP) and the Conselho Nacional de Pesqui-sa (National Research Council - CNPq). The external control system was put into opera-tion in Bauru in March 2004.
Thus, the present study had the objective of evaluating the fluoridation of the public water supply, by comparing the results ob-tained following the implementation of the external control with previous data on the fluoridation. Through this, it was intended to verify the effectiveness of the external control over the fluoridation.
M ETH O D S
Bauru is located in the southeastern region of Brazil and western part of the State of São Paulo. The annual mean temperature is 26°C; the mean during the winter is 17°C and the mean during the summer is 30°C. The fluo-ride concentration control carried out by the supply company does not take into consid-eration the temperatures in different months of the year, although there is a significant seasonal variation that is directly reflected in the consumption.*
Bauru’s water is supplied in a singular man-ner, with conventional chlorination and fluoridation treatment. A network of pipes from the Water Treatment Station supplies 44% of the population, and the remaining 56% of the population is supplied by 27 ar-tesian wells.
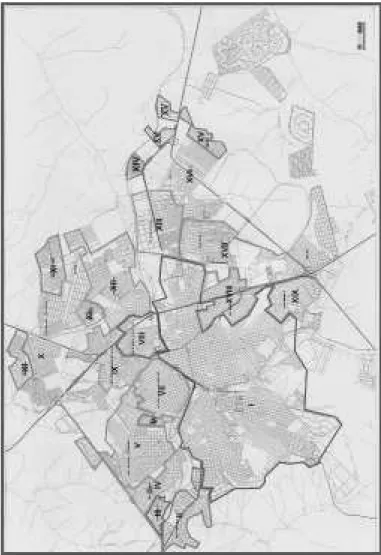
The system is divided into sectors and
com-prises 19 sectors (Figure). A population of 326,392 inhabitants is supplied through the pipe network, which is around 1,500 km in length. In each of the sectors, there is one or more wells for domestic ply, in addition to the Water Treatment Station sup-ply. The latter is responsible for supplying the larger and more heavily populated sectors of the city. The wells that directly supply homes in a given sector are connected to other wells and reservoirs via the Water and Sewage Department’s network of underground water supply connections. This is a continuous and automated process.
The sample was defined from the supply sectors on the city map (Figure). Each of the sectors had three
sample collection points, except for Sector I, with six points (supplied by the Water Treatment Station). Because of the size of Sector 1, it is bounded by many other sectors and therefore a larger number of samples were necessary for confirming that the fluo-ride levels in its water were being maintained. The number of samples was greater than what was re-quired by the singularity of the sector, and was in accordance with the recommendations in the legis-lation in force.** Thus, in accordance with the pro-tocol defined, 60 water samples needed to be col-lected every month, giving a total of 720 per year (12 months). The number of samples envisaged for the period from March 2004 to March 2005 would therefore be 780 (13 months).
Figure - Location of the 19 supply sectors. M unicipality of Bauru,
Southeastern Brazil, 2004.
Source: Ramires I. Avaliação da concentração de flúor na água de abastecimento público, antes e depois dos procedimentos de fluoretação [Master’s dissertation]. Faculdade de Odontologia de Bauru. Universidade de São Paulo; 2004. p. 189.
*Ramires I. Avaliação da concentração de flúor na água de abastecimento público, antes e depois dos procedimentos de fluoretação [dissertação de mestrado]. São Paulo: Faculdade de Odontologia de Bauru da Universidade de São Paulo; 2004.
In order to facilitate site access and avoid sample losses, it was defined that the collection points would be public institutions, primary health care units and State and Municipal Schools. The Departments of Education and Health and the Regional Educational Inspectorate were contacted by means of explana-tory letters, and they authorized the collection of water samples.
Plastic 50 ml vials were used for sample collection. These were labeled in advance with the identifica-tion of the sector, collecidentifica-tion point and date. At the end of the collection, the vials were stored -20°C, for subsequent fluoride analysis on the samples.
The fluoride concentration in the water samples was determined in duplicate, using an ion-specific electrode (Orion 9609) coupled to a potentiometer (Procyon, model 720), with 1.0 ml of the sample, to which 1.0 ml of TISAB II (Orion) had been added. This electrode had been previously calibrated with standard solutions con-taining 0.1, 0.2, 0.4, 0.8, 1.6 or 3.2 mg of fluoride. Only
calibration curves with a maximum variation of 5% were accepted. All the analyses were performed in duplicate, in order to test the repeatability of the readings. The results were checked by making new readings on 10% of the samples, so that the reproducibility of the analy-sis could be assessed.
The samples were classified according to their fluo-ride levels. When samples presented fluofluo-ride levels between 0.55 and 0.84 ppm (mg F/l), they were con-sidered to be “acceptable”. Samples with fluoride lev-els outside of this range were considered to be “unac-ceptable” (Table 1).
The data relating to fluoride levels in the water were analyzed by means of descriptive statistics.
RESU LTS
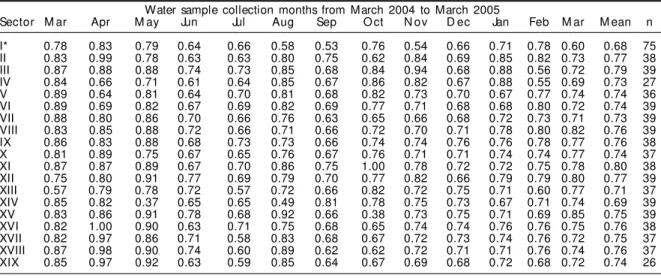
A total of 737 water samples were collected, although the initially established number was 780 samples. The losses were due to lack of water at the time of collection in some sectors or other technical supply problems. The mean fluoride concentrations (mg F/l) observed are shown in Table 2. The sectors with the lowest and highest mean fluoride concentrations over the collection period were I (0.68 mg F/l) and XI (0.80 mg F/l) (Table 2). The mean fluoride concentration observed in each collection month ranged from 0.37 mg/l (May 2004, Sector XIV) to 1 mg/l (April and October 2004, Sectors XVI and XI respectively).
Considering only the variation in the final mean for each of the supply sectors over the analysis period, it was seen that the fluoridation was within the levels Table 1 - Classification of samples according to the fluoride
concentration (mg/l).*
Fluoride concentration Classification
0 to 0.54 Unacceptable (caries protection factor)
0.55 M inimal acceptable level
0.55 to 0.64 Under-fluoridated
0.65 to 0.74 Optimal
0.75 to 0.84 Over-fluoridated
0.84 M aximal acceptable level
0.85 to 1.14 Inadequate
≥1.15 Unacceptable (fluorosis risk factor) *Extracted from: Ramires I. Avaliação da concentração de flúor na água de abastecimento público, antes e depois dos procedimentos de fluoretação [Master’s dissertation]. Fa-culdade de Odontologia de Bauru. Universidade de São Paulo; 2004. p. 189.
Table 2 - Mean fluoride concentrations in the water samples, according to public supply sectors. Bauru, Southeastern Brazil, March 2004 to March 2005.
Water sample collection months from March 2004 to March 2005
Sector M ar Apr M ay Jun Jul Aug Sep O ct N ov D ec Jan Feb M ar M ean n I* 0.78 0.83 0.79 0.64 0.66 0.58 0.53 0.76 0.54 0.66 0.71 0.78 0.60 0.68 75 II 0.83 0.99 0.78 0.63 0.63 0.80 0.75 0.62 0.84 0.69 0.85 0.82 0.73 0.77 38 III 0.87 0.88 0.88 0.74 0.73 0.85 0.68 0.84 0.94 0.68 0.88 0.56 0.72 0.79 39 IV 0.84 0.66 0.71 0.61 0.64 0.85 0.67 0.86 0.82 0.67 0.88 0.55 0.69 0.73 27 V 0.89 0.64 0.81 0.64 0.70 0.81 0.68 0.82 0.73 0.70 0.67 0.77 0.74 0.74 36 VI 0.89 0.69 0.82 0.67 0.69 0.82 0.69 0.77 0.71 0.68 0.68 0.80 0.72 0.74 39 VII 0.88 0.80 0.86 0.70 0.66 0.76 0.63 0.65 0.66 0.68 0.72 0.73 0.71 0.73 39 VIII 0.83 0.85 0.88 0.72 0.66 0.71 0.66 0.72 0.70 0.71 0.78 0.80 0.82 0.76 39 IX 0.86 0.83 0.88 0.68 0.73 0.73 0.66 0.74 0.74 0.76 0.76 0.78 0.77 0.76 38 X 0.81 0.89 0.75 0.67 0.65 0.76 0.67 0.76 0.71 0.71 0.74 0.74 0.77 0.74 37 XI 0.87 0.87 0.89 0.67 0.70 0.86 0.75 1.00 0.78 0.72 0.72 0.75 0.78 0.80 38 XII 0.75 0.80 0.91 0.77 0.69 0.79 0.70 0.77 0.82 0.66 0.79 0.79 0.80 0.77 39 XIII 0.57 0.79 0.78 0.72 0.57 0.72 0.66 0.82 0.72 0.75 0.71 0.60 0.77 0.71 37 XIV 0.85 0.82 0.37 0.65 0.65 0.49 0.81 0.78 0.75 0.73 0.67 0.71 0.74 0.69 39 XV 0.83 0.86 0.91 0.78 0.68 0.92 0.66 0.38 0.73 0.75 0.71 0.69 0.85 0.75 39 XVI 0.82 1.00 0.90 0.63 0.71 0.75 0.68 0.65 0.74 0.74 0.76 0.76 0.75 0.76 38 XVII 0.82 0.97 0.86 0.71 0.58 0.83 0.68 0.67 0.72 0.73 0.74 0.76 0.72 0.75 37 XVIII 0.87 0.98 0.90 0.74 0.60 0.89 0.62 0.62 0.72 0.71 0.71 0.76 0.74 0.76 37 XIX 0.85 0.97 0.92 0.63 0.59 0.85 0.64 0.67 0.69 0.68 0.72 0.68 0.72 0.74 26 Total number of samples: 737
that are defined as ideal. Over this period, the general mean fluoride concentration ranged from 0.68 to 0.80 mg F/l (Table 2). However, by analyzing the mean concentration observed in each of the sectors in the different months, significant variation was seen, from 0.37 to 1 mg F/l. Sector XI, which presented the high-est final mean (0.80 mg F/l) for the period, was also where the greatest fluoride concentration (monthly mean of 1.00 mg F/l) was found, i.e. high fluoride concentrations predominated in that sector. The same was true for Sector III. On the other hand, Sectors I and XIV presented the lowest means for the period (0.68 and 0.69 mg F/l), with predominance of low fluoride concentrations (Table 2).
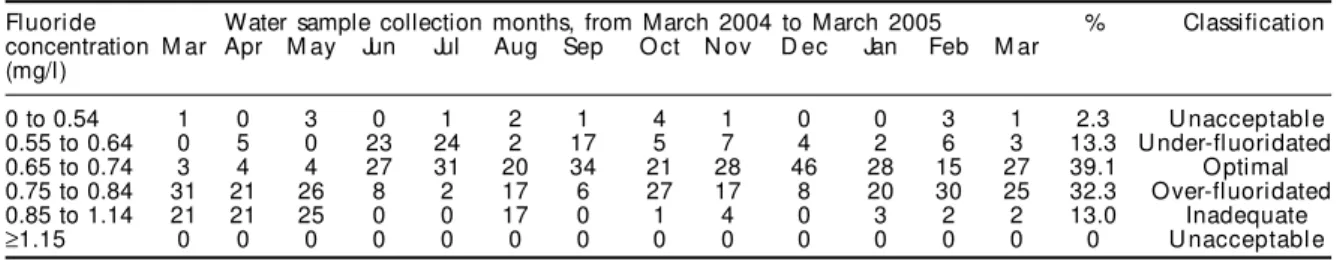
In the classification of water samples, around 85% of them presented fluoride concentrations between the minimum and maximum acceptable levels, while 13.1% were classified as under-fluoridated, 39.1% as optimal and 32.3% as over-fluoridated. Also in rela-tion to the sample classificarela-tion, the fluoride con-centration was considered to be unacceptable in 13.0%, and inadequate in 2.3%. The largest number of samples classified as unacceptable was seen in October 2004 (n=4); as under-fluorinated in July 2004
(n=24); as optimal in December 2004 (n=46); as
over-fluorinated in March 2004 (n=31) and as inadequate in May 2004 (n=25) (Table 3).
D ISCU SSIO N
In Bauru, the Water and Sewage Department is an autonomous agency belonging to the city authori-ties. For this reason, sanitary surveillance by the Municipal Health Department for implementing ex-ternal control is contraindicated, or even impossible.
According to Narvai6 (2000), it is essential that the
fluoridation of the public water supply should be monitored by institutions that are not involved in the fluoridation procedures, in order to ensure impartial-ity and credibilimpartial-ity for the results obtained.
Ramires (2004)* conducted a one-year analysis (2003 to 2004) of fluoride concentrations in the water supply
of the city of Bauru, performing collections every three months, and found different results in some supply sec-tors. The mean fluoride concentrations found in the 297 samples obtained from the Water Treatment Station and wells ranged from 0.26 to 6.23 mg F/l and, in the 697 samples from homes, from 0.10 to 0.91 mg F/l.
Comparing the results from Ramires* with those from the present study, it was observed that there was an inversion in the fluoride concentration lev-els in the water from some sectors. Analysis of the fluoride concentrations in the samples from Sector XI, the one with the highest mean (0.80 mg F/l), clearly shows the inversion, since this sector pre-sented the lowest mean fluoride concentrations in the earlier study,* between 0.18 and 0.70 mg F/l. Another difference in fluoridation was observed in Sector XIV, where the external control gave fluoride concentration results ranging from 0.37 mg/l to 0.85 mg/l, with a mean of 0.69 mg/l. However, in the ear-lier study,* this same sector presented high fluoride concentrations in the water. These disparate find-ings reinforce the need for constant monitoring of fluoride levels in the water supply.
In addition, it is important to reinforce the informa-tion that each sector is supplied by one or more wells, while Sector I in particular is supplied by the Water Treatment Station. This makes it impossible to calcu-late an average for the whole city, since each sector has its own characteristics that influence the fluori-dation. Therefore, a citywide average might conceal a fluoridation problem in one or more sectors, or even give information that does not correspond to the real situation of fluoridation in the city of Bauru.
Among the acceptable samples according to fluoride levels (85%), 39.3% were classified as optimal. How-ever, 13.0% of the samples presented fluoride levels classified as inadequate (over 0.84 mg/l). These re-sults indicate that the tendency towards under-fluori-dation changed to optimal and even over-fluorida-tion (84.4%), in comparison with the previous re-sults,* in which around 62% of the samples collected
*Ramires I. Avaliação da concentração de flúor na água de abastecimento público, antes e depois dos procedimentos de fluoretação [dissertação de mestrado]. São Paulo: Faculdade de Odontologia de Bauru da Universidade de São Paulo; 2004.
Table 3 - Classification of the water samples according to the fluoride concentration. Bauru, Southeastern Brazil, March 2004 to March 2005
Fluoride Water sample collection months, from March 2004 to March 2005 % Classification concentration M ar Apr M ay Jun Jul Aug Sep O ct N ov D ec Jan Feb M ar
(mg/l)
0 to 0.54 1 0 3 0 1 2 1 4 1 0 0 3 1 2.3 U nacceptable
0.55 to 0.64 0 5 0 23 24 2 17 5 7 4 2 6 3 13.3 Under-fluoridated
0.65 to 0.74 3 4 4 27 31 20 34 21 28 46 28 15 27 39.1 Optimal
0.75 to 0.84 31 21 26 8 2 17 6 27 17 8 20 30 25 32.3 Over-fluoridated
0.85 to 1.14 21 21 25 0 0 17 0 1 4 0 3 2 2 13.0 Inadequate
from homes presented concentrations within the range defined as acceptable.
Comparing the results from the present study with
those obtained by Buzalaf et al2 (2002) and Ramires*
(2004), it can be stated that there was an improve-ment in the fluoridation system for the public water supply in the city of Bauru. Although the collection points were not the same, since primary healthcare units and State and Municipal Schools were selected for external control, they likewise represented sev-eral supply points in the city.
The findings from this first year of external control in Bauru are similar to those obtained in the city of São Paulo over the first year of implementation.** In that study, from January to December 1994, 625 water sam-ples were collected in São Paulo, among which 97% presented fluoride concentrations within levels consid-ered to be acceptable, i.e. between 0.6 and 0.8 mg F/l.
São Paulo was the first city in the country to imple-ment an external control system for monitoring the fluoridation of the public water supply, in 1990 (named the Municipal System for Sanitary Surveil-lance of Water Fluoridation). Collections are per-formed monthly, at 62 points on randomly chosen dates. Implementation in São Paulo took place five years after fluoridation started in the city, in October 1985.** This is different from Bauru, where the sys-tem was implemented 29 years after fluoridation in the city started. Only one year after implementing it, external control shows very positive results, thus re-inforcing the importance of its implementation in other municipalities.
The results obtained by Manfredini (apud Narvai,**
2001) in the city of Santos are somewhat different. In 1991, one year after implementation, around 68% of the samples were considered to be acceptable regard-ing the level of fluoride, and this figure increased to 94% in 1992. Narvai reported that other examples of surveillance systems for fluoridation based upon ex-ternal control can also be seen, in Curitiba, Fortaleza and Salvador, among others.
In 1996, only 32 municipalities in the State of São Paulo were carrying out sanitary surveillance on
fluoride levels in the public water supply, which corresponds to 44% of the total population receiv-ing the benefits of fluoridation. However, this high coverage of the population in relation to the small number of municipalities is due to the state capital, the city of São Paulo, which represents around 74% of the population of this group. Exclusion of the city of São Paulo from among the cities in which external control is performed results in a figure of only 8.9% of the population of the State supplied with fluoridated water. The surveillance systems need to be expanded to maintain and ensure the maximum benefit from this measure.***
The preventive effects of fluoride, which are widely recognized in public health actions, are greater when water in used as the carrier, because of its collective availability, effectiveness, cost and frequency of
con-sumption.2,5,6,8 According to the Centers for Disease
Control and Prevention (CDC) in the United States, fluoridation of the public water supply is one of the ten most important achievements of the twentieth century. Also according to the CDC, the dental caries control rate by means of fluoridated water is 40% to 70% in children, depending on the caries prevalence rate, and it reduces tooth losses among adults by 40%
to 60%.3 Thus, the benefit of water fluoridation is
proportionally larger in the segments of society that do not have access to other intake sources and there-fore need it most.****
Another point to be considered regarding dental car-ies control through the use of fluoride is that it is specific for each individual and the length of expo-sure. Thus, it cannot be experienced by people who are not directly exposed to fluoride.
Unlike other disease prevention methods that result in the eradication of an etiological agent, the ben-efits of fluoridation are not transmissible to future
generations.1 Therefore, maintenance and control over
fluoridation through surveillance systems are essen-tial for controlling dental caries.
In this context, external control over water supply fluoridation has an extremely important role, through its additional effort towards improving the oral health conditions of the population.
*Ramires I. Avaliação da concentração de flúor na água de abastecimento público, antes e depois dos procedimentos de fluoretação [dissertação de mestrado]. São Paulo: Faculdade de Odontologia de Bauru da Universidade de São Paulo; 2004.
**Narvai PC. Vigilância sanitária da fluoretação das águas de abastecimento público no município de São Paulo, Brasil, no período de 1990-1999 [tese de livre-docência]. São Paulo: Faculdade de Saúde Pública da Universidade de São Paulo; 2001.
***Calvo MCM. Situação da fluoretação da água de abastecimento público no estado de São Paulo, Brasil [dissertação de mestrado]. São Paulo: Faculdade de Saúde Pública de São Paulo da Universidade de São Paulo; 1996.
REFEREN CES
1. Brunelle JA, Carlos JP. Recent trends in dental caries in U.S. children and the effect of water fluoridation. J Dent Res. 1990;69(Spec N):723-7.
2. Buzalaf MAR, Granjeiro JM, Damante CA, Ornelas F. Fluctuations in public water fluoride level in Bauru, Brazil. J Public Health Dent. 2002;62:173-6. 3. Centers for Disease Control and Prevention - CDC.
Achievements in public health, 1900-1999: fluoridation of drinking water to prevent dental caries. MMWR Morb Mortal Wkly Rep. 1999;48:933-40.
4. Cury JA. Uso do flúor e controle da cárie como doença. In: Baratieri LN, Monteiro Junior S, Andrada MAC, Vieira LCC, Ritter AV, Cardoso AC, et al. Odontologia restauradora. São Paulo: Ed. Santos; 2001. p. 34-68.
5. Murray JJ. O uso correto de fluoretos na saúde pública. São Paulo: Ed. Santos; 1992.
6. Narvai PC. Cárie dentária e flúor: uma relação do século XX. Ciênc Saúde Coletiva. 2000;5:381-92. 7. Tavares PG, Bastos JRM. Concentração de flúor na
água: cárie, fluorose e teor de flúor urinário em escolares de Bauru-SP. Rev Assoc Paul Cir Dent. 1999;53:407-15.
8. Viegas AR, Viegas I, Castellanos RA, Rosa AGF. Fluoretação da água de abastecimento público. Rev Assoc Paul Cir Dent. 1987;41:202-4.
9. Viegas AR. Fluoretação da água de abastecimento público. RBM Rev Bras Med. 1989;46:209-16. 10. Whitford GM, Wasdin JL, Schafer TE, Aidar SM.
Plaque fluoride concentrations are dependent on plaque calcium concentrations. Caries Res. 2002;36:256-65.
11. Whitford GM, Buzalaf MA, Bijella MF, Waller JL. Plaque fluoride concentrations in a community without water fluoridation: effects of calcium and use of a fluoride or placebo dentifrice. Caries Res. 2005;39:100-7.
Study carried out in the Department of Biological Sciences, Faculdade de Odontologia de Bauru, Universidade de São Paulo.
Funded by Conselho Nacional de Desenvolvimento Científico e Tecnológico (CNPq - Grant n. 403427/2004-5), and by Faculdade de Odontologia de Bauru, Universidade de São Paulo.
Presented at the International Dental Fluorosis Seminar, in Bauru, on November 8-9, 2004, and at the 22nd Annual Meeting