Erratum
Rev Saúde Pública 2007;41(1):167-8Rev. Saúde Pública 2006;40(N Esp)
Tabela 2 /
Table 2 –
Página /
Page
19
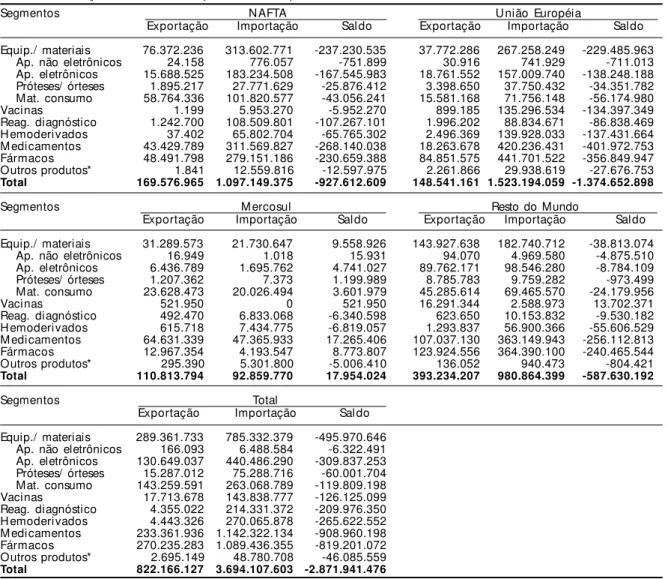
Os valores das colunas referentes à União Européia e Mercosul foram trocados. Substituir a Tabela conforme a
seguir. /
Values in the columns of European Union and Mercosul were switched. Replace the Table as follows:
Tabela 2 incorreta /
Incorrect Table 2
Segmentos N AFTA U nião Européia
Exportação Importação Saldo Exportação Importação Saldo
Equip./ materiais 76.372.236 313.602.771 -237.230.535 31.289.573 21.730.647 9.558.926
Ap. não eletrônicos 24.158 776.057 -751.899 16.949 1.018 15.931
Ap. eletrônicos 15.688.525 183.234.508 -167.545.983 6.436.789 1.695.762 4.741.027 Próteses/ órteses 1.895.217 27.771.629 -25.876.412 1.207.362 7.373 1.199.989 Mat. consumo 58.764.336 101.820.577 -43.056.241 23.628.473 20.026.494 3.601.979
Vacinas 1.199 5.953.270 -5.952.270 521.950 0 521.950
Reag. diagnóstico 1.242.700 108.509.801 -107.267.101 492.470 6.833.068 -6.340.598 H emoderivados 37.402 65.802.704 -65.765.302 615.718 7.434.775 -6.819.057 M edicamentos 43.429.789 311.569.827 -268.140.038 64.631.339 47.365.933 17.265.406 Fármacos 48.491.798 279.151.186 -230.659.388 12.967.354 4.193.547 8.773.807 Outros produtos* 1.841 12.559.816 -12.597.975 295.390 5.301.800 -5.006.410
Total 169.576.965 1.097.149.375 -927.612.609 110.813.794 92.859.770 17.954.024
Segmentos M ercosul Resto do Mundo
Exportação Importação Saldo Exportação Importação Saldo
Equip./ materiais 37.772.286 267.258.249 -229.485.963 143.927.638 182.740.712 -38.813.074 Ap. não eletrônicos 30.916 741.929 -711.013 94.070 4.969.580 -4.875.510 Ap. eletrônicos 18.761.552 157.009.740 -138.248.188 89.762.171 98.546.280 -8.784.109 Próteses/ órteses 3.398.650 37.750.432 -34.351.782 8.785.783 9.759.282 -973.499 Mat. consumo 15.581.168 71.756.148 -56.174.980 45.285.614 69.465.570 -24.179.956 Vacinas 899.185 135.296.534 -134.397.349 16.291.344 2.588.973 13.702.371 Reag. diagnóstico 1.996.202 88.834.671 -86.838.469 623.650 10.153.832 -9.530.182 H emoderivados 2.496.369 139.928.033 -137.431.664 1.293.837 56.900.366 -55.606.529 M edicamentos 18.263.678 420.236.431 -401.972.753 107.037.130 363.149.943 -256.112.813 Fármacos 84.851.575 441.701.522 -356.849.947 123.924.556 364.390.100 -240.465.544 Outros produtos* 2.261.866 29.938.619 -27.676.753 136.052 940.473 -804.421
Total 148.541.161 1.523.194.059 -1.374.652.898 393.234.207 980.864.399 -587.630.192
Segmentos Total
Exportação Importação Saldo
Equip./ materiais 289.361.733 785.332.379 -495.970.646 Ap. não eletrônicos 166.093 6.488.584 -6.322.491 Ap. eletrônicos 130.649.037 440.486.290 -309.837.253 Próteses/ órteses 15.287.012 75.288.716 -60.001.704 Mat. consumo 143.259.591 263.068.789 -119.809.198 Vacinas 17.713.678 143.838.777 -126.125.099 Reag. diagnóstico 4.355.022 214.331.372 -209.976.350 H emoderivados 4.443.326 270.065.878 -265.622.552 M edicamentos 233.361.936 1.142.322.134 -908.960.198 Fármacos 270.235.283 1.089.436.355 -819.201.072 Outros produtos* 2.695.149 48.780.708 -46.085.559
Total 822.166.127 3.694.107.603 -2.871.941.476
NAFTA: North American Free Trade Agreement
Fonte: Elaboração própria a partir de levantamento efetuado na Rede Alice (SECEX/MDIC). *Soros e Toxinas
Valores em US$ Free On Board
168 Erratum Rev Saúde Pública 2007;41(1):167-8
Segmentos N AFTA U nião Européia
Exportação Importação Sal do Exportação Importação Sal do
Equip./ materiais 76.372.236 313.602.771 -237.230.535 37.772.286 267.258.249 -229.485.963
Ap. não eletrônicos 24.158 776.057 -751.899 30.916 741.929 -711.013
Ap. eletrônicos 15.688.525 183.234.508 -167.545.983 18.761.552 157.009.740 -138.248.188 Próteses/ órteses 1.895.217 27.771.629 -25.876.412 3.398.650 37.750.432 -34.351.782 Mat. consumo 58.764.336 101.820.577 -43.056.241 15.581.168 71.756.148 -56.174.980
Vacinas 1.199 5.953.270 -5.952.270 899.185 135.296.534 -134.397.349
Reag. diagnóstico 1.242.700 108.509.801 -107.267.101 1.996.202 88.834.671 -86.838.469 H emoderivados 37.402 65.802.704 -65.765.302 2.496.369 139.928.033 -137.431.664 M edicamentos 43.429.789 311.569.827 -268.140.038 18.263.678 420.236.431 -401.972.753 Fármacos 48.491.798 279.151.186 -230.659.388 84.851.575 441.701.522 -356.849.947 Outros produtos* 1.841 12.559.816 -12.597.975 2.261.866 29.938.619 -27.676.753
Total 169.576.965 1.097.149.375 -927.612.609 148.541.161 1.523.194.059 -1.374.652.898
Segmentos M ercosul Resto do Mundo
Exportação Importação Sal do Exportação Importação Sal do
Equip./ materiais 31.289.573 21.730.647 9.558.926 143.927.638 182.740.712 -38.813.074
Ap. não eletrônicos 16.949 1.018 15.931 94.070 4.969.580 -4.875.510
Ap. eletrônicos 6.436.789 1.695.762 4.741.027 89.762.171 98.546.280 -8.784.109 Próteses/ órteses 1.207.362 7.373 1.199.989 8.785.783 9.759.282 -973.499 Mat. consumo 23.628.473 20.026.494 3.601.979 45.285.614 69.465.570 -24.179.956
Vacinas 521.950 0 521.950 16.291.344 2.588.973 13.702.371
Reag. diagnóstico 492.470 6.833.068 -6.340.598 623.650 10.153.832 -9.530.182 H emoderivados 615.718 7.434.775 -6.819.057 1.293.837 56.900.366 -55.606.529 M edicamentos 64.631.339 47.365.933 17.265.406 107.037.130 363.149.943 -256.112.813 Fármacos 12.967.354 4.193.547 8.773.807 123.924.556 364.390.100 -240.465.544
Outros produtos* 295.390 5.301.800 -5.006.410 136.052 940.473 -804.421
Total 110.813.794 92.859.770 17.954.024 393.234.207 980.864.399 -587.630.192
Segmentos Total
Exportação Importação Sal do
Equip./ materiais 289.361.733 785.332.379 -495.970.646 Ap. não eletrônicos 166.093 6.488.584 -6.322.491 Ap. eletrônicos 130.649.037 440.486.290 -309.837.253 Próteses/ órteses 15.287.012 75.288.716 -60.001.704 Mat. consumo 143.259.591 263.068.789 -119.809.198 Vacinas 17.713.678 143.838.777 -126.125.099 Reag. diagnóstico 4.355.022 214.331.372 -209.976.350 H emoderivados 4.443.326 270.065.878 -265.622.552 M edicamentos 233.361.936 1.142.322.134 -908.960.198 Fármacos 270.235.283 1.089.436.355 -819.201.072 Outros produtos* 2.695.149 48.780.708 -46.085.559
Total 822.166.127 3.694.107.603 -2.871.941.476
NAFTA: North American Free Trade Agreement
Fonte: Elaboração própria a partir de levantamento efetuado na Rede Alice (SECEX/MDIC). *Soros e Toxinas
Valores em US$ Free On Board
Tabela 2 - Balança comercial do complexo da saúde por bloco econômico. Brasil, 2004.