Abstract
Objectives: To assess the prevalence of respiratory disease in school-aged children and to determine the value of ield spirometry.
Methods: Data on 313 1st and 4th graders from four public schools in Lisbon were analyzed. A respiratory self-answered questionnaire and standard spirometry were performed. Descriptive and bivariate analysis was followed by multiple logistic regression.
Results: Thirty-ive percent of the children presented at least one episode of wheezing (18% ≥ 2 episodes), and 4% had asthma. Wheezing was more frequent with family history of atopy (adjusted OR = 2.7; 95%CI 1.4-5.1), maternal smoking during pregnancy, lower respiratory tract infection (LRTI) (adjusted OR = 2.8; 95%CI 1.2-6.2), bronchiolitis (adjusted OR = 3.3; 95%CI 1.3-8.2), and allergy to aeroallergens (adjusted OR = 3.2; 95%CI 1.4-7.2). Asthma was more frequent with previous history of LRTI (adjusted OR = 14.6; 95%CI 1.7-122.9) and allergy to aeroallergens (adjusted OR = 8.2; 95%CI 2.0-34.2). Fifty-ive percent of spirometry measurements met the acceptability criteria of the American Thoracic Society and of the European Respiratory Society. Wheezers presented mean lower z scores for forced expiratory volume in 1 second (FEV1), ratio between FEV1 and forced vital capacity (FVC) (FEV1/FVC), and forced expiratory low between 25 and 75% (FEF25-75) (p < 0.05), as well as higher percentage of abnormal FEV1, FEV1/FVC and FEF25-75 (FEF25-75, p < 0.05).
Conclusions: This pilot study showed a high prevalence of obstructive airway symptoms in school-aged children in Lisbon. Symptoms assessed by the questionnaire showed good correlation with spirometric values. The small prevalence of asthma leads us to speculate that asthma is under-diagnosed in this population.
J Pediatr (Rio J). 2011;87(2)123-130: Questionnaire, wheezing, asthma, portable spirometry.
O
RiginAlA
RtiCle Copyright © 2011 by Sociedade Brasileira de Pediatria123
introduction
Asthma and other wheezing disorders are among the
most frequent childhood diseases.1 Asthma is the leading
cause of childhood morbidity and the most common chronic disease in children2. Moreover, its prevalence has increased considerably worldwide in the last decades,
especially in western countries.2-5
Chronic obstructive pulmonary disease (COPD) remains an important public health problem. It is a major cause of chronic morbidity and mortality throughout the world, which
results in an increasing economic and social burden.6 The
World Health Organization estimates that COPD will be the
third main cause of death worldwide in 2030.6 Even though
Respiratory disease screening in school-aged children
using portable spirometry
Carolina Constant,1 isabel Sampaio,1 Filipa negreiro,2 Pedro Aguiar,3 Ana Margarida Silva,4 Marisa Salgueiro,4 teresa Bandeira5
1. Médica. Interna, Internato de Pediatria Médica, Serviço de Pediatria, Departamento da Criança e da Família, Clínica Universitária de Pediatria, Hospital de Santa Maria, Centro Hospitalar Lisboa Norte (CHLN), Lisboa, Portugal.
2. Senior statistician, Departamento de Bioestatística, Eurotrials, Lisboa, Portugal.
3. Consultor, Bioestatística e Epidemiologia, Departamento de Bioestatística, Eurotrials, Lisboa, Portugal.
4. Técnica cardiopneumologista, Serviço de Pediatria, Departamento da Criança e da Família, Clínica Universitária de Pediatria, Hospital de Santa Maria, CHLN, Lisboa, Portugal.
5. Médica. Assistente hospitalar, Pediatria, Serviço de Pediatria, Departamento da Criança e da Família, Clínica Universitária de Pediatria, Hospital de Santa Maria, CHLN, Lisboa, Portugal.
No conflicts of interest declared concerning the publication of this article.
Suggested citation: Constant C, Sampaio I, Negreiro F, Aguiar P, Silva AM, Salgueiro M, et al. Respiratory disease screening in school-aged children using portable spirometry. J Pediatr (Rio J). 2011;87(2):123-130.
the beneits of community-based spirometric screening
are still unclear,6 it is considered that some of the factors
implicated in adult COPD can and should be identiied and
prevented in childhood.7
Various longitudinal studies8-10 have contributed to
the identiication of risk factors associated with recurrent wheezing and asthma, enlightening the natural history of obstructive respiratory diseases. Nevertheless, the relationship between lung function in childhood and asthma or adult COPD remains uncertain. The most relevant implicated factors are viral infections, secondhand tobacco smoke exposure, and atopy, all with impact on the children’s
lung function.9-13
Children with viral-induced recurrent wheezing seem to
have an increased risk of chronic asthma in infancy.9,14-17
Viral infections can be an important environmental stimulus for the damage and remodeling of airways, resulting in
impaired lung function, and lastly, asthma.15
Pre and postnatal environmental tobacco smoke (ETS) exposure constitutes a determinant factor in respiratory morbidity and in early lung function reduction
in children.18-20 It has been shown that ETS exposure,
either in utero or postnatal, inluences the frequency of
respiratory symptoms,21,22 existing a dose-dependent
relationship between the dose of ETS (one or two smoking parents), the respiratory symptoms, and the spirometric
indices.18,19,23 However, no level of exposure to secondhand
smoke is safe.24
Finally, concerning the association between atopy and asthma, the data differ, depending on the region studied. Different studies have shown that atopy markers increase the risk of persistence of asthma in adults, while viral-induced
wheeze rarely persists beyond 12 years of age.8,10 Even
in the absence of respiratory symptoms, children of atopic parents and those with personal atopy have impaired lung function in early life.25
In pediatrics, the most used epidemiological questionnaire for detection of respiratory disease in children derives from the International Study of Asthma and Allergies in Childhood (ISAAC) questionnaire. Nevertheless, questions from ISAAC questionnaire are essentially directed to asthma and allergic disease, leaving out other frequent respiratory symptoms like cough and phlegm. Regarding the evaluation of lung function, laboratory-based spirometry is the “gold standard” for the assessment of lung function in
children, both in clinical and research protocols.26 Various
studies have shown that portable spirometers can provide measurements that are highly comparable to those obtained from laboratory spirometers, in several scenarios like
ofices27 or schools.28 In the setting of early detection of
chronic pulmonary disease in childhood, we aim to assess the ability of a survey adapted from the American Thoracic
Society (ATS) questionnaire29 and of ield spirometry to
diagnose respiratory disease in children.
Our main goal was to evaluate if the methodology adopted for early screening of COPD in adults can be used in children, i.e., to analyze the prevalence and risk factors for respiratory disease in school-aged children, based on the application of a broad respiratory questionnaire and on spirometry, and, secondly, to determine the value of ield spirometry.
Study design, population and methodology
An observational, cross-sectional study was done. The population was selected from a group of children attending the irst and forth school grades of four public basic schools located in the area of the Centro de Saúde do Lumiar. Parents gave written consent to the participation in the study, and the project was approved by the Ethics Committee of the Hospital de Santa Maria, Lisbon, and by the participating schools.
Clinical questionnaire
Parents answered a respiratory questionnaire in Portuguese adapted and translated from the ATS
questionnaire.29 The questionnaire includes socio-economic
and cultural history (parental education and occupation), environmental history (ETS exposure), and history of respiratory symptoms since birth. Parental occupation was classiied in nine categories, according to a national
classiication of professions30, and further grouped into
skilled jobs (categories 1-3) and less/unskilled jobs (categories 4-9). ETS exposure was deined as: smoking mother during pregnancy (ETS during pregnancy), smoking mother/father or ex-smokers after pregnancy (smoking mother/father), and living with smokers in the home (household smokers), including smokers in child’s bedroom.
Respiratory disease was deined by the presence of the symptoms cough and wheeze. Pathological cough (symptom cough) was considered if it occurred without respiratory infections, after exercise, and while the child played or laughed; and wheezing (symptom wheeze) if it occurred with or without respiratory infections, after exercise, while the child played or laughed, and if bronchodilator therapy was used for symptom relief. Asthma was considered if an afirmative answer was given to the following questions: “Has any doctor diagnosed your child with asthma?” and “Has your son/daughter ever had asthma?”
Anthropometric determination and lung function indices
index [BMI] > 95th percentile for age and sex31), we used the BMI growth charts built by the National Center for Health Statistics and by the Center for Disease and
Control and Prevention in 2000.32
All children underwent standard spirometry according to the guidelines published by the ATS and by the European Respiratory Society, in the school setting, using an apparatus with a digital volume transducer (MicroLab Spiro V1.34, Micro Medical Ltd). Three to ive measurements were obtained. The device records the best curve and registers the three best individual results according to standard procedures. The following parameters were registered:
forced expiratory volume in 1 second (FEV1), forced vital
capacity (FVC), ratio between FEV1 and FVC (FEV1/FVC),
and forced expiratory low between 25 and 75% of FVC (FEF25-75). Procedures were explained and exempliied by
a cardiopneumologist technician with speciic training in pediatrics. Children breathed through a mouthpiece, in sitting position, and nose clips were worn by those who tolerated it. The indices were obtained in the absence of recent bronchodilator use (in the previous 6 hours), and after an upper or lower respiratory infection in the previous 2 weeks was ruled out.
When interpreting the results, the individual spirograms were considered satisfactory if they showed satisfactory exhalation and were free from artifacts (cough or glottis closure), early termination or cut-off, and leak and/or obstructed mouthpiece. The spirometer was calibrated every morning following the manufacturer’s instructions. We visited the schools in June and September 2007. Afterwards, the spirograms were evaluated by two independent observers to determine acceptability according to published recommendations. For the acceptable curves, the absolute values were selected and a database was
assembled in MS Excel® (Microsoft, USA). Using the
reference values created at the Institute of Child Health
at University College London,33 the percentage predicted
value and z scores of the spirometric indices were automatically calculated. Z scores of spirometric values between -2 and +2 were considered normal.
Statistical analysis
Quantitative variables were described by mean, median, standard deviation, minimum and maximum. Qualitative variables were summarized in frequency/contingency tables as counts (n) and percentages (%). In cases when the responses had missing values, we classiied them as unknown. A descriptive analysis of all the variables relevant to the study was performed, namely socio-demographic characteristics, family history, environmental factors (ETS exposure), past medical history, occurrence of respiratory symptoms (cough and wheeze), asthma diagnosis, physical examination, and spirometric results.
A bivariate analysis was performed between some demographic data (gender, age, and ethnicity), school, family history, environmental factors, past medical history, and physical examination, and dependent variables, namely respiratory symptoms (cough and wheeze), asthma, and spirometric indices. Chi-square/exact Fisher tests (to assess the association between categorical variables) and t-Student/Mann-Whitney U tests (to compare a quantitative variable between two independent groups) were carried out. In this analysis, the spirometric results (z score for
FEV1, FEV1/FVC, and FEF25-75) were classiied as “normal”
if the values were within the normal range, and “abnormal” if outside that range, as described before.
A multiple regression analysis was then performed for the dependent variables related to respiratory symptoms (cough and wheeze) and to asthma, with the independent variables that showed clinically and/or statistically signiicant values in the bivariate analysis. The magnitude of the association with the dependent variables was quantiied using odds ratios (OR) and 95% conidence intervals (95%CI). The multiple regression models were tested by the likelihood ratio, and the model goodness of it was also evaluated using the Hosmer and Lemeshow test and area under the receiver operating characteristic (ROC) curve.
The association between respiratory symptoms (cough and wheeze), asthma, and spirometric indices was also analyzed. The spirometric results were considered as categorical and numerical (using the respective units of z score values).
All tests were two-sided, considering a signiicance level of 5%. The statistical analysis was done using Statistical
Package for Social Sciences® (SPSS Inc., Chicago, USA)
software, version 13.0 for Windows.
Results
Overall response rate to the questionnaires was 62% (313/509 children).
Demographic and social characteristics
n (%)* Unknown
Children Gender
Female 150 (48)
Male 163 (52)
Age
5-7 years 143 (45)
8-13 years 170 (54)
Children’s mothers
Median age, years (min-max) 37 (23-49) –
Median education, years (min-max) 12 (2-21) 23
Occupation 93
Groups 1-3 126 (57.2)
Groups 4-9 94 (42.7)
Children’s fathers
Median age, years (min-max) 39 (24-58) –
Median education, years (min-max) 12 (2-25) 50
Occupation 94
Groups 1-3 126 (57.5)
Groups 4-9 93 (42.5)
Respiratory symptoms/disease
Cough 64 (21) 7
Wheezing 104 (35) 14
Asthma diagnosis 11 (4) 7
table 1 - Demographic and social characteristics, respiratory symptoms, and asthma diagnosis (n = 313)
max = maximum; min = minimum.
* Data shown as absolute numbers and (percentages), unless otherwise specified. Family history
Allergy/atopy was present in at least one irst-degree relative (mother, father, sibling or half-sibling) in 72 children (24%, unknown: 13), rhinitis in 82 (27%, unknown: 11), asthma in 64 (21%, unknown: 12), and eczema in 41 children (14%, unknown: 13).
ETS exposure
We found 101 children exposed to ETS at home (34%), and 36 children usually exposed to ETS outside the home (12%) (unknown: 13 and 15 respectively). Moreover, 98 children had a smoking mother (32%, unknown: 4), 112 had a smoking father (38%, unknown: 14), and 57 were exposed to ETS during pregnancy (18%, unknown: 2).
Symptoms and past history
Children had on average one sibling, and the vast majority attended day care during infancy (n = 263, 96%, unknown: 39). Only one third of the children had pets at home (n = 99, 32%), 49 of whom had a dog (16%), and 20
had a cat (7%) (unknown: 4). There was a high prevalence of upper (43%) and lower respiratory tract infections (LRTI) (32%) in the past medical history (unknown: 15 and 9 respectively). Regarding previous symptoms of allergy/ atopy, 24 children had food allergy (8%, unknown: 6), 44 were allergic to aeroallergens (14%, unknown: 7), and 30 had eczema (10%, unknown: 13).
Cough during respiratory infections or rhinitis occurred in 222 children (72%, unknown: 6), cough without infections (pathologic cough) occurred in 64 children (21%), and wheezing in 104 children (35%) (53 children [18%] had ≥ 2 wheezing episodes). Asthma was considered in 11 children (4%), 5 of whom had had exacerbations in the past year, and 7 referred using regular treatment for their asthma (Table 1).
Lung function
Concerning the spirograms, 169 were considered acceptable (54%). Of these, 10 (6%) had lower than normal
Spirometric indices* n (%)† nA
Abnormal FEV1 10 (6) –
Abnormal FVC 7 (4) –
Abnormal FEV1/FVC 1 (0.6) –
Abnormal FEF25-75 7 (5) 21
FEF25-75 = forced expiratory flow between 25 and 75%; FEV1 = forced expiratory volume in 1 second; FEV1/FVC = ratio between forced expiratory volume in 1 second and forced vital capacity; FVC = forced vital capacity; NA = not acceptable.
* Abnormal is synonymous of reduced values (< -2 z scores). † Data are shown as absolute numbers and (percentages).
table 2 - Spirometric results (n = 169)
OR 95%Ci OR p
Cough
Smoking mother 2.15 1.15-4.03 0.017
Lower respiratory tract infection 2.62 1.40-4.90 0.003
Allergy to aeroallergens 4.43 2.15-9.14 < 0.001
Wheezing
Family history of allergy/atopy 2.68 1.40-5.14 0.003
Lower respiratory tract infection 2.78 1.24-6.20 0.012
Bronchiolitis 3.31 1.34-8.18 0.010
Allergy to aeroallergens 3.20 2.15-9.14 0.005
Asthma
Lower respiratory tract infection 14.65 1.75-122.88 0.013
Allergy to aeroallergens 8.17 1.95-34.20 0.004
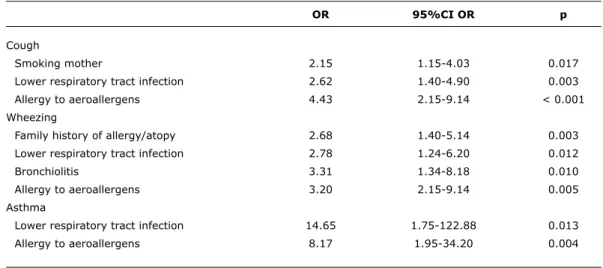
table 3 - Impact of the independent variables on the occurrence of respiratory symptoms (cough and wheeze) and on asthma diagnosis
95%CI = 95% confidence interval; OR = odds ratio.
7 (4%) had a low FVC z score (average: -0.06, range:
-2.91 to 3.40), 1 (0.6%) had a low z score for FEV1/FVC
(average: -0.10, range: -2.22 to 1.44), and 7 (5% of 148
acceptable spirographic curves) presented low FEF25-75 z
score (Table 2).
Multivariable statistical analysis
The multiple regression analysis showed that: 1) children whose mothers smoked were 2.1 times more likely to have cough than children with non-smoking mothers; 2) children with a family history of allergy/atopy and past history of bronchiolitis were respectively 2.7 and 3.3 times more likely to have wheezing than children without family history of allergy/atopy or past history of bronchiolitis; 3) children with LRTI were 2.6 times more likely to have cough, 2.8 times more likely to have wheezing, and 14.6 times more
likely to have an asthma diagnosis that children without LRTI in their past medical history; 4) children with a history of allergy to aeroallergens were 4.4 times more likely to have cough, 3.2 times more likely to have wheezing, and 8.2 times more likely to have asthma than children without allergy to aeroallergens (Table 3).
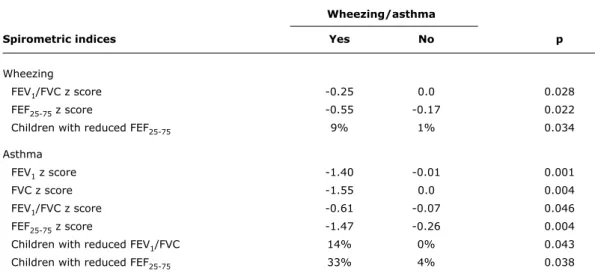
In the bivariate analysis between respiratory symptoms and spirometric indices, we found the following differences: 1) children with wheezing had lower average values of z
score for FEV1/FVC and FEF25-75 (-0.25 vs. 0, p = 0.028,
and -0.55 vs. -0.17, p = 0.022, respectively); 2) the
percentage of children with abnormal FEF25-75 z scores was
higher in the group of children with wheezing (9 vs. 1%, p = 0.034); 3) children with asthma had lower average
values of z score for FEV1, FVC, FEV1/FVC and FEF25-75 (-1.4
vs. -0.01, p = 0.001; -1.55 vs. 0, p = 0.004; -0.61 vs. -0.07, p = 0.046; and -1.47 vs. -0.26, p = 0.004, respectively);
and 4) the percentage of children with abnormal FEV1/FVC
and FEF25-75 z scores was higher in the group of children with
asthma (14 vs. 0%, p = 0.043, and 33 vs. 4%, p = 0.028, respectively) (Table 4).
The group of children with wheezing also presented on
average lower values of FEV1 and a higher percentage of
abnormal values for FEV1 and FEV1/FVC, but the differences
were not signiicant.
Discussion and conclusion
Wheezing/asthma
Spirometric indices Yes no p
Wheezing
FEV1/FVC z score -0.25 0.0 0.028
FEF25-75 z score -0.55 -0.17 0.022
Children with reduced FEF25-75 9% 1% 0.034
Asthma
FEV1 z score -1.40 -0.01 0.001
FVC z score -1.55 0.0 0.004
FEV1/FVC z score -0.61 -0.07 0.046
FEF25-75 z score -1.47 -0.26 0.004
Children with reduced FEV1/FVC 14% 0% 0.043
Children with reduced FEF25-75 33% 4% 0.038
table 4 - Bivariate analysis between wheezing, asthma diagnosis, and spirometric results (average z scores)
FEF25-75 = forced expiratory flow between 25 and 75%; FEV1 = forced expiratory volume in 1 second; FEV1/FVC = ratio between forced expiratory volume in 1 second and forced vital capacity; FVC = forced vital capacity.
Our response rate was similar to that reported by other studies using questionnaires published in the same
area of research,9,34,35 which strengthens the fact that
questionnaires are valid and reproducible tools for the investigation of respiratory disease in the community.
This study revealed a high frequency of respiratory symptoms in schoolchildren in our city, since 21 and 35%, respectively, of the study population reported having had cough or wheeze at sometime, even though only 4% had a diagnosis of asthma. The risk factors associated with the occurrence of symptoms were similar to what has been
described in the literature,8-10,14-22 namely family history
of allergy/atopy, ETS exposure, past history of LRTI, and allergy to aeroallergens. In our children, family history of allergy/atopy, past history of LRTI (and bronchiolitis), and allergy to aeroallergens were associated with an increased risk of having wheeze (OR between 2 and 3), and those with past history of LRTI and allergy to aeroallergens were 8 and 14 times more likely to have asthma, respectively.
Concerning lung function, although only slightly more than half the spirograms were considered acceptable, there was a good correlation between the questionnaire and the spirometry. Symptomatic children exhibited spirometric
lows compatible with impaired lung function, and FEF25-75
was one of the most sensitive parameter. The earliest change associated with airlow obstruction in small airways is thought to be a slowing in the terminal portion of the spirogram, even when the initial part of the spirogram is
barely affected.36 Quantitatively, this slowing of expiratory
low is relected in a proportionally greater reduction in FEF75%
or FEF25-75 than in FEV1.36 However, abnormalities in these
mid-range low measurements during a forced exhalation are
not speciic for small airway disease in individual patients36
and should be interpreted with caution. The absence of statistical signiicance for the remainder parameters might be explained by the low number of available spirograms.
On the other hand, children with asthma diagnosis had, on average, lower values for all parameters of spirometric
lows (FEV1, FVC, FEV1/FVC, and FEF25-75). These lower
levels of lung function, and the higher percentage of children
with reduced FEV1/FVC and FEF25-75, support indings that
have shown associations between the severity of asthma symptoms and the level of lung function that tracked over
time.8-10 We also speculate that asthma might be
under-diagnosed in this group of children, since one third of the children experienced wheezing (about 20% had ≥ 2 episodes of wheezing), but only 4% had an asthma diagnosis, which is less than what has been reported in the literature37; furthermore, wheezing children had some impairment of lung function.
Studies of respiratory disease prevalence with objective measures of lung function are crucial for the comprehension of the epidemiology of these illnesses. This will allow the implementation of directed treatment programs, with consequent reduction in associated morbidity and in direct (medication and use of health services) and indirect costs (school and work absenteeism). The longitudinal
References
1. Matricardi PM, Illi S, Grüber C, Keil T, Nickel R, Wahn U, et al.
Wheezing in childhood: incidence, longitudinal patterns and factors
predicting persistence. Eur Respir J 2008;32:585-92.
2. Global Initiative for Asthma (GINA). Global Strategy for the Diagnosis and Management of Asthma in Children 5 Years and Younger. 2009. www.ginasthma.org.
3. Global Initiative for Asthma (GINA). Global Strategy for Asthma Management and Prevention. 2008 Update. www.ginasthma.
org.
4. Burney PG, Luczynska C, Chinn S, Jarvis D. The European Community Respiratory Health Survey. Eur Respir J. 1994;7:954-60.
5. Asher MI, Keil U, Anderson HR, Beasley R, Crane J, Martinez F, et al. International Study of Asthma and Allergies in Childhood (ISAAC): rationale and methods. Eur Respir J. 1995;8:483-91. 6. Global Initiative for COPD. Global Strategy for the Diagnosis,
Management, and Prevention of COPD. 2008 update. www. goldcopd.org.
7. Bush A. COPD: A Pediatric Disease. COPD. 2008;5:53-67. 8. Phelan PD, Robertson CF, Olinsky A. The Melbourne asthma study:
1964-1999. J Allergy Clin Immunol. 2002;109:189-94. 9. Sears MR, Greene JM, Willan AR, Wiecek EM, Taylor DR, Flannery
EM, et al. A Longitudinal, Population-Based, Cohort Study of Childhood Asthma Followed to Adulthood. N Engl J Med. 2003;349:1414-22.
10. Taussig LM, Wright AL, Holberg CJ, Halonen M, Morgan WJ, Martinez FD. Tucson Children’s Respiratory Study: 1980 to present.J Allergy Clin Immunol. 2003;111:661-75.
11. Stein RT, Sherrill D, Morgan WJ, Holberg CJ, Halonen M, Taussing LM, et al. Respiratory syncytial virus in early life and risk of wheeze
and allergy by age 13 years. Lancet 1999;354:541-5.
12. Dezateux C, Stocks J, Wade AM, Dundas I, Fletcher ME. Airway function at one year: association with premorbid airway function, wheezing and maternal smoking. Thorax. 2001;56:680-6. 13. Dezateux C, Stocks J, Dundas I, Fletcher ME. Impaired airway
function and wheezing in infancy: the inluence of maternal smoking and a genetic predisposition to asthma. Am J Respir Crit
Care Med. 1999;159:403-10.
14. Lemanske RF Jr, Jackson DJ, Gangnon RE, Evans MD, Li Z, Shult PA, et al. Rhinovirus illnesses during infancy predict subsequent
childhood wheezing. J Allergy Clin Immunol. 2005;116:571-7.
15. Gern JE, Rosenthal LA, Sorkness RL, Lemanske RF Jr. Effects of
viral respiratory infections on lung development and childhood asthma. J Allergy Clin Immunol. 2005;115:668-74.
16. Holt PG, Sly PD. Interactions between RSV Infection, Asthma, and Atopy: Unraveling the Complexities. J Exp Med. 2002;196:1271-5.
description of distinct wheezing phenotypes that occur during childhood. One of these phenotypes, the group of children with transient early wheezing, had diminished lung function both in infancy and at 6 years of age when compared to children who never wheezed. The lung function of these children improved with time (lung function tracking), but never matched that of children who never wheezed during their growing years. The group of children with persistent wheezing showed a decline in lung function from infancy to 6 years, suggesting that the loss of respiratory function
happened after birth and persisted throughout life.10
Even though our study did not prospectively evaluate the respiratory health of children throughout time, in order to classify them into phenotypes, and it relied on parental recall and on report of respiratory events, it showed that the presence of known risk factors is associated with the occurrence of respiratory symptoms, and that their presence implicates some lung function disability. This screening tool can therefore potentially identify a cohort of children at increased risk of COPD, and consequently direct future interventions aiming at prevention of further damage.
Our study has also other limitations. First, response rate must always be maximized, in order to improve the design of an epidemiological study, to increase the sample size,
the power and precision of the results, and decrease bias.38
The amount of non-responders limits the extrapolation of the results, since this could bias our study towards the most symptomatic children. Different strategies have been suggested in order to improve response rates39,40; in our case, pre-notiication of parents, in loco explanation to the directors and school teachers, and recall of non-respondents are some examples. Secondly, we had no measures of airway inlammation (like measurement of fractional exhaled nitric oxide concentration) or evidence of allergic sensitization in our children, and we did not stratify our symptomatic cases as to the occurrence of symptoms in a speciic time window (the past year for instance). These measures would better stratify children with an active disease process, and perhaps determine a cohort requiring speciic treatment. They would also better classify our asthmatic population as to their disease control.
In conclusion, our screening tools proved to be easily implemented in a non-clinical setting and were effective in identifying symptomatic schoolchildren with lung function deicits. We described risk factors for pulmonary disease, which have been documented in countries other than Portugal. If this screening strategy will be cost-effective in preventing further lung function damage and progression to COPD remains to be elucidated.
Acknowledgments
Dr Cristina Bastardo for her support in the reading and evaluation of the spirograms, Pulmocor for loaning us the
spirometer, MSD (Dr Fátima Afonso) for her assistance in photocopying the questionnaires, the Scholar Health team from the Centro de Saúde do Lumiar, children, families, the schools’ teachers and directors (EB [Escola Básica] Alto da Faia, EB 57 Telheiras, EB 91 Bairro da Cruz Vermelha, EB31 Prof Lindley Cintra) for their collaboration.
17. Piipo-Savolainen E, Remes S, Kannisto S, Korhonrn K, Korppi M.
Asthma and lung function 20 years after wheezing in infancy: results from a prospective follow-up study.Arch Pediatr Adolesc Med. 2004;158:1070-6.
18. Strachan DP, Cook DG. Health effects of passive smoking. 1. Parental smoking and lower respiratory illness in infancy and
early childhood. Thorax. 1997;52:905-14.
19. Cook DG, Strachan DP. Health effects of passive smoking. 3.
Parental smoking and prevalence of respiratory symptoms and
asthma in school age children. Thorax. 1997;52:1081-94.
20. Strachan DP, Cook DG. Health effects of passive smoking. 6. Parental smoking and childhood asthma: longitudinal and
case-control studies. Thorax. 1998;53:204-12.
21. Gilliland FD, Li YF, Peters JM. Effects of maternal smoking during pregnancy and environmental tobacco smoke on
asthma and wheezing in children. Am J Respir Crit Care Med.
2001;163:429-36.
22. Jaakkola JJ, Jaakkola MS. Effects of environmental tobacco smoke on the respiratory health of children. Scand J Work Environ Health. 2002;28 suppl 2:71-83.
23. Bandeira T, Trindade JC. Origem na idade pediátrica da doença pulmonar obstrutiva crónica do adulto. Parte 1: indicadores de risco na evolução. Acta Pediatr Port. 2004;35:225-31.
24. Centers for Disease Control and Prevention (CDC). Disparities in secondhand smoke exposure - United States, 1988-1994 and 1999-2004. MMWR Morb Mortal Wkly Rep. 2008;57:744-7. 25. Lowe L, Murray CS, Custovic A, Simpson BM, Kissen PM, Woodcock
A; NAC Manchester Asthma and Allergy Study Group. Speciic airway resistance in 3-year-old children: a prospective cohort study.Lancet. 2002;359:1904-8.
26. Mortimer KM, Fallot A, Balmes JR, Tager IB. Evaluating the use
of a portable spirometer in a study of pediatric asthma. Chest.
2003;123:1899-907.
27. Zanconato S, Meneghelli G, Braga R, Zacchello F, Baraldi E. Ofice spirometry in primary care pediatrics: a pilot study. Pediatrics. 2005;116:e792-7.
28. Kirkby J, Welsh L, Lum S, Fawke J, Rowell V, Thomas S, et al. The
EPICure study: comparison of pediatric spirometry in community and laboratory settings.Pediatr Pulmonol. 2008;43:1233-41. 29. Ferris BG. Epidemiology Standardization Project (American Thoracic
Society). Am Rev Respir Dis. 1978;118:1-120
30. Cidade das Proissões (CdP). Classiicação Nacional das Proissões (CNP). http://cdp.portodigital.pt/profissoes/classificacao-nacional-das-proissoes-cnp. Access: 13/07/2008.
31. Fundação Bissaya Barreto. Obesidade Online (website). www. obesidade.online.pt. Access: 03/08/2008.
32. Centers for Disease Control and Prevention (website). http://www. cdc.gov/growthcharts. Access: 20/07/2008.
33. Institute of Children Health. Growth charts for lung function. www. growinglungs.org.uk. Access: 20/07/2008.
34. Strippoli MP, Silverman M, Michel G, Kuehni CE. A parent-completed respiratory questionnaire for 1-year-old children: repeatability.
Arch Dis Child. 2007;92:861-5.
35. Joseph CL, Baptist AP, Stringer S, Havstad S, Ownby DR, Johnson CC, et al. Identifying students with self-report of asthma and respiratory symptoms in an urban, high school setting. J Urban Health. 2007;84:60-9.
36. Pellegrino R, Viegi G, Brusasco V, Crapo RO, Burgos F, Casaburi R, et al. Interpretative strategies for lung function tests. Eur Respir J. 2005;26:948-68.
37. Nunes C. A epidemiologia das doenças alérgicas. Rev Port Imunoalerg. 2003;XI:169-99.
38. Sharp L, Cochran C, Cotton SC, Gray NM, Gallagher ME; TOMBOLA group. Enclosing a pen with a postal questionnaire can signiicantly
increase the response rate. J Clin Epidemiol. 2006;59:747-54.
39. Edwards PJ, Roberts I, Clarke MJ, Diguiseppi C, Wentz R, Kwan I, et al. Methods to increase response to postal and electronic
questionnaires. Cochrane Database Syst Rev. 2009:MR000008.
40. Nakash RA, Hutton JL, Jørstad-Stein EC, Gates S, Lamb SE.
Maximising response to postal questionnaires - a systematic review
of randomised trials in health research. BMC Med Res Methodol.
2006;6:5.
Correspondence: Carolina Constant