en 1980 5497 rbepid 20 s1 00034
Texto
Imagem
Documentos relacionados
Considering the speciic causes, the reduction of the standardized rate by age was more signiicant for rheumatic heart disease, ischemic cardiopathy, and cerebrovascular disease,
The analysis of the indicators organized by the analytical logic applied by GBD 2015 showed that the burden of cerebrovascular disease presented signiicant changes between 1990
ABSTRACT: Objective: To analyze mortality and years of life lost due to death or disability (disability-adjusted life years – DALYs) for interpersonal violence and
Burden of Disease (GBD) study, there was a decrease in the rates of death- or disability-ad- justed life years (DALYs), between 1990 and 2013, due to injuries from traic
Burden of disease by lower respiratory tract infections in Brazil, 1990 to 2015: estimates of the Global Burden of Disease 2015 study Carga de doença por infecções do
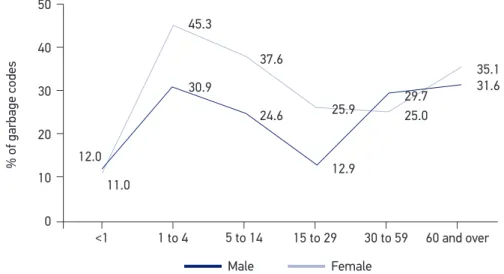
beyond obtaining data from formal systems such as the SIM. Various sources of data are uti- lized for reporting aggravated conditions and for theoretical statistical models,
Figure 2.. By 2015, MD were responsible for a high burden of disease throughout the world 10. MD jumped from eighth to sixth place between 1990 and 2015 in the DALY world
Adjusted mortality rates (A) years of life lost; (B) years lived with disability; (C) disability adjusted life years; (D) per 100,000 for dengue Global Burden of Disease
