NCAPG
is differentially expressed during longissimus muscle development
and is associated with growth traits in Chinese Qinchuan beef cattle
Yu Liu
1, Xiaoyan Duan
2, Si Chen
1, Hua He
1and Xiaolin Liu
11
College of Animal Science and Technology, Northwest A&F University, Yangling, Shaanxi, China.
2
HeBei North University, Zhang Jiakou, Hebei, China.
Abstract
Based on RNA-seq analysis, we recently found that the bovineNCAPG (non-SMC condensin I complex, subunit G) gene is differentially expressed during development of the longissimus muscle. In the present study, we validated this result and, using quantitative real-time PCR analysis, identified two adjacent genes, LCORL and DCAF16, that are more abundant in fetal muscle tissue; further analysis of tissue-specific expression patterns indicated high abun-dance ofNCAPG in muscle. Since no polymorphisms were detected in a previous study of Qinchuan cattle, we ex-tended our investigation to examine the occurrence of single-nucleotide polymorphisms (SNPs) in theNCAPG gene. Three SNPs,i.e., one located in the intron region (g47747: T > G), a synonymous mutation (g52535: A > G) and a missense mutation (g53208: T > G) that leads to a change in the amino acid of interest (pIle442Met), were detected in a population of Qinchuan beef cattle (n = 300). Association analysis showed that these SNPs were significantly as-sociated with the growth traits of Qinchuan beef cattle. Our results indicate that the bovineNCAPG gene may be in-volved in the development of the longissimus muscle. These polymorphisms in theNCAPG gene may be useful for marker-assisted selection of optimal body size in Qinchuan beef cattle.
Keywords: association analysis, growth traits, longissimus muscle, NCAPG expression, single nucleotide polymorphism. Received: October 10, 2014; Accepted: April 2, 2015
Introduction
Optimal body size has been intensively investigated in beef cattle breeding and is considered to be a trait of high economic importance (Littlejohnet al., 2011). Numerous genetic studies have sought to identify quantitative trait lo-cus (QTL) or major genes associated with body size-related characteristics, such as growth and carcass traits.
In a genome-wide association study, Snellinget al.
(2010) found a highly significant association between a chromosomal haplotype comprising the NCAPG (non-SMC condensin I complex, subunit G) gene and the body weight of cattle over time. The importance of the bovine
NCAPGgene had previously been suggested by Setoguchi
et al.(2009), who located a QTL for body or carcass weight in cattle (known as CW-2) in a 591-kb interval on bovine chromosome 6 (BTA6); they also identified a candidate causal variant in theNCAPGgene,NCAPG: c.1326T > G, responsible for the amino acid change p.Ile442Met. Addi-tional studies (Eberleinet al., 2009; Weikardet al., 2010) that investigated the association of the NCAPG: c.1326T > G mutation with birth weight and body weight confirmed the role of this gene locus as the CW-2 QTL.
These findings support the possibility thatNCAPG regu-lates muscle growth in cattle and thereby influences muscle performance.
Based on RNA-seq analysis, we recently found that the NCAPG gene and its neighboring gene,LCORL, are both differentially expressed in longissimus muscle of fetal and adult Chinese Qinchuan beef cattle (He and Liu, 2013). This raises the possibility that NCAPG regulates muscle growth and thus influences the performance of Qinchuan beef cattle, the best-known native cattle breed in China. In the present study, we sought to identify important single nucleotide polymorphisms (SNPs) of theNCAPGgene and use this information for haplotype construction and associ-ation analysis. This investigassoci-ation may contribute to our un-derstanding of the role thatNCAPGplays in the variation of cattle growth traits. Such knowledge could be relevant to improving beef cattle breeding practices in China.
Materials and Methods
NCAPGexpression patterns in cattle
Quantitative real-time polymerase chain reactions (qRT-PCR) were used to examine the expression levels of
NCAPGin heart, liver, spleen, lung and kidney samples from three adult Chinese Qinchuan cattle, and in longis-simus muscle samples from three embryos at day 135
DOI: http://dx.doi.org/10.1590/S1415-475738420140287
Send correspondence to Xiaolin Liu. College of Animal Science and Technology, Northwest A&F University, Yangling, 712100 Shaanxi, China. E-mail: liuxiaolin@nwsuaf.edu.cn.
post-fertilization and three 30-month-old female adult cat-tle; the expression levels ofLCORLandDCAF16in adult muscle samples were also examined. Tissue samples were obtained immediately after slaughter and were stored in liq-uid nitrogen until used. Total RNA was extracted with Trizol reagent (Ambion, USA). The quality (intactness) of the RNA was confirmed using a 2100 Bioanalyzer (Agilent, USA) and only samples with an RNA integrity number > 7 were used in subsequent analyses. One micro-gram of RNA from each sample was reverse-transcribed to cDNA using a PrimeScript RT reagent kit with gDNA Eraser (Takara, Japan). qRT-PCR was done with a CFX96 Real Time detection system (Bio-Rad) in triplicate using 2 SYBR® Premix ExTaqTM II (TaKaRa, Japan). The data derived from the real-time PCR analysis were transformed using the formula 2-DDCt (Livak and Schmittgen, 2001). For normalization, theGAPDHgene was used as an endog-enous control. The primers used for qRT-PCR analysis were designed using Primer 5 software (PREMIER Biosoft International) and are shown in Table S1.
DNA samples and phenotypic data
A pure-bred population of 300 Qinchuan beef cattle (30±2 months of age, bullocks) was used in this study to identify mutations in the bovineNCAPGgene. The cattle were from a single farm, reared under identical conditions and fed the same diet. The calves were weaned to six months of age on average and were then raised to slaughter on a diet of corn and corn silage.
Genomic DNA from the 300 Qinchuan cattle was iso-lated from 2% heparin-treated blood samples and stored at -80 °C as standard procedure (Sambrook and Russell, 2002). The DNA was diluted to 50 ng/mL in ddH2O and stored at -20 °C until further analysis.
The traits used to describe cattle body size were body height (BH, cm), body length (BL, cm), hip width (HW, cm), body weight (BW, kg) and carcass weight (CW, kg). Carcass weight was measured right after slaughter while the other parameters were measured right before slaughter. All of the traits were measured according to the GB/T17238-1998 criterion for the Cutting Standard of Fresh and Chilled Beef in China (China Standard Pub-lishing House). All of the experimental procedures were performed according to the terms of the authorization granted by the Chinese Ministry of Agriculture.
SNP detection and genotyping
DNA sequencing was used to identify sequence vari-ations in the NCAPG gene. Triplicate samples of DNA from each animal were used as the template to amplify the different regions ofNCAPG. The primers used for amplifi-cation of theNCAPGgene were designed from a published gene sequence (GenBank accession number: AC_000163.1) using Primer 5 software and are shown in Table S2. The PCR amplifications were done in a final
vol-ume of 15mL containing 50 ng of genomic DNA as the template and 10 mM Tris-HCl buffer (pH 8.8) with 50 mM KCl, 0.2mM of each primer, 200mM dNTP, and 0.5 U of
TaqDNA polymerase (MBI Fermentas, USA). The PCR conditions were as follows: after an initial denaturation for 5 min at 95 °C, the amplicons were generated using 35 cy-cles of 30 s at 94 °C, 30 s at an optimized annealing temper-ature (Table S2) and 45 s at 72 °C, and a 10 min final extension step at 72 °C. The products were sequenced in both directions using an ABI PRISM 3730 DNA analyzer (Sango, Shanghai, China). The sequences were analyzed using DNASTAR software (version 7.0).
PCR-RFLP and forced PCR-RFLP were used to ge-notype the cattle. The primer information and restriction enzymes (REs) are shown in Table S2. The PCR products were digested with their respective REs at distinct tempera-tures and the digested products were then separated by elec-trophoresis on 3% agarose gels.
Statistical analysis
The population genetic diversity parameters, includ-ing allele and genotype frequencies, effective number of al-leles (Ne), heterozygosity (He), homozygosity (Ho), Hardy-Weinberg equilibrium (HWE) and polymorphism information content (PIC) were estimated using Popgen32 software. The linkage disequilibrium (LD) structure of three loci, as measured by D’ and r2, was determined using HAPLOVIEW (Barrettet al., 2005; Huang et al., 2013). The PHASE program (Stephenset al., 2001) was used to calculate the individual haplotypes. General linear models (GLMs) were generated with SPSS software (ver. 16.0) to investigate the association of NCAPG mutations with growth and carcass traits (Holzer and Precht, 1992; Huang
et al., 2011) using the model: Yij =m+ ai + eij, where Yij is the trait value observed for animal j and genotype i,mis the overall population mean, ai corresponds to the fixed effect of genotype i, and eij is the residual error. A p value < 0.05 was considered to be significant. For a more detailed analy-sis of the results, we corrected the p values using the Bonferroni correction (a = 0.05/3) to account for multiple tests and obtain more robust comparisons.
Results
NCAPGexpression levels
Figure 1A shows the levels ofNCAPGgene expres-sion during development of the longissimus muscle as as-sessed using qRT-PCR.NCAPGwas up-regulated in fetal muscle compared with adult muscle. Among the various tissues screened,NCAPGexpression was greatest in mus-cle followed by liver; low expression was seen in other or-gans (heart, kidney, lung and spleen) (Figure 1B). As with
SNP detection and diversity analyses
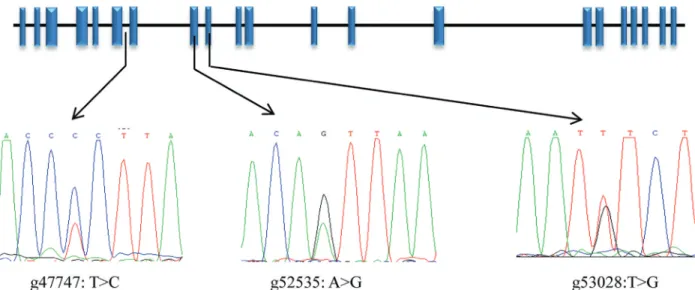
Three SNPs (g47747: T > C, g52535: A > G and g53208: T > G) were detected and are shown in Figure 2. The SNP g47747: T > C was located in intron six, g52535: A > G was a synonymous mutation located in exon eight, and g53208: T > G was a missense mutation leading to the amino acid change p.Ile442Met in the NCAPG protein.
The SNPs were successfully genotyped using PCR-RFLP and force PCR-PCR-RFLP, as shown in Figure S1. Dis-tinct genotypes were defined by disDis-tinct banding patterns. The individuals with g47747: T > C were genotyped using PCR-RFLP. Digestion of the resulting 495-bp PCR frag-ment ofNCAPG withEco81I resulted in fragments with band lengths of 302 and 193 bp for individuals with the CC homozygous genotype, 495, 302 and 193 bp for TC hetero-zygotes, and 495 bp for TT homozygotes. PCR-RFLP was also used to genotype the individuals with g52535: A > G. Digestion of the resulting 406-bp fragment withVspI re-sulted in fragment lengths of 296 and 110 bp for AA homo-zygotes, 406, 296 and 110 bp for TC heterohomo-zygotes, and 406 bp for TT homozygotes. Forced PCR-RFLP was used to genotype the individuals with g53208: T > G. Digestion of the resulting 141-bp fragment withXapIresulted in frag-ment lengths of 122 and 19 bp for TT homozygotes, 141, 122 and 19 bp for TG heterozygotes, and 141 bp for GG homozygotes.
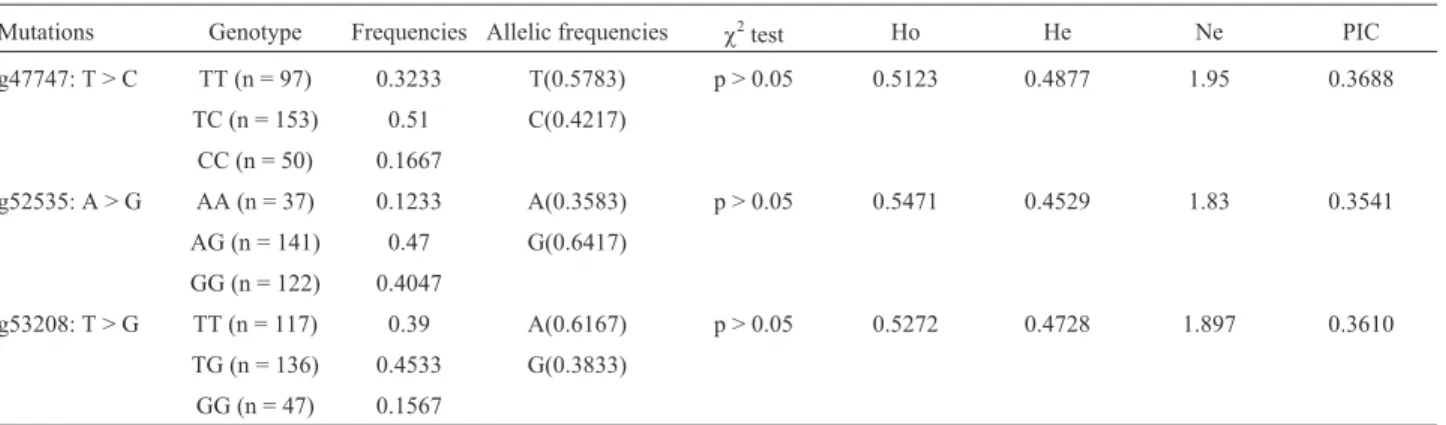
The allele and genotype frequencies and the genetic diversity parameters (Ho, He, Ne and PIC) of the three SNPs are shown in Table 1. The three loci identified in Qinchuan cattle were in Hardy-Weinberg equilibrium (p > 0.05). Our results suggest that Qinchuan cattle are in equilibrium with regard to artificial selection, migration and genetic drift. The PIC values ranged from 0.3541 to 0.3688, indicating an intermediate genetic diversity for the
NCAPGgene in the population analyzed.
Figure 1- A. Expression levels of theNCAPG,LCORLandDCAF16 genes in fetal and adult muscle tissue, B. Tissue-specific expression pat-terns of theNCAPGgene in adult cattle. The columns represent the means
±SEM (n = 3).
Linkage disequilibrium and haplotype analysis
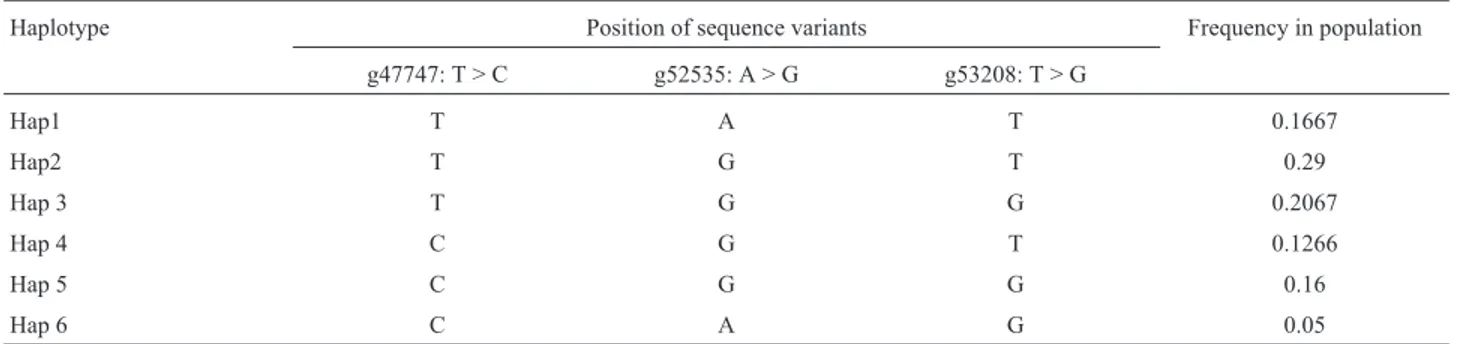
The linkage disequilibrium between the polymor-phism pairs and the haplotype structure of theNCAPGgene are summarized in Tables 2 and 3, respectively. The link-age disequilibrium between the three SNPs was expressed as D’ and r2using HAPLOVIEW. The values of D’ ranged from 0.184 to 0.323, and the r2values ranged from 0.017 to 0.05. These results indicated that the three SNPs were in low linkage disequilibrium. The haplotype structure analy-sis was done using PHASE. Six haplotypes were identified in the population. Hap11 (-TGT-) had the highest haplotype frequency (29%) and Hap12 (-CAG-) had the lowest haplo-type frequency (5%).
Association study
The association analysis focused mainly on the statis-tical correlation between genetic markers (SNPs) and traits (Botstein and Risch, 2003). In particular, we analyzed the associations of the three SNPs with growth traits in Qinchuan cattle. Table 4 summarizes the results of the asso-ciation analyses between individual markers and growth traits.
In agreement with our previous results for g47747: T > C, the animals with the TT genotype had longer bodies than those with the CC genotype (p < 0.05). In contrast, the analysis of g52535: A > G showed that individuals with the AA genotype tended to have longer bodies and heavier car-casses than those with the GG genotype (p < 0.05). The analysis of g53208: T > G revealed that individuals with ge-notype GG had significantly greater body length, hip width
and carcass weight compared with AA homozygote (p < 0.05); the association between g53208: T > G and body length remained significant after the Bonferroni correction, which suggested that this was the most important associa-tion detected in our analysis.
Discussion
The bovineNCAPGgene is located on chromosome BTA6 and has attracted much attention because of its effect on cattle growth traits. RNA-seq and qRT-PCR analyses have shown a high abundance of NCAPG transcripts in muscle compared to other tissues, with greater abundance in fetal compared to adult muscle. The greater expression of
NCAPGin fetal muscle suggests that this gene may play an important role in early muscle development. Metzgeret al.
(2013) investigated the relative expression levels of
LCORL and its two neighboring genes, NCAPG and
DCAF16, and demonstrated a significant association of the relative LCORL expression levels with horse size. Lindholm-Perryet al.(2014) also identified a relationship between NCAPG expression in LD (linkage disequilib-rium) muscle and average daily gain for cows. As shown here,NCAPG,LCORLandDCAF16were all expressed at low levels in adult muscle tissue. This finding suggests that
NCAPGexpression may be associated with the develop-ment of bovine muscle, although further research is re-quired to elucidate the causal mechanism.
Since we had previously identified no SNPs in the
LCORLgene of Qinchuan beef cattle, in the present study we focused on theNCAPGgene. Three SNPs were detected by sequencing: an intron mutation (g47747: T > C), a syn-onymous mutation (g52535: A > G) and a missense muta-tion (g53208: T > G) that leads to the amino acid change p.Ile442Met in theNCAPG protein. The ancestral popula-tion structure, which is reflected in the distribupopula-tion of haplotypes, can occasionally provide greater power than single-marker analysis for studying genetic diseases and trait associations (Akeyet al., 2001). As shown here, six
Table 1- Genetic diversity parameters for the SNPs detected in this study.
Mutations Genotype Frequencies Allelic frequencies c2test Ho He Ne PIC g47747: T > C TT (n = 97) 0.3233 T(0.5783) p > 0.05 0.5123 0.4877 1.95 0.3688
TC (n = 153) 0.51 C(0.4217)
CC (n = 50) 0.1667
g52535: A > G AA (n = 37) 0.1233 A(0.3583) p > 0.05 0.5471 0.4529 1.83 0.3541
AG (n = 141) 0.47 G(0.6417)
GG (n = 122) 0.4047
g53208: T > G TT (n = 117) 0.39 A(0.6167) p > 0.05 0.5272 0.4728 1.897 0.3610
TG (n = 136) 0.4533 G(0.3833)
GG (n = 47) 0.1567
He - gene heterozygosity, Ho - gene homozygosity, Ne - effective number of alleles, PIC - polymorphism information content.c2test: Hardy-Weinberg
equilibrium (HWE)c2value (p > 0.05 indicates equilibrium and p < 0.05 indicates disequilibrium).
Table 2- Linkage equilibrium parameters estimated for the threeNCAPG gene SNPs detected in this study.
SNP g47747:T > C g52535: A > G g53208: T > G
g47747:T > C D’ = 0.184 D’ = 0.217
g52535: A > G r2= 0.017 D’ = 0.323
haplotypes were present at varying frequencies. One expla-nation for this variation in haplotype frequency is that new mutants are derived from several common haplotypes and common high-frequency haplotypes have persisted in the population for a long time (Posada and Crandall, 2001).
In this study, meaningful associations were found be-tween SNPs and growth traits. Based on our statistical anal-ysis, individuals with the TT genotype at locus g47747: T > C, the AA genotype at locus g52535: A > G and the GG genotype at locus g53208: T > G could be selected to obtain the optimal body size. The SNPs g47747: T > C and g52535: A > G are silent mutations that do not change the amino acid composition of the expressed protein but are nonetheless associated with the growth traits of Qinchuan cattle. In agree with this, there have been several reports on the effects of silent mutations on cattle development. Three silent mutations of the bovineGL13 gene are associated with body weight at birth and at six months of age in Nanyang cattle (Huanget al., 2013). Silent mutations in the bovineINSIG1 gene have also been associated with growth traits in Qinchuan beef cattle (Liuet al., 2012). The
mecha-nism underlying the association between silent mutations and growth traits in beef cattle has yet to be determined.
The g53208: T > G SNP is a missense mutation that encodes a change from Ile to Met (p.Ile442Met). In a previ-ous study, Dejet al.(2004) found that theNCAPGgene en-codes a protein of the condensin I complex that has an important function in regulating mitotic cell division. Addi-tionally, Seipoldet al.(2009) previously reported that an
NCAPG mutation predominantly affects the highly pro-liferative progenitor cells of the zebrafish neural retina. This mutation in cattle may also participate in this biologi-cal process but its mechanism needs further research. Previ-ous investigations have focused on the association of this missense mutation with the phenotypic traits of cattle.
Weikardet al.(2010) found that this SNP inNCAPGwas associated with the time course of average daily gain in Jap-anese Black and Charolais German Holstein populations. Eberleinet al.(2009) found that this SNP was associated with birth weight in a Charolais German Holstein cross population. In our study, this missense mutation was signif-icantly associated with body length, hip width and carcass weight, a finding in general agreement with previous
re-Table 3- Haplotype frequencies for the threeNCAPGgene SNPs detected in Qinchuan beef cattle.
Haplotype Position of sequence variants Frequency in population
g47747: T > C g52535: A > G g53208: T > G
Hap1 T A T 0.1667
Hap2 T G T 0.29
Hap 3 T G G 0.2067
Hap 4 C G T 0.1266
Hap 5 C G G 0.16
Hap 6 C A G 0.05
Table 4- Effects ofNCAPGgenotypes on growth and carcass traits in Qinchuan beef cattle.
SNP Genotype N BH (cm) BL (cm) HW (cm) BW (kg) CW (kg)
g47747: T > C TT 97 141.26±3.575 154.143±3.913a 45.958±0.803 492.191±18.372 270.176±5.237 TC 153 138.74±2.534 148.217±2.927ab 47.344±0.568 493.761±16.282 265.161±6.957 CC 50 134.36±2.782 142.556±4.237b 46.571
±1.051 496.221±15.237 263.652±6.715
P1 0.287 0.039 0.278 0.397 0.161
g52535: A > G AA 37 141.528±3.846 151.417±4.231a 46.586±1.425 495.311±18.281 274.817±10.275a AG 141 136.832±2.455 146.694±3.238ab 47.254
±0.578 494.798±20.281 262.241±9.275b
GG 122 138.256±4.014 139.222±6.252b 46.856±0.693 498.061±15.291 266.245±5.275ab
P1 0.428 0.041 0.716 0.531 0.041
g53208: T > G TT 117 137.075±2.626 136.728±4.693b 44.676±1.412b 493.761±19.281 265.821±4.281b
TG 136 139.9814±3.128 150.871±6.236ab 46.187±0.842ab 505.761±15.169 269.981±5.298ab GG 47 141.265±4.134 156.297±3.551a 47.500±0.772a 497.216±20.285 278.138±8.151a
P1 0.875 0.017 0.036 0.415 0.031
ports. These results suggest that the g53208: T > G SNP is significantly associated with growth traits of numerous cat-tle breeds, although the mechanism underlying this rela-tionship requires further research. Interestingly, this SNP is significantly associated with body length, hip width and carcass weight, but not body weight. Nevertheless, the GG genotype tended to have a greater body weight than the TT genotype, although this difference may reflect the small sample size in our research. An association analysis with a larger sample group should yield more robust results.
In conclusion, the results of this study indicate a sig-nificant difference in the expression of the NCAPG,
LCORL and DCAF16 genes in fetal and adult bovine longissimus muscle, which suggests that they may be in-volved in muscle development. Three SNPs in NCAPG
were associated with bovine growth traits. Together, these findings suggest thatNCAPGgene polymorphisms could be potentially useful genetic markers for breeding pro-grams aimed at improving Qinchuan beef cattle. However, further studies are needed to establish the functional effects of the various alleles and the mechanisms involved. Such information will improve our understanding of the role of
NCAPGin the genetic regulation of cattle growth.
Acknowledgments
This research was supported by the National 12th “Five-Year” National Science and Technology Key Project (grant no. 2011AA100307), the National 11th “Five-Year” National Science and Technology Key Project (grant no. 2008AA101010), and the “13115” Sci-Tech Innovation Program of Shaanxi Province (grant no. 2008ZDKG-11).
References
Akey J, Jin L and Xiong MM (2001) Haplotypes vs single marker linkage disequilibrium tests: What do we gain? Eur J Hum Genet 9:291-300.
Barrett JC, Fry B, Maller J and Daly MJ (2005) Haploview: Anal-ysis and visualization of LD and haplotype maps. Bio-informatics 21:263-265.
Botstein D and Risch N (2003) Discovering genotypes underlying human phenotypes: Past successes for Mendelian disease, future approaches for complex disease. Nat Genet 33:228-237.
Dej KJ, Ahn C and Orr-Weaver TL (2004) Mutations in the
Drosophilacondensin subunit dCAP-G: Defining the role of condensin for chromosome condensation in mitosis and gene expression in interphase. Genetics 168:895-906. Eberlein A, Takasuga A, Setoguchi K, Pfuhl R, Flisikowski K,
Fries R, Klopp N, Furbass R, Weikard R and Kuhn C (2009) Dissection of genetic factors modulating fetal growth in cat-tle indicates a substantial role of the non-SMC condensin I complex, subunit G (NCAPG) gene. Genetics 183:951-964. He H and Liu XL (2013) Characterization of transcriptional
com-plexity during longissimus muscle development in bovines using high-throughput sequencing. PloS One 8:e64356.
Holzer C and Precht M (1992) Multiple comparison procedures for normally distributed ANOVA models in SAS, SPSS, BMDP and Minitab. Comput Stat Data Anal 13:351-358. Huang YZ, He H, Wang J, Li ZJ, Lan XY, Lei CZ, Zhang EP,
Zhang CL, Wang JQ, Shen QW,et al.(2011) Sequence vari-ants in the bovine nucleophosmin 1 gene, their linkage and their associations with body weight in native cattle breeds in China. Anim Genet 42:556-559.
Huang YZ, Wang KY, He H, Shen QW, Lei CZ, Lan XY, Zhang CL and Chen H (2013) Haplotype distribution in the GLI3 gene and their associations with growth traits in cattle. Gene 513:141-146.
Lindholm-Perry AK, Kuehn LA, Oliver WT, Sexten AK, Miles JR, Rempel LA and Freetly HC (2013) Adipose and muscle tissue gene expression of two genes (NCAPGandLCORL) located in a chromosomal region associated with cattle feed intake and gain. PloS One 8:e80882.
Littlejohn M, Grala T, Sanders K, Walker C, Waghorn G, Mac-donald K, Coppieters W, Georges M, Spelman R, Hillerton E,et al.(2012) Genetic variation in PLAG1 associates with early life body weight and peripubertal weight and growth in
Bos taurus. Anim Genet 43:591-594.
Liu Y, Liu XL, He H and Gu YL (2012) Four SNPs of insu-lin-induced gene 1 associated with growth and carcass traits in Qinchuan cattle in China. Genet Mol Res 11:1209-1216. Livak KJ and Schmittgen TD (2001) Analysis of relative gene
ex-pression data using real-time quantitative PCR and the 2-DDCt method. Methods 25:402-408.
Metzger J, Schrimpf R, Philipp U and Distl O (2013) Expression levels of LCORL are associated with body size in horses. PloS One 8:e56497.
Posada D and Crandall KA (2001) Intraspecific gene genealogies: Tree grafting into networks. Trends Ecol Evol 16:37-45. Sambrook J and Russell DW (2002) Molecular Cloning: A
Labo-ratory Manual. 3rd edition. Science Press, Beijing. Trans-lated by Huang Pei Tang.
Seipold S, Priller FC, Goldsmith P, Harris WA, Baier H and Abdelilah-Seyfried S (2009) Non-SMC condensin I com-plex proteins control chromosome segregation and survival of proliferating cells in the zebrafish neural retina. BMC Dev Biol 9:e40.
Setoguchi K, Furuta M, Hirano T, Nagao T, Watanabe T, Sugi-moto Y and Takasuga A (2009) Cross-breed comparisons identified a critical 591-kb region for bovine carcass weight QTL (CW-2) on chromosome 6 and the Ile-442-Met substi-tution in NCAPG as a positional candidate. BMC Genet 10:43.
Snelling WM, Allan MF, Keele JW, Kuehn LA, McDaneld T, Smith TPL, Sonstegard TS, Thallman RM and Bennett GL (2010) Genome-wide association study of growth in cross-bred beef cattle. J Anim Sci 88:837-848.
Stephens M, Smith NJ and Donnelly P (2001) A new statistical method for haplotype reconstruction from population data. Am J Hum Genet 68:978-989.
taurus growth and lipid deposition. Physiol Genom 42A:79-88.
Supplementary Material
The following online material is available for this article: Figure S1 - PCR-RFLP and force PCR-RFLP amplification products for theNCAPGgene.
Table S1 - Primers used for qRT-PCR.
Table S2 - Primer sequences and PCR conditions used for amplifications and RFLP analysis.
This material is available as part of the online version of this article from http://scielo.br/gmb.
Associate Editor: Alexandre R. Caetano