Elena Valeria Girlus
Degree in Biochemistry
Protective activity of phytochemicals
from natural extracts
Dissertation to obtain a Master Degree in Biochemistry for Health
Supervisor: Regina Menezes Echaniz, Ph.D, IBET/ITQB-UNL
Co-Supervisor: Ana Alexandra Figueiredo Matias, Ph.D, IBET/ITQB-UNL
Elena Valeria Girlus
Degree in Biochemistry
Protective activity of phytochemicals
from natural extracts
Dissertation to obtain a Master Degree in Biochemistry for Health
Supervisor: Regina Menezes Echaniz, Ph.D, IBET/ITQB-UNL
Co-Supervisor: Ana Alexandra Figueiredo Matias, Ph.D, IBET/ITQB-UNL
Júri:
Presidente: Doutor Pedro Matias Arguente: Doutora Margarida Archer Vogal: Doutora Anabela Raymundo
ITQB
Protective activity of phytochemicals from natural extracts
Copyright Elena Girlus, ITQB/UNL, UNL
I
Acknowledgments
Quero agradecer a todas as pessoas do laboratório de Disease and Stress Biology e do laboratório
Nutraceuticals and Delivery, em especial à Dra. Regina Menezes, Dra. Cláudia Santos, Dra. Ana Matias e Dra. Catarina Duarte, por me terem dado a oportunidade de trabalhar nos dois grupos, e pelo apoio e disponibilidade ao longo destes meses. Obrigada por me incentivarem em continuar pois sem isso não teria conseguido chegar até aqui, e obrigada por todas as vezes em que me disseram que vai correr bem quando estava desanimada, foi muito importante ouvir isso!
Muito obrigada à Carolina Jardim, Inês Costa e Gonçalo Garcia que me acompanharam mais de perto e que me ajudaram a conseguir acabar este trabalho, obrigada mesmo. Carolina obrigada por teres puxado por mim e por todos os conselhos! Muito obrigada pelo apoio e amizade Inês Figueira, Andreia Gomes, Diana Macedo, Joel Guerra, Joana Pereira, Ana Margarida Nunes, Sónia Moita.
Muito obrigada à Ana Nunes por me ter acompanhado e por me ter introduzido aos conhecimentos e métodos para eu avançar com o meu trabalho, e a todas as pessoas do laboratório, Joana Poejo, Inês Silva, Agostinho Alexandre, Liliana Rodrigues, Daniel Lopes, Vanessa Gonçalves, Cátia Carmo, Catarina Maia pela disponibilidade em me esclarecerem as dúvidas que foram surgindo ao longo do trabalho. Obrigada também à Dra. Rosário Bronze, à Elsa e Andreia pela disponibilidade em analisar as minhas amostras.
Tive um enorme prazer em conhecer-vos e poder trabalhar com vocês. Obrigada por tudo!
Obrigada Tiago Matos, Francisco Oliveira e André Preto pela vossa amizade, por me darem força para continuar e por todos os momentos de descontração. Obrigada por estares ao meu lado e por todo o apoio que me tens dado Luís Batalha!
III
Abstract
The rise in the incidence of neurodegenerative diseases leads to an increased demand for the
development of alternative therapeutic strategies. Phytochemicals have proved beneficial effects for
human health, exerting protective roles towards several diseases including neurodegenerative disorders.
Thus, the search for new bioactivities is a field in constant growth. The beet and fruits belonging to
Opuntia spp. are rich in betalains and phenolic compounds, which confer several benefits to human
health such as regulators of antioxidant and anti-inflammatory responses as well as potential protective
effect for chronic diseases.
The objectives of this study were the optimization of solid-liquid extractions of beets, purple and yellow
fruits of Opuntia spp. in order to obtain extracts enriched in betalains (betacyanins and betaxanthinas)
and (poly)phenols. The beetroot purified fraction was selected as the matrix displaying higher contents
of betalains and (poly)phenols, and bioactivities for key processes associated with neurodegenerative
diseases (Parkinson's disease, Amyotrophic Lateral Sclerosis, Huntington's and Alzheimer's) were
assessed using humanized yeast models. As chronic inflammation is a common pathological process
associated with neurodegeneration, the potential anti-inflammatory properties of the beetroot purified
fraction were also evaluated using a yeast model Crz1/NFAT activation. Although the beetroot
phytochemicals did not reveal significant protective activities for amyloidogenic processes associated
with these diseases, they showed a potential anti-inflammatory activity as revealed by the great potential
to attenuate Crz1/NFAT activation. The most abundant compound present in beet extract, betanin (pure
standard), was used to infer whether the potential of the beetroot purified fraction to modulate
Crz1/NFAT activation was associated with betalains compounds, revealing that was not the case.
Possibly, the phenolic compounds present in this fraction exert the potential anti-inflammatory effects
observed or maybe the synergistic action between betalains and (poly)phenols are in the ground of the
bioactivity displayed by the beetroot phytochemicals.
V
Resumo
O aumento na incidência de doenças neurodegenerativas tem levado a um aumento da demanda para o
desenvolvimento de estratégias terapêuticas alternativas. Os fitoquímicos têm revelado efeitos
benéficos para a saúde humana, exercendo funções de proteção para várias doenças, incluindo doenças
neurodegenerativas. Assim, a procura de novas bioatividades é um campo em crescimento constante.
A beterraba e frutos pertencentes a Opuntia spp. são ricos em compostos fenólicos e betalaínas, os quais
conferem vários benefícios para a saúde humana, tais como a regulação de respostas antioxidantes e
anti-inflamatórias, assim como efeitos protetores potenciais para doenças crónicas.
Os objetivos deste estudo foram a otimização da extração sólido-líquido de beterraba, frutos roxos e
amarelos de Opuntia spp. de modo a obter extratos enriquecidos em betalaínas (betacianinas e
betaxantinas) e (poli)fenóis. A fração purificada de beterraba foi selecionada como a matriz exibindo
teores de betalaínas e (poli)fenóis mais elevados. As bioatividades desta matriz para processos-chave
associadas a doenças neurodegenerativas (doença de Parkinson, Esclerose Lateral Amiotrófica,
Huntington e Alzheimer) foram avaliadas utilizando modelos humanizados de levedura. Como a
inflamação crónica é um processo patológico comum associado à neurodegeneração, as potenciais
propriedades anti-inflamatórias da fração de beterraba purificada foram também avaliadas usando um
modelo de levedura de ativação do fator de transcrição Crz1/NFAT. Embora os fitoquímicos da
beterraba não tenham revelado atividades de proteção significativas para processos amiloidogénicos
associados a estas doenças, eles mostraram uma potencial atividade anti-inflamatória conforme
revelado pelo grande potencial para atenuar a ativação Crz1/NFAT. O composto mais abundante
presente no extrato de beterraba, betanina (padrão puro), foi usado para inferir se o potencial da fração
de beterraba purificada para modular a ativação Crz1/NFAT estava associado às betalaínas, revelando
que este não era o caso. Possivelmente, os compostos fenólicos presentes nesta fração exercem os
efeitos protetores observados ou talvez a ação sinérgica entre betalaínas e (poli)fenóis estejam na base
das propriedades protetoras exibidas pelos fitoquímicos da beterraba.
Palavras-chave: Extratos naturais, Betalaínas, (Poli)fenóis, Neuroprotecção, Atividade
VII
Index Page
1) Introduction ……….. 1
1.1) Phytochemicals ……… 1
1.2) Beetroot (Beta vulgaris)……… 4
1.3) Opuntia spp. fruits ……… 5
1.4) Neurodegenerative diseases ………. 6
1.5) Inflammation ……… 7
1.6) Yeast as a discovery platform for therapeutic compounds ………... 9
1.7) Objectives ………... 10
2) Materials and Methods ………... 11
2.1) Samples and extracts preparation ……… 11
2.2) Solid Phase Extraction (SPE) ……….. 13
2.3) Extracts characterization ……… 13
2.3.1) Betalain determination ……….. 13
2.3.2) Total phenolic content (TPC) determination ………. 14
2.3.3) Oxygen radical absorbance capacity (ORAC) ……….. 14
2.4) Sucrose, D-fructose and D-glucose assay procedure ……….. 15
2.5) Strains and plasmids ………... 15
2.6) Yeast media and reagents ……… 16
2.7) Growth conditions ……….. 16
2.8) Growth curves ……… 17
2.9) β-galactosidase assays ………... 17
2.10) Statistical analyses ……… 18
3) Results and Discussion ……… 19
3.1) Extracts chemical characterization ………. 19
3.1.1) Betalain (betacyanins and betaxanthins) determination ……… 19
3.1.1.1) Beetroot extracts ……….. 19
3.1.1.2) Opuntia spp. purpleand yellowextracts ………. 20
3.1.2) Total Phenolic Content (TPC) ……….. 22
3.1.3) Oxygen Radical Absorbance Capacity (ORAC) ………... 23
3.2) Solid Phase Extraction (SPE) – Purification of beetroot extract ………. 24
3.3) Bioactivity of beetroot phytochemicals ……….. 26
3.3.1) Toxicity assays ……….. 27
3.3.2) Evaluation of the protective potential of beetroot purified fraction ……….. 31
VIII
4) Conclusion ………... 37
IX
Index of figures
Figure 1.1 Page 1 Major phytochemicals present in fruits and vegetables.
Figure 1.2 Page 3 General structures of betalamic acid, betacyanins and betaxanthins, from
left to right. R1= R2 = H; R3 = amine or amino acid group.
Figure 1.3 Page 5 Beetroot and Opuntia spp. fruits. The left image shows red beetroot and
the two images on the right show Opuntia spp. fruits, purple and yellow,
respectively.
Figure 1.4 Page 8 Schematic representation of the cellular pathway leading to NFAT
activation in mammalian cells.
Figure 1.5 Page 9 Illustration of the main cellular pathways relevant for neurodegeneration,
which are conserved between yeast and human.
Figure 2.1 Page 12 Schematic representation of the procedures used for beetroot solid-liquid
extractions.
Figure 2.2 Page 13 Schematic representation of the procedures used for purple and yellow
Opuntia spp. fruits solid-liquid extraction.
Figure 3.1 Page 22 Total phenolic content, assessed by Folin-Ciocalteu method, for beetroot
extract (pH 5, ratio 1:10, 60 ºC, 84 min) and Opuntia spp. extracts using
purple fruits (pH 6.9, ratio 1:193, 42 ºC, 115 min) and yellow (pH 6.9, ratio 1:10, 60 ºC, 84 min). Values are presented as mean ± standard deviation (SD) from three replicates.
Figure 3.2 Page 23 Antioxidant activity, assessed by Oxygen Radical Absorbance Capacity
(ORAC) method, for beetroot extract (pH 5, ratio 1:10, 60 ºC, 84 min)
and yellow Opuntia spp. extracts (pH 6.9, ratio 1:10, 60 ºC, 84
min).Values are presented as mean ± standard deviation (SD) from three replicates.
Figure 3.3 Page 25 D-glucose, D-fructose and Sucrose content of the beetroot extract and the
SPE fractions of the extract.
Figure 3.4 Page 26 Betalain - betacyanins (BX) and betaxanthins (BX) - and total phenolic
content (TPC) of beetroot extract fractions 1 to 6 obtained by using solid phase extraction (C-18 resin). Values are presented as mean ± standard deviation (SD) from two replicates.
Figure 3.5 Page 27 Representative growth curves of a yeast disease model and cells in the
presence of glucose or galactose. Pre-cultures grown in raffinose were
diluted in glucose or galactose media and growth was monitored at OD600
each 1 h for up to 24 h.
Figure 3.6 Page 28 Representative growth curves of control yeast cells grown in galactose
media supplemented with different concentrations of beetroot total extracts (0.4 to 25%, v/v). Pre-cultures grown in raffinose were diluted in
galactose media and growth was monitored at OD600 each 1 h for up to 24
X
Figure 3.7 Page 30 Growth curves of PD control cells grown in galactose media
supplemented with different concentrations of beetroot purified fraction (3.1 to 50%, v/v). Pre-cultures grown in raffinose were diluted in
galactose media and growth was monitored at OD600 each 1 h for up to 24
h. Values are presented as mean ± SD of at least three replicates.
Figure 3.8 Page 30 Growth curves of ALS control cells grown in galactose media
supplemented with different concentrations of beetroot purified fraction (3.1 to 50%, v/v). Pre-cultures grown in raffinose were diluted in
galactose media and growth was monitored at OD600 each 1 h for up to 24
h. Values are presented as mean ± SD of at least three replicates.
Figure 3.9 Page 31 Growth curves of HD/AD control cells grown in galactose media
supplemented with different concentrations of beetroot purified fraction (0.8 to 12.5%, v/v). Pre-cultures grown in raffinose were diluted in
galactose media and growth was monitored at OD600 each 1 h for up to 24
h. Values are presented as mean ± SD of at least three replicates.
Figure 3.10 Page 32 Growth curves of PD model and control cells grown in galactose media
supplemented with 3.1% and 6.25% of beetroot purified fraction. Pre-cultures grown in raffinose were diluted in galactose media and growth
was monitored at OD600 each 1 h for up to 24 h. Values are presented as
mean ± SD of at least three replicates.
Figure 3.11 Page 32 Growth curves of ALS model and control cells grown in galactose media
supplemented with 3.1% and 6.25% of beetroot purified fraction. Pre-cultures grown in raffinose were diluted in galactose media and growth
was monitored at OD600 each 1 h for up to 24 h. Values are presented as
mean ± SD of at least three replicates.
Figure 3.12 Page 33 Growth curves of HD model and control cells grown in galactose media
supplemented with 1.6% and 3.1% of beetroot purified fraction. Pre-cultures grown in raffinose were diluted in galactose media and growth
was monitored at OD600 each 1 h for up to 24 h. Values are presented as
mean ± SD of at least three replicates.
Figure 3.13 Page 33 Growth curves of AD model and control cells grown in galactose media
supplemented with 1.6% and 3.1% of beetroot purified fraction. Pre-cultures grown in raffinose were diluted in galactose media and growth
was monitored at OD600 each 1 h for up to 24 h. Values are presented as
mean ± SD of at least three replicates.
Figure 3.14 Page 35 Modulation of Crz1 activity by beetroot phytochemicals. Pre-cultures
grown in glucose were diluted in fresh media supplemented or not with beetroot purified fraction (0.06 % to 6.25%, v/v). Crz1 activity was
induced with 3 mM MnCl2 and FK506, at a final concentration of 10
µg.mL-1, was used as a positive control. Quantitative β-galactosidase
assays were performed as described and values are given in Miller units. Values are presented as mean ± SD of at least three replicates. p *** <
XI
Figure 3.15 Page 36 Modulation of Crz1 activity by beetroot phytochemicals. Pre-cultures
grown in glucose were diluted in fresh media supplemented or not with beetroot purified fraction (0.06 % to 6.25%, v/v). Crz1 activity was
induced with 3 mM MnCl2 and FK506, at a final concentration of 10
µg.mL-1, was used as a positive control. Quantitative β-galactosidase
XIII
Index of tables
Table 1.1 Page 4 Major phenolic compounds and their sources.
Table 3.1 Page 19 Betalain determination of beetroot extracts, at different pH (3, 5, 7 and 7.1),
matrix/solvent ratios (1:311, 1.5:50 and 1:10), extraction at 60 ºC for 84 min. Values are presented as mean ± standard deviation (SD) from three replicates.
Table 3.2 Page 20 Betalain determination of purple Opuntia spp. extracts at different pH (5 and
6.9), matrix/solvent ratio of 1:193, extraction at 42 ºC for 84 and 115 min. Values are presented as mean ± standard deviation (SD) from three replicates.
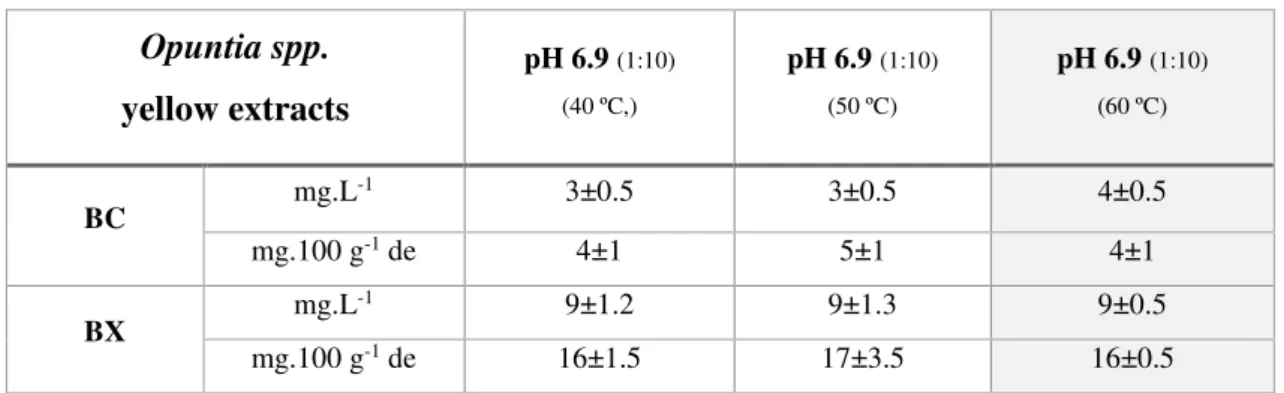
Table 3.3 Page 21 Betalain determination of yellow Opuntia spp. extracts at pH 6.9, 1:10
matrix/solvent ratio, extraction at 40 ºC, 50 ºC and 60 ºC for 84 min. Values are presented as mean ± standard deviation (SD) from three replicates.
Table 3.4 Page 24 Summary of the content in betacyanins, betaxanthins, (poly)phenols (TPC)
and antioxidant activity (ORAC) obtained for the beetroot extract.
Table 3.5 Page 28 Concentration of betacyanins, betaxanthins and (poly)phenols (TPC) for
each percentage (0.4 to 25%, v/v) of beetroot extract.
Table 3.6 Page 29 Concentration of betacyanins, betaxanthins and (poly)phenols (TPC) for
each percentage (0.8 to 50%, v/v) of beetroot purified fraction.
Table 3.7 Page 34 Concentration of betacyanins, betaxanthins and (poly)phenols (TPC) for
each percentage (0.06 to 6.25%, v/v) of beetroot purified fraction.
Table 3.8 Page 35 Concentration of betanin standard (in terms of µg.mL-1 betacyanins - BC) for
XV
List of abbreviations, acronyms and symbols
Aβ42 Beta amyloid protein
AD Alzheimer´s Disease
ALS Amyotrophic Lateral Sclerosis Disease
APPH 2`, 2`-Azobis (2-amidinopropane) dihydrochloride
BC Betacyanins
BX Betaxanthins
CDRE Calcineurin-dependent response element
C2H3N
CH3COOH
Acetonitrile
Acetic acid
CH2O2 Formic acid
CH4O
Crz1
Methanol
Calcineurin-responsive zinc finger
CSM Complete Synthetic Mixture
Cyclo-DOPA Cyclo-3, 4-dihydroxyphenylalanine
EGCG
FDA
Epigallocatechine-gallate
Food and Drug Administration
FL Disodium fluorescein
FUS Fused in sarcoma DNA-binding protein
FK506 Tacrolimus
GAE Gallic Acid Equivalents
h Hours
HCl
HD
Hydrochloric acid
Huntington´s Disease
H2O Water
H2O2 Hydrogen peroxide
Htt Huntingtin protein
KCl Potassium chloride
KH2PO4 Monopotassium phosphate
min Minutes
MgSO4.7H2O Magnesium Sulfate Heptahydrate
MnCl2 Manganese chloride
Na2CO3 Sodium carbonate
NaCl Sodium chloride
NaH2PO4.H2O Sodium phosphate monobasic monohydrate
XVI
NFAT Nuclear Factor of Activated T-cells
OD Optical Density
ONPG Ortho-Nitrophenyl-β-galactoside
ORAC Oxygen Radical Absorbance Capacity
PBS Phosphate Buffer Solution
PD Parkinson´s Disease
spp. Species
SPE Solid Phase Extraction
TE Trolox Equivalents
TPC Total Phenolic Content
Trolox 6-Hydroxy-2,5,7,8-tetramethylchroman-2-carboxylic acid
YNB Yeast Nitrogen Base
1
1) Introduction
1.1) Phytochemicals
Phytochemicals are natural compounds found in plants, and may present bioactivity. They can be found
in fruits, vegetables and also grains. Although a large number of these chemical compounds have been
identified so far, many are still unknown and need to be identified (Angel Nivya et al. 2012). The main
phytochemicals occurring in plants (figure 1.1) consumed by humans as foods, are phenolics,
carotenoids, alkaloids, organosulfur compounds, as well as nitrogen containing compounds. Among
these, carotenoids and anthocyanins have been more extensively studied, however, in the last years
there has been also a growing interest in studying nitrogen-containing compounds such as betalains
(Iriti et al. 2010).
Bioactive compound family Primary source in fruits and vegetables
Terpenoids
Carotenoids Leafy vegetables, red and yellow fruits and vegetables
Monoterpenes Citrus, cherries, mint and herbs
Saponins Alliaceae, asparagus
Apocarotenoids Fruits
Polyphenols
Phenolic acids Small fruits, apples, fruit and vegetables
Hydrolysable tannins Fruit and vegetables, pomegrenate, raspberry
Stylbenes Grapes, small fruits
Proanthocyanidins Fruit and vegetables, cacao, small fruits, cranberry, blueberry
Monophenolic alcohols tyrosol Olive oil, wine
Organo sulphur compounds
Glucosinolates Brassicaceae
γ-Glutamyl cysteine sulphoxides Alliaceae
Alkaloids
Capsaicin Chili Pepper
Betalain Red Beet, Prickly pear, Pittaya
Figure 1.1– Major phytochemicals present in fruits and vegetables (Dixon & Aldous 2014).
The growing interest in plant sources rich in phytochemicals, which are natural products with potential
health benefits for humans, made necessary a clear description and classification of these compounds.
In 1989, the Foundation for Innovation in Medicine (New York, US) created the term ´nutraceutical´.
Although the definition of the term is in some way questioned, the idea behind the concept is to define
substances from foods that have been identified as displaying a medicinal effect on human health
2
Traditional medicine, in other words, the use of plants (leaves, stems, roots, flowers, fruits and seeds),
has been used to treat the symptoms associated with various disorders for thousands of years. They
mostly contain a mixture of compounds, and although their evident biological activity, is often difficult
to know which compound/s confers the plant its beneficial effect on human health. The reported
health-promoting benefits of phytochemicals include protective action against cardiovascular diseases, type 2
diabetes, cancer, neurological decline and metabolic diseases (Chaalal et al. 2013; Tiwari & Cummins
2013; Rao 2003). These protective effects of phytochemicals are mainly related to their antioxidant
properties, reducing the oxidative damage associated with these diseases (Shebis et al. 2013), as well
as their capacity to modulate the immune system (Rao 2003). However, the precise mechanism(s) of
action of these compounds has not yet been fully elucidated due to difficulties in isolating the protective
compounds. Moreover, this task becomes even more challenging considering that the potential
protective activities may result from the synergistic or additive action of several compounds.
Betalains
Many phytochemicals are pigments absorbing light in the visible region, thus humans have used them
since earliest times for food and cloth coloring (Jiménez 2014). Nowadays, these products are mostly
colored with synthetic colorants, consequently, there has been a growing concern about their safety and
possible adverse effects on human health. So, attending to the consumer´s request, the attention of the
scientific research has been directed toward the discovery and isolation of natural pigments.
Nevertheless, the use of natural pigments as food additives is very limited because of the strict
regulations that need approval by the European Union and the U.S. Food and Drug Administration
(FDA) (Delgado-Vargas et al. 2000). Since natural pigments became the focus, also because of their
use as part of foods with potential health effects, the research area focusing these compounds has been
growing in the last decades, being betalains one relevant class of natural pigments.
In 1968, Mabry and Dreiding introduced the term betalains. This class of compounds currently includes
more than 50 molecules, which has aroused a great interest in the last decade (Delgado-Vargas et al.
2000). Betalains are water-soluble nitrogen-containing pigments, which accumulate in the vacuoles of
cells, where they are synthesized. They are predominant in plants of the order Caryophyllales, they can
be found in leaves, stems, seeds, bracts and flowers, and also in some higher fungi (Gandía-Herrero et
al. 2014). A few edible sources containing these compounds are red and yellow beetroot (Beta vulgaris
ssp. vulgaris), Swiss chard (Beta vulgaris ssp. cicla), amaranth (Amaranthus sp.) and cactus fruits of
Opuntia and Hylocereus genera (Agrawal 2013). Betalains present a broad spectrum of colors (yellow-violet), and are often difficult to distinguish from the red-purple pigments anthocyanins. The two
pigments are structurally distinct and mutually exclusive in the same plant. Taking into account the
applicability of these compounds as natural colorants for food industry, betalains are more suitable than
anthocyanins because of their higher stability between pH 3 to 7 (Gandía-Herrero et al. 2014; Strack et
3
Betalains are divided into two groups: the violet betacyanins (λmax = 535-540 nm, and a peak in the
UV-range between 270 and 280 nm due to the cyclo-Dopa structure) and the yellow betaxanthins (λmax =
480 nm), being their color attributable to the resonating double bonds. The maximum wavelength
absorption is dependent on the solvent used for their extraction (Gandía-Herrero et al. 2014; Stintzing
& Carle 2004; Jiménez 2014). The common structural unit, i.e., the chromophore of both molecules, is
betalamic acid (a protonated 1,2,4,7,7-pentasubstitued 1,7-diazaheptamethin system). This, in
condensation with cyclo-DOPA, gives rise to betacyanins, and with amines and amino acids to
betaxanthins (Delgado-Vargas et al. 2000). The three general structures are illustrated in figure 1.2.
Figure 1.2 - General structures of betalamic acid, betacyanins and betaxanthins, from left to right. R1= R2 = H;
R3 = amine or amino acid group (Azeredo 2009).
Betalains are affected by multiple factors such as pH, water activity, exposure to light, oxygen, metal
ions, temperature and enzymatic activities. UV or visible light absorption excites π electrons of the
pigment chromophore to a more energetic state (π*), which leads to an increase of reactivity. Light-induced betalains then react with oxygen. Thus, to maintain their stability, they should be stored in the
dark, under low water activity and oxygen levels, since low oxygen levels allow the pigment to be
partially recovered after degradation (Agrawal 2013).
In the last years the study of these pigments has witnessed an increase, also because of their bioactive
potential. The health benefits of betalains accounted so far include antiviral, antimicrobial, antioxidant
activity, chemoprevention against lung and skin cancers (Slavov et al. 2013).
(Poly)phenols
(Poly)phenols, another class of phytochemicals, are structurally characterized by hydroxyl groups that
are linked to aromatic rings. Most are water-soluble, being stored in cellular vacuoles (Sant’Anna et al.
2013; Pace et al. 2014; Yordi et al. 2012). They are divided in sub-groups according to the number of
phenol rings and to the structural elements between the phenol rings (Ignat et al. 2011). These features
4
Indeed, more than 8000 (poly)phenol compounds are currently known, flavonoids being considered as
the most relevant compounds belonging to this class (Kujala et al. 2001). Major (poly)phenols found in
various sources such as plant and plant derived products are presented in table 1.1.
Table 1.1– Major phenolic compounds and their sources (Prakash et al. 2012).
(Poly)phenols Sources
Flavonoids (Anthocyanidins): Cyanidin 3-glycosides, Malvidin,
Delphinidin, Pelargonidin
Blue berries, black berries, cranberry, raspberry, black currant, black grape, straw-berries, cherries, plums, pomegranate, juice, red wine
Flavonoid glycosides: Rutin, Hesperidin, Naringin
Orange, orange juice, lemon, grapefruit, tangerine juice
Flavones: Apigenin, Luteolin Celery hearts, celery, olives, peppers, fresh parsley, dry
parsley, oregano, rosemary, thyme Flavanones: Naringenin,
Eriodictyol, Hesperetin
Grapes, citrus fruits and their juices, tangerine juice, peppermint
Flavanols: Morin, Procyanidins Prodelphinidins, Catechin, Epicatechin
and their gallates
Apricots, apples, grapes, peaches, pears, plums, raisins, berries, cherries, red wine, tea, chocolate
Anthoxanthins (Flavonols): Myricetin, Fisetin, Quercetin,
Kaempferol, Isorhamnetin
Cherry, tomatoes, spinach, celery, onions, peppers, sweet potato, lettuce, broccoli, kale, buckwheat, beans, apples, apricots, grapes, plums, berries, currants, cherries, juices,
ginkgo biloba, red wine, tea, cocoa Isoflavones: Genistein, Daidzein,
Equol
Soybean, soy products, soy cheese and sauces, grape seeds/skin,
Phenolic acids: Caffeic acid, Chlorogenic acid, Ferulic acid,
p-coumaric acid, Sinapic acid, Ellagic acid,Gallic acid
Lemon, peach, lettuce, coffee beans, tea, coffee, cider, Strawberry, raspberry grape juice, pomegranate juice bluberry, cranberry, pear, cherry, cherry juice, apple, apple juice, orange, grapefruit
Tannins: Catechin, Epicatechin polymers, Ellagitannins,
Proanthocyanidins, Tannic acids
Pomegranate, walnuts, peach, olive, plum, chick pea, peas, grape seeds and skin, apple juice, strawberries, raspberries, blackberry, lentils, haricot bean, red wine, cocoa, chocolate, tea, coffee, immature fruits
Diferuloylmethane: Curcuminoids Turmeric
Recently, phenolics from plants have received interest due to its potential use as food additives, and
health-promoting compounds to improve memory, learning and general cognitive ability (Kujala et al.
2001). On the other hand, it is has been claimed that continuous, long-term consumption of
(poly)phenols can have helpful effects against cancer and chronic diseases such as cardiovascular
diseases and type 2 diabetes, chronic inflammation and neurodegenerative diseases (Del Rio et al.
2012).
1.2) Beetroot (Beta vulgaris)
Beet belongs to the Chenopodiaceae family and has been used as a common vegetable. The cultivated
group of the genus Beta includes sugar beets (Beta vulgaris saccharifera), fodder beets (Beta vulgaris
5
2013). Red beetroot (figure 1.3) is a good source of water (~87%), carbohydrates, fibers, proteins,
minerals (sodium, potassium, calcium and iron). It contains mostly betalain pigments such as
betaxanthins and betacyanins, and a large number of phenolic compounds (phenolic acids, flavonoids).
The phenolic concentration is dependent on the maturity stage of the plant, being maximized when the
crop is fully mature (Ninfali & Angelino 2013; Stintzing & Carle 2004). It also contains high levels of
nitrates and has an earthy flavor due to geosmin (a bicyclic alcohol) and various pyrazines (heterocyclic
aromatic organic compound)(Clifford et al. 2015). Beet is considered a potent antioxidant vegetable
due to the betalain pigments that it contains. On the other hand, it is a low caloric vegetable (Straus et
al. 2012). Consumption of beetroot appears to help protecting against hypertension and cardiovascular
diseases due to its high content in nitrate, and in turn to the produced nitric oxide, the last acting as
vasoprotective due to its vasodilatation effect (Hobbs et al. 2012; Coles & Clifton 2012). It can also be
chemopreventive, as reported in a study showing that commercial red beetroot inhibits tumorigenesis
in a rat esophageal cell carcinoma model (Lechner et al. 2010), in addition to its protective effect on
liver injury (Váli et al. 2007) and potential kidney protection (El Gamal et al. 2014).
1.3) Opuntia spp. fruits
Cactus pears plants belong to the Cactaceae family. They are originated from Central America
(Mexico), but they have been well adapted to the arid areas in Europe. The genus Opuntia includes
around 1500 species, and many of the species produce edible and highly flavored fruits, with different
shapes, sizes, and colors (Moßhammer et al. 2006). Cactus fruits (figure 1.3) are a rich source of water
(about 80-95%), carbohydrates, ascorbic acid, vitamin E, carotenoids, fibers, amino acids, phenolic
compounds and betalains (Osuna-martínez et al. 2014). Opuntiaficus-indica, an edible species of the
genus Opuntia, has been used in folk medicine to treat arteriosclerosis, diabetes, hypertension, asthma,
burns, edema, indigestion and gastritis (El-Mostafa et al. 2014). On the other hand, due to its high
phenolic content, it exhibits antioxidant and anti-inflammatory properties (M. Abou Elella 2014; Kaur
et al. 2012). It was reported that oral administration of Opuntia ficus-indica extracts ameliorates
neuronal damage after ischemic insult in cultured mouse cortical cells (Kim et al. 2006).
Figure 1.3– Beetroot and Opuntia spp. fruits. The left image shows red beetroot and the two images on the right
6
1.4) Neurodegenerative diseases
Neurodegenerative diseases are a heterogeneous group of pathologies,defined as hereditary or sporadic
conditions. They are characterized by a slow and progressive degeneration of neurons in specific
locations of the central nervous system, including the brain, spinal cord and peripheral nerves (Hirsch
2007; Ullah & Khan 2008). The cases of neurodegenerative disorders have increased significantly
worldwide, and it is estimated to rise from 13.5 million in 2000 to 36.7 million in 2050 (Chen & Zheng
2012).
Neurodegenerative diseases such as Parkinson’s (PD), Amyotrophic Lateral Sclerosis (ALS),
Huntington’s (HD) and Alzheimer’s (AD) are pathologies characterized by the loss or dysfunction of particular groups of neurons (Cacciatore et al. 2012). The pathological hallmarks of these diseases
involve accumulation and aggregation of misfolded proteins, which are thought to lead to
neurodegeneration. The accumulation of misfolded proteins results from the disruption of protein
homeostasis, that is, the equilibrium between protein synthesis and protein degradation (Narayan et al.
2014; Gorman 2008; Takalo et al. 2013; Ross & Poirier 2004; Nieoullon 2011). On the other hand, due
to the high oxygen consumption rate, the brain is a vulnerable organ to oxidative damage. Therefore,
the generation of reactive oxygen species (ROS) and oxidative damage is directly associated to the
pathogenesis of neurodegenerative disorders (Melo et al. 2011; Cacciatore et al. 2012).
Parkinson´s Disease(PD)
PD is the second most common neurodegenerative disease. The clinical symptoms of the disease are
due to the degeneration of dopaminergic neurons, which leads to the slow movement, resting tremor
and muscle rigidity (Gorman 2008).The major pathological hallmark of the disease is the formation of
α-synuclein insoluble aggregates that constitutes cytoplasmic inclusions called Lewy bodies (Braun et
al. 2010). The potential protective effect of (poly)phenols for PD has already been stated (Caruana &
Vassallo 2011). For example, (poly)phenolic molecules such as resveratrol, cathechin or
epigallocatechine-gallate (EGCG) originated from grape, blueberry and green tea extracts show a
potential protective effect against this disease (Masuda et al. 2006). In addition, (poly)phenol from
Corema albumleaves extracts were able to inhibit α-synuclein aggregation and reduced its cytotoxicity (Macedo et al. 2015).
Amyotrophic Lateral Sclerosis Disease (ALS)
ALS is a neurodegenerative disorder that results in the progressive death of motor neurons in the central
nervous system. It is characterized by progressive muscle disorder, muscle atrophy and paralysis being
among the symptoms (Kiernan et al. 2011). Of the identified genes, mutations in SOD1 (encoding the
copper/zinc ion-binding superoxide dismutase), TDP-43 (encoding the TAR DNA binding protein), and
FUS (encoding the fused in sarcoma protein) are mostly responsible for the development of the disease
7
targeted against ALS for a number of (poly)phenolic compounds (Nabavi et al. 2015). The oral
administration of EGCG in a transgenic ALSmouse model has shown that this compound is able to
increase life span by delaying the disease´s onset (Xu et al. 2006). Also, oral administration of a
chemical mixture composed of flavonols, terpenes and other compounds from Gingko biloba extract
revealed a neuroprotective effect in transgenic ALS mice models (Ferrante et al. 2001).
Huntington´s Disease(HD)
HDis characterized by neuronal cell death due to the accumulation of toxic mutated Huntingtin protein
fragments. The symptoms are progressive motor abnormality and intellectual deterioration, and
manifest typically between 30 and 45 years of age (Li & Li 2006). The main hallmark of the disease
are intranuclear and cytoplasmic inclusions of Huntingtin (Htt), which leads to brain lesions (Outeiro
& Muchowski 2004). It has been shown that oral administration of grape seed (poly)phenolic extract
inhibited the abnormal aggregation of the Huntingtin protein (Wang et al. 2010). On the other hand,
antioxidants such as lycopene have shown their efficacy in slowing disease progression in transgenic
HD mouse models (Johri & Beal 2012).
Alzheimer’s Disease (AD)
ADis the most common neurodegenerative disease leading to progressive memory loss and cognitive
dysfunction (Gorman 2008; Quinn et al. 2004). The disease is characterized by the accumulation in the
brain tissue of beta amyloid (Aβ42) proteins, resulting in synaptic degeneration, neuronal loss and
decline in cognitive function (Axelsen et al. 2011; Zhao & Zhao 2013). Compounds from Opuntia
ficus-indica appear to protect primary cultured rat cortical cells against neuronal injury induced by oxidative
stress, excytotoxins, and amyloid β (Aβ) (Cho et al. 2007). In addition, the flavonoids quercetin and
rutin showed an inhibitory action on Aβ formation in AD case studies, suggesting their potential
protection against Aβ toxicity (Jiménez-Aliaga et al. 2011).
1.5) Inflammation
Inflammation is a protective response of the organism to infection and tissue injury in order to
reestablish the homeostasis, but it can cause undesirable effects if the response persists more than it is
needed to restore normal immune function of the organism, leading to disorders characterized by
chronic inflammation. Neurodegenerative disorders are associated with a variety of inflammatory
responses, which may be activated by the accumulation of proteins with abnormal conformations or by
signals originated from injured neurons (Wyss-coray & Mucke 2002). However, it is known that
systemic inflammation links with the brain through signals, which lead to modifications in the behavior,
and recent indications suggest that this fact may lead to the development of neurodegenerative diseases
(Perry 2010). Although the inflammatory response may occur in a certain location of the body, the
8
nonsteroidal anti-inflammatory drugs, which could delay the progression of some neurodegenerative
diseases (Akiyama et al. 2000).
The mechanism by which cells respond to stimuli is the contribution of the immune cells such as
macrophages, dendritic cells, mast cells, neutrophils and leucocytes, and other non-immune cells.
Mediators called cytokines and chemokines regulate the arrival of these cells at the damaged tissue to
begin the anti-inflammatory process. On the other hand, the inflammatory response is regulated by
genes encoding for these mediators through the activation of transcription factors. In normal conditions
they remain inactive in the cytoplasm, and enter the nucleus in response to a stimulus to induce
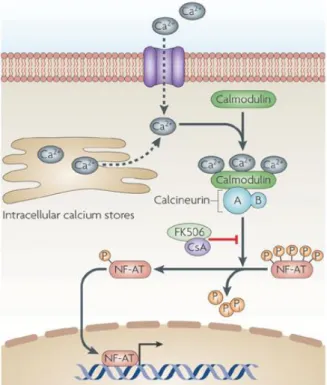
expression of specific genes (Ahmed 2011). This is the case of the transcription factor NFAT
(Nuclear Factor of Activated T cell), which regulate T cells immune response. NFAT is regulated by
the calmodulin/calcineurin complex, leading to its dephosphorylation and localization to the nucleus.
Therefore, NFAT transport between cell compartments is dependent on the level of calcium intracellular
and calcineurin activity (Pan et al. 2013).
Calcineurin is a eukaryotic serine/threonine protein phosphatase containing a catalytic and a regulatory
subunit, and functions along with the calmodulin/Ca2+-complex, leading to dephosphorylation of
NFAT. As the intracellular calcium level rises, the calcineurin is activated. FK506 (Tacrolimus) inhibits
the NFAT dephosphorylation, blocking its translocation to the nucleus and the activation of
pro-inflammatory genes (figure 1.4) (Rusnak & Mertz 2000).
Figure 1.4– Schematic representation of the cellular pathway leading to NFAT activation in mammalian cells
9
1.6) Yeast as a discovery platform for therapeutic compounds
The knowledge of disease mechanisms comes from models, either in vivo or in vitro, which uses a toxin
and/or genetic mutations to recapitulate specific disease features. The yeast Saccharomyces cerevisiae
is the simplest eukaryotic model organism with proven utility in the study of cellular pathologies
associated to neurodegenerative diseases (Khurana & Lindquist 2010).Yeast cells are unicellular and
contain a nucleus and organelles bounded by membranes likemammalian cells (Duina et al. 2014).
The advantages of using yeast models for biological studies include easy manipulation and short
doubling time. Additionally, yeast encodes various genes with human orthologues (Khurana &
Lindquist 2010). Most importantly, it shares many of the fundamental biological features of the
eukaryotic cells, including basic cellular pathways (figure 1.5) involved in neurodegeneration, such as
protein homeostasis, mitochondria biogenesis, intracellular transport, cell division and vesicular
trafficking (Ocampo & Barrientos 2008; Pereira et al. 2012). On the other hand, the triggering of
mammalian Ca2+-signaling pathways and NFAT activation is highly conserved in yeast, which in turn
culminates with the induction of the calcineurin-responsive zinc finger – Crz1 – transcription factor, a
NFAT orthologue (Thewes 2014).
Figure 1.5– Illustration of the main cellular pathways relevant for neurodegeneration, which are conserved
10
Yeast models of neurodegenerative diseases
The humanized yeast models are based on the premise that disease protein aggregation is a relevant
feature of neurodegenerative processes associated to PD, ALS, HD and AD. In the yeast models,
recombinant versions of α-synuclein (PD), FUS (ALS), Htt (HD) and Aβ42 (AD) fused to GFP are
regulated by the inducible GAL1 promoter and shift of cells to galactose-supplemented media triggers
high fusion protein expression, leading to protein mislocalization and cell death. All the humanized
yeast models mimic fundamental aspects of disease-protein pathobiology, including aggregation,
proteostasis unbalance and cytotoxicity (Braun et al. 2010; Khurana & Lindquist 2010; Outeiro &
Lindquist 2003; Kryndushkin & Shewmaker 2011; Mason & Giorgini 2011), offering a great
opportunity to screen for compounds with protective functions for these pathological processes.
Yeast model of Crz1/NFAT activation
Crz1 regulation is highly conserved with the NFAT human orthologue. The yeast model encodes an
integrated copy of the bacterial lacZ reporter gene under the control of a calcineurin-dependent response
element promoter (CDRE). At low cytosolic Ca2+ levels, phosphorylated Crz1 is kept in the cytosol;
cellular stimuli increasing cytosolic Ca2+ levels activate the calmodulin/calcineurin complex, leading to
Crz1 dephosphorylation and translocation to the nucleus, where it binds the CDRE and activates lacZ
expression. Therefore, it is possible to monitor the degree of Crz1 activation by evaluating the β
-galactosidase activity (Schumacher et al. 2008; Garcia et al. 2015, in press). Compounds able to
interfere with this process are good candidates to modulate NFAT activation, since both pathways are
highly conserved.
1.7) Objectives
The major goal of this thesis was to identify potential therapeutic compounds for neurodegenerative
disorders and chronic inflammatory processes in beetroot and Opuntia fruit matrixes. This objective
was accomplished through the following intermediate goals:
(a) Isolation of betalain- and (poly)phenol- rich extracts from beetroot and Opuntia fruits (purple and
yellow), using biocompatible solvents (water), and selection of the matrix containing the highest
contents of both classes of compounds;
(b) Evaluation of the protective potential of the selected matrix using humanized yeast models of the
major neurodegenerative disorders (Parkinson’s, Amyotrophic Lateral Sclerosis, Huntington’s and
11
2) Materials and Methods
2.1) Samples and extracts preparation
The red beetroots (Beta Vulgaris) were purchased, in early September 2014, from a local supermarket
(Pingo Doce, Oeiras, Portugal). After being washed, they were cut into small pieces and freeze-dried
during 72 h (the whole vegetable, including the peel). Afterwards, the pieces were freeze-dried in a
FreeZone Plus 4,5 L Cascade Freezer Dry System (Labconco), milled, sieved and stored at -20 ˚C. The
purple and yellow Opuntia spp. fruits were collected in Quarteira (Algarve, N37º 04´ 24´´ W8º 06´ 06´´)
and Ribeira dos Moinhos (Sines, N37º 58´ 41´´ W8º 50´ 27´´), Portugal, respectively, at the end of
September 2014. Firstly, the spikes on the surface of the fruits were removed, and the fruits were cut
into pieces and freeze-dried during 72 h to obtain the dry matrix. After being freeze-dried using the
same equipment cited above, the fruits were milled and stored at -20 ˚C.
The parameters of the solid-liquid extraction applied to the three matrixes were selected taking into
account two optimized extraction procedures already published for beetroot (Swamy et al. 2014) and
for Opuntia spp. fruits (Prakash Maran et al. 2013), with modifications. For beetroot, the optimum
extraction parameters were defined as 1.5 g fresh weight extracted with 50 mL water, during 84 min at
60 ˚C (Swamy et al. 2014). For Opuntia spp. fruits, the optimum extraction parameters were 1.2 g of
fresh fruits extracted with 50 mL water at pH 6.9, during 115 min at 42 ˚C (Prakash Maran et al. 2013).
Nevertheless, since for beetroot the pH of the water was not mentioned, it was performed an
optimization of this parameter. Additionally, the procedure was carried out using stirring at 405 rpm, to
promote a better diffusion of the pigments into the solvent, and all the extractions (in triplicate) were
made in a thermostatic bath, in the absence of light, to prevent degradation of phytochemicals. When
necessary, the acidification of the extraction solvent (distilled water) was done with 1% citric acid
(Sigma-Aldrich)to enhance betalain stability (Strack et al. 2003). The obtained extracts from beetroot
and Opuntia spp. fruits were kept at -20 ºC, in the dark.
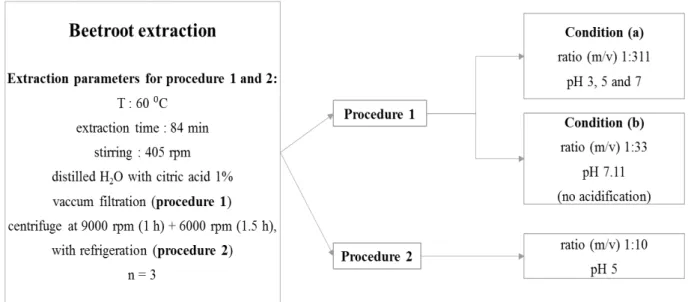
Therefore, two procedures were carried out for beetroot phytochemicals extraction (figure 2.1):
Procedure 1:
Condition (a): As the water pH of the extraction solvent was not well established in the previous
studies, the pH optimization was conducted using three different pH conditions: 3, 5 and 7. Since the
matrix was lyophilized, the ratio of dry matrix/solvent used was 0.165 g/51.335 mL (1:311). The
calculation of this ratio took into consideration the mass of fresh fruit/solvent ratio from the original
reference (1.5 g/50 mL) and the water content of beetroot determined in the lyophilization process.
Condition (b): To replicate the conditions used in the original reference, it was used a 1.5 g/50 mL
ratio (1:33) of fresh matrix/water. As the water pH (extraction solvent) was not mentioned, the water
was not acidified considering that the authors used water without acidification. So, the water pH was
12
Procedure 2: This procedure was established according to the best condition resulting from procedure
1 with the aim to maximize betalains and (poly)phenols contents. Extractions were performed using dry
matrix, a 1:10 (10 g/100 mL) ratio of dry matrix/water and pH 5.
Figure 2.1– Schematic representation of the procedures used for beetroot solid-liquid extractions.
Two procedures were also carried out for purple Opuntia spp. fruits phytochemicals extraction (figure
2.2):
The ratio dry matrix/solvent for the purple fruits was calculated according to the ratio described in the
literature (1.2 g/50 mL) (Prakash Maran et al. 2013) and the water percentage of the fruits obtained
from the lyophilization process, obtaining a final ratio of 0.264 g/50.936 mL (1:193).
Procedure 1: It was performed according to the parameters described by Prakash Maran and
co-workers (2013).
Procedure 2: Taking into account the parameters established for the beetroot, extractions were carried
out at pH 5 for 84 min to allow yielding an increase on phytochemical contents and to evaluate the
impact of a lower residence time, which could avoid degradation due to prolonged exposure to high
temperature.
For yellow Opuntia spp. fruits, phytochemical extractions were performed using a 1:10 ratio of dry
matrix/water (1 g/10 mL) and different temperatures (40 ºC, 50 ºC and 60 ºC) to evaluate their influence
in the final contents of betalains and (poly)phenols. The extracts were centrifuged instead of filtrated
13
Figure 2.2– Schematic representation of the procedures used for purple and yellow Opuntia spp. fruits
solid-liquid extraction.
2.2) Solid Phase Extraction (SPE)
Purification of selected beetroot extracts was performed by solid phase extraction, at room temperature
(~25 0C), using a reversed phase C-18-E (2 g/12 mL, Strata, Phenomenex). The reagents used for the
procedure were acetic acid (CH3COOH), formic acid (CH2O2) and acetonitrile (C2H3N), purchased from
Panreac, and methanol (CH4O) from Fischer Scientific. Briefly, the procedure consisted in five steps.
First the column was washed with 15 mL of 0.5% CH3COOH/C2H3N (5 mL each time) to activate
stationary phase. It was then equilibrated with 15 mL of 0.5% CH3COOH/H2O (5 mL each time) to
prepare sorbent for optimized interaction with the analyte, and the extract was loaded (5 mL each time)
for analyte selective retention. Fractions 1 and 2 were retrieved. The column was washed with 15 mL
of 0.5% CH3COOH/H2O (5 mL each time) to remove impurities from the sample, providing fractions
3 and 4. Finally, analytes were eluted 6 mL of 2% CH2O2/CH4O, giving rise to fractions 5 and 6.
2.3) Extracts characterization
2.3.1) Betalain determination
Spectrophotometric determination of betalains was performed using an UV-Vis spectrometer (Thermo
Spectronic, Genesys 10uv). Measurements were performed by diluting the samples in 0.05 mM
citrate-phosphate buffer pH 6.5 (Na2HPO4/KH2PO, acidified with 0.1 M hydrochloric acid (HCl), reagents
14
triplicates according to Nilsson equations (1970), by means of three wave lengths as reference: 480 nm
(λmax. indicaxanthin), 538 nm (λmax betanin) and 600 nm (correction of the absorbance due to impurities
of the solutions), using the following equations (Guzmán-Maldonado et al. 2010; Slavov et al. 2013):
% Betacyanins (BC) = (a/1129)*FD (Eq. 1)
and
% Betaxanthins (BX) = (y/750)*FD (Eq. 2)
where:
a = 1,095*(A538 nm - A600 nm);
y = A476nm - (A538 nm - a) - (a/3.1);
FD = dilution factor.
The results were expressed as a mean of triplicates and were presented as mg of betacyanins or
betaxanthins per liter (L) and per 100 g of dry extract (d.e.).
2.3.2) Total phenolic content (TPC) determination
Total phenolics concentration of extracts was determined according to the Folin-Ciocalteau colorimetric
method (Singleton et al. 1999) as previously described by Serra (2010). The reagents used were
Folin-Ciocalteau reagent (Panreac), saturated sodium carbonate solution (Na2CO3,Sigma- Aldrich) and 1000
mg.L-1 gallic acid (C
7H6O5, Fluka).
The procedure was carried out on a 96-well plate. Briefly, 3 μL of appropriately diluted samples were
added to 273 μL of distilled water, and 15 μL of Folin-Ciocalteau reagent was added. 45 μL of saturated
Na2CO3 were added to neutralize the reaction, and it was incubated at 37-40 ˚C for 30 min. The
absorbance of samples and blank (distilled water) was recorded at 765 nm using the Genesys10uv
spectrometer (Thermo Spectronic). To quantify the total phenolic content, it was used a calibration
curve with gallic acid as standard, with the following concentrations: 0, 50, 100, 200, 400, 600 and 800
mg.L-1, prepared in distilled water. Samples were analyzed as triplicates. The total phenolic content of
the samples were expressed in gallic acid equivalents (GAE) per liter and per 100 g of dry extract (d.e.).
2.3.3) Oxygen radical absorbance capacity (ORAC)
The ORAC assay was carried out as previously described (Huang et al. 2002), with adaptations for the
FL800 microplate fluorescent reader (Serra 2010). The reagents used for the procedure were 0.3 µM
disodium fluorescein (FL, TCI Europe), 153 mM 2, 2'- Azobis (2-amidinopropane) dihydrochloride
(AAPH, Sigma-Aldrich), 5 mM 6-hydroxy-2, 5, 7, 8- tetramethylchroman-2-carboxylic acid (Trolox,
Sigma-Aldrich). Sodium chloride (NaCl), potassium chloride (KCl) and monopotassium phosphate
(KH2PO4) were purchased from Sigma-Aldrich and sodium phosphate dibasic dehydrate
(Na2HPO4⋅2H2O) from Riedel-de-Haën to prepare 75 mM phosphate buffer solution (PBS) at pH 7.4.
All samples, the calibration curve (Trolox), AAPH and FL were prepared in PBS, the former was used
15
The procedure was performed in a 96-well microplate using 25 μL of properly diluted sample, and 150
μL of 0.3 µM FL. The microplate was incubated in a fluorescent reader (Bio-Tek Instruments)at 37 ºC,
for 10 min. 25 μL of 153 mM AAPH were added through an injector to start the reaction. Trolox, at the
concentrations of 5, 10, 20, 40 and 50 μmol.L-1 was used as a standard. Samples were analyzed as
triplicates. Fluorescence was recorded every 1 min, during 40 min, at the emission wavelength of
530±25 nm, and excitation wavelength of 485±20 nm.ORAC values were calculated by a regression
equation between the Trolox concentration and the net area under the FL decay curve, and were
expressed as Trolox Equivalents (TE) per literper 100 g of dry extract (d.e.).
2.4) Sucrose, D-fructose and D-glucose assay procedure
The assays were performed using the Megazyme kit (K-SUFRG 06/14, Megazyme International
Ireland) according to manufacturer´s instructions. The reagents included in the kit were sodium
phosphate buffer plus sodium azide (0.02% w/v), NADP+ plus ATP, hexokinase plus
glucose-6-phosphate dehydrogenase suspension, phosphoglucose isomerase suspension and β-Fructosidase.
Spectrophotometric measurements were carried out at 340 nm using the Shimadzu UV-1603 equipment
(Model CPS-240A). Sucrose, D-fructose and D-glucose contents were quantified in the beetroot extract
and in the SPE purified fractions, samples being appropriately diluted in distilled water.
2.5) Strains and plasmids
The yeast strains used in this study are listed bellow:
-
PD yeast model: W303 MAT can1-100 his3-11 15 leu2-3 112 ade2-1 GAL1pr-syn WT::TRP1GAL1pr-syn WT::URA3(Outeiro and Lindquist 2003), which encodes two integrated copies of
SNCA (-synuclein) gene fused to GFP, under the control of the yeast GAL1 promoter;
-
ALS yeast model: W303 MAT can1-100 his3-11 15 leu2-3 112 ade2-1 GAL1pr-FUS WT::TRP1GAL1pr-syn WT::HIS3 (Ju et al 2011), encoding two integrated copies of the FUS gene fused to
GFP, under the control of the yeast GAL1 promoter;
-
HD yeast model: BY4741 MATa his3∆1 leu2∆0 met15∆0 ura3∆0 YML008c::kanMX4<p425_GAL1pr_HTTpolyQ103_GFP> <p426_GAL1pr_HTTpolyQ103_GFP> (Menezes et al,
unpublished), which encodes two episomal copies of HTTpolyQ103 cDNA fragment fused to GFP,
under the control of the yeast GAL1 promoter. The recombinant multi-copy plasmid
p425_GAL1pr_HTTpolyQ103_GFP (Krobitsch and Lindquist 2000) was kindly provided by Prof Dr Tiago Outeiro;
-
AD yeast model: BY4741 MATa his3∆1 leu2∆0 met15∆0 ura3∆0 YML008c::kanMX4<p425_GAL1pr_GFP_A-42> <p426_GAL1pr_GFP_A-42>, encoding two episomal copies of
A-42 cDNA fused to GFP, under the control of the yeast GAL1 promoter (Menezes et al,
16
-
Yeast model of Crz1/NFAT: BY4741 MATa his3 leu2 lys2 ura3 aur1::AUR1-C-4xCDRE-lacZ(Araki et al 2009), encoding an integrated copy of the lacZ reporter gene under the control of a
promoter containing four copies of the Crz1 binding sequence CDRE.
2.6) Yeast media and reagents
Humanized yeast strains expressing PD, ALS, HD and AD disease-proteins were grown in synthetic
media containing 6.7 g.L-1 yeast nitrogen based (YNB, Difco), 0.79 g.L-1 complete supplement mixture
(CSM-6AA w/o adenine, histidine, leucine, lysine, tryptophan and uracil; MP Biomedicals), and the
required amino acids. Glucose (C6H12O6, Sigma-Aldrich), galactose (C6H12O6, Fluka Analytical,
Sigma-Aldrich) or raffinose (C18H32O16.5H2O; Fluka Analytical, Sigma-Aldrich) at a final
concentration of 2.0% (w/v) were used as carbon sources.
The yeast strain encoding the Crz1-reporter system was grown in synthetic complete media containing
6.7 g.L-1 YNB (Difco), 0.79 g.L-1 ofCSM (QBiogene) and 2.0% (w/v) glucose. 100 mM manganese
chloride (MnCl2, Sigma–Aldrich) and 1mg.mL-1 FK506 (Tacrolimus, Sigma–Aldrich) were used as a
Crz1 inducer and as an immunosuppressant, respectively. Yeast Protein Extraction Reagent (Y-PER,
Thermo Fisher Scientific Inc.–Life Technologies), LacZ buffer (prepared with 8.5 g.L-1 Na
2HPO4, 5.5
g.L-1 NaH
2PO4.H2O, 0.75 g.L-1 KCl, 0.246 g.L-1 MgSO4.7H2O), and 2 mg.mL-1 Ortho-Nitrophenyl-β
-galactoside (ONPG, Sigma–Aldrich) were used to monitor β-galactosidade activity.
2.7) Growth conditions
The evaluation of the protective activity of phytochemicals using the humanized yeast models was
performed by means of growth curve assays. For that, stationary phase pre-cultures grown overnight at
30 ºC in raffinose-supplemented synthetic media, with orbital agitation at 200 rpm, were diluted in fresh
media and incubated for 6-8 h under the same conditions. The optical density of the cultures was
monitored at 600 nm (OD600), using the BioTek, PowerWaveXS spectrophotometer, and cultures were
diluted to obtain a final OD600 0.4 0.04 after 16 h incubation, according to the equation:
ODi x Vi = (ODf/(2(t/gt)) x Vf (Eq. 3)
where:
ODi = initial optical density of the culture;
Vi = initial volume of culture;
ODf = final optical density of the culture;
t = time of incubation;
gt = generation time of the strain;
17
Monitoring of phytochemical bioactivities towards Crz1/NFAT regulation was carried out through the
measurement of Crz1-driven β-galactosidase activity. For that, stationary phase pre-cultures grown
overnight at 30 ºC in glucose-containing synthetic media, with orbital agitation at 200 rpm, were diluted
in fresh media and incubated for 6-8 h under the same conditions. The OD600 was monitored and cultures
were diluted according to same equation described above, to obtain a final OD600 1 0.1 after 16 h.
2.8) Growth curves
The assay to evaluate the protective activity of the extracts was performed using sterile 96-well
microplates. The lyophilized extracts were first resuspended in sterilized water and were then diluted
in glucose or galactose media. Exponential-phase control and humanized cell cultures (obtained from
2.7) were diluted in glucose (disease protein expression repressed) and galactose (disease protein
expression induced) media to obtain a final OD600 of 0.08 0.008. The microplates were incubated at
30 0C, with continuum agitation, in the spectrometer (BioTek, PowerWaveXS) during 24 h. The OD
600
was monitored every hour for 24 h. Control and humanized cultures, without the addition of
phytochemicals, were diluted in fresh glucose and galactose media, and were used for comparison
purposes. Each tested concentration of extracts/fractions had a corresponding blank.
2.9) β-galactosidase assays
To 300 L of exponential-phase cultures obtained from section 2.7, it was added 20 L of
extracts/fractions to be tested, sterilized water (negative control) or the positive control FK506 (to a
final concentration of 10 µg.mL-1), and cultures were incubated at 30 0C for 90 min with orbital agitation
at 200 rpm. The tubes were then centrifuged for 3 min at 1000 g, and the pellet was ressuspended in
300 L of fresh media. After homogenizing the cells, 150 µL corresponding to each condition was
transferred into a new tube containing 7.5 µL of MnCl2 (to a final concentration of 3 mM). These tubes
correspond to the induced condition. To the remaining 150 µL of each culture, 7.5 µL of water were
added to mimic the uninduced condition. The tubes were incubated for further 90 min under the same
conditions. 10 µL of these cultures were retrieved for OD600 measurements. For the monitoring of β
-galactosidase activity (in triplicate), 10 µL of each sample were transferred to a 96-well microplate
containing 20 µL Yeast Protein Extraction Reagent (Y-PER) per well. The microplate was incubated at
37 ºC for 20 min and 240 µL of LacZ/ONPG buffer were added to each well. The 96-well microplates
were incubated at 30 ºC in a spectrophotometer (BioTek, Synergy HT) for 2 h and OD420/OD550 were
monitored every 10 min.
The β-galactosidase activity values were given in Miller units, calculated according the equation:
1000 x ((OD420 - 1.75 x OD550)/(t x V x OD600) (Eq. 4)
where:
18
V = volume of culture assayed in mL
The OD420 values used in the equation were chosen taking into account the best differences between the
β-galactosidase activities from the positive and negative controls.
2.10) Statistical analyses
Statistical analyses were performed using SigmaPlot software and results were presented as mean ±
standard deviations. Differences were tested using one-way ANOVA, performing the Tukey test for
19
3) Results and Discussion
3.1) Extracts chemical characterization:
3.1.1) Betalain (betacyanins and betaxanthins) determination
The betalain contents of extracts/fractions were determined spectrophotometrically using Nilsson
equations (Eq. 1 and 2 section 2.3.1) and are presented as mg.L-1 or mg.100 g-1 dry extract (d.e.).
3.1.1.1) Beetroot extracts
Based on literature data, two extraction procedures were carried out to improve the extraction of
betalains. Along with betalains, (poly)phenols are co-extracted, improving the composition complexity.
Beetroot matrix was extracted with water, during 84 min at 60 0C and matrix/water ratio was calculated
as previously described (Swamy et al. 2014). For procedure 1, and once the pH was not specified, in
this work an optimization of extraction solvent pH was studied. Three different pH (3, 5 and 7) were
evaluated using a dry matrix/volume (m/v) ratio of 1:311. At pH 7.1 a comparison was made using a
different m/v ratio (1:33) and in this case fresh matrix was used (based on reference Swamy et al. 2014).
For the best pH attained in this first approach (procedure 1), pH 5, other comparison was performed
(procedure 2) in order to verify the effect of increasing m/v ratio (dried matrix) and with this reduce the
experimental error. For this m/v of 1:10 was applied.
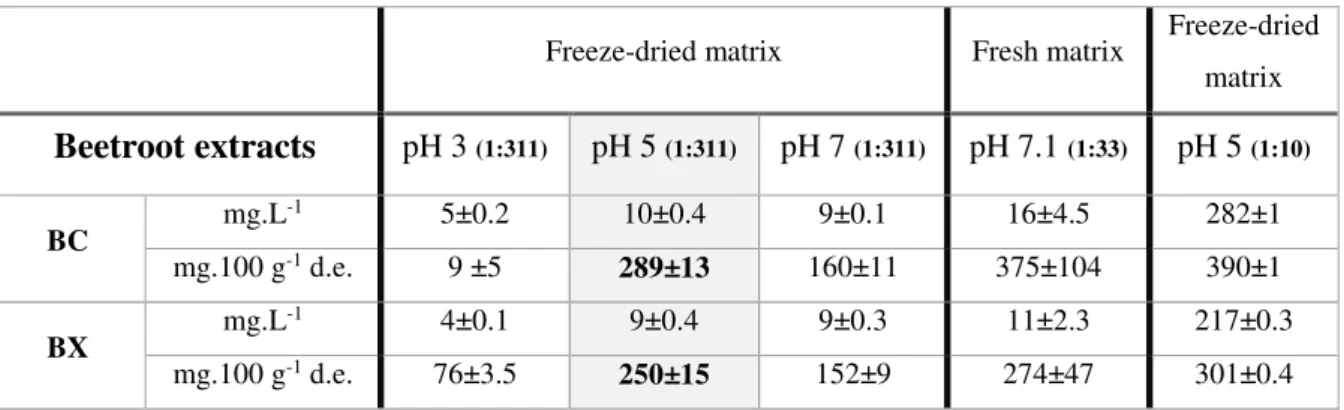
The extracts were evaluated in terms of betacyanin and betaxanthin content, and are presented in mg.L
-1 and mg.100 g-1 dry extract in table 3.1.
Table 3.1– Betalain determination of beetroot extracts, at different pH (3, 5, 7 and 7.1), matrix/solvent ratios
(1:311, 1.5:50 and 1:10), extraction at 60 ºC for 84 min. Values are presented as mean ± standard deviation (SD) from three replicates.
Freeze-dried matrix Fresh matrix Freeze-dried matrix
Beetroot extracts
pH 3 (1:311) pH 5 (1:311) pH 7 (1:311) pH 7.1 (1:33) pH 5 (1:10)BC mg.L
-1 5±0.2 10±0.4 9±0.1 16±4.5 282±1
mg.100 g-1 d.e. 9 ±5 289±13 160±11 375±104 390±1
BX mg.L
-1 4±0.1 9±0.4 9±0.3 11±2.3 217±0.3
mg.100 g-1 d.e. 76±3.5 250±15 152±9 274±47 301±0.4
BC: Betacyanins, BX: Betaxanthins, d.e.: dry extract
The optimization of solid-liquid extraction procedure for beetroot indicated that pH 5 was the best
condition to extract betacyanins and betaxanthins in any of the freeze-dried matrix/solvent ratios. On
the other hand, the extraction made with fresh matrix (1:33 ratio) allowed an efficient betalain