Structural reliability assessment based on optical
monitoring system: case study
Avaliação da iabilidade estrutural baseado em sistema
ótico de monitorização: caso de estudo
a Faculdade de Engenharia da Universidade do Porto, Porto, Portugal b Instituto Superior Técnico de Lisboa, Lisboa, Portugal
Received: 14 Aug 2015 • Accepted: 15 Feb 2016 • Available Online 21 Mar 2016
Abstract
Resumo
Optical systems are recognized to be an important tool for structural health monitoring, especially for real time safety assessment, due to simpli-ied system coniguration and low cost when compared to regular systems, namely electrical systems. This work aims to present a case study on structural health monitoring focused on reliability assessment and applying data collected by a simpliied optical sensing system. This way, an elevated reinforced concrete water reservoir was instrumented with a bi-axial optical accelerometer and monitored since January 2014. Taking into account acceleration data, the natural frequencies and relative displacements were estimated. The reliability analysis was performed based on generalized extreme values distribution (GEV) and the results were employed to build a forecast of the reliability of the water elevated reser-voir for the next 100 years. The results showed that the optical system combined with GEV analysis, implemented in this experimental work, can provide adequate data for structural reliability assessment.
Keywords: optical sensors, remote control, natural frequency, reliability assessment, generalized extreme values distribution.
Sistemas óticos são reconhecidos como uma importante ferramenta para a monitorização estrutural, especialmente para avaliação da segurança em tempo real, devido a coniguração simpliicada e o baixo custo destes sistemas quando comparado com sistemas usuais, nomeadamente sistemas elétricos. Este trabalho tem por objetivo apresentar um caso de estudo sobre monitorização estrutural focado na avaliação da iabili -dade através da utilização de um sistema sensorial ótico simpliicado. Dessa forma, um reservatório elevado de água de concreto armado foi instrumentado com um acelerómetro ótico biaxial e monitorado desde janeiro de 2014. Tendo em conta os dados de aceleração, as frequências naturais e os deslocamentos relativos foram calculados. Neste trabalho, a análise de iabilidade é realizada baseada na distribuição de valores extremos e os resultados obtidos são ainda utilizados para a predição sobre a segurança estrutural do reservatório de água para os próximos 100 anos. Os resultados mostraram que o sistema ótico de monitorização implementado neste trabalho combinado com a análise por distribuição dos valores extremos pode fornecer dados adequados para a avaliação da iabilidade estrutural.
Palavras-chave: sensor ótico, controle remoto, frequência natural, análise da iabilidade, distribuição de valores extremos.
E. MESQUITA a
P. ANTUNES a
A. A. HENRIQUES a
A. ARÊDE a
P. S. ANDRÉ b
H. VARUM a
1. Introduction
The recent codes ABNT NBR 15575 [1] and EN 1990 [2] estab-lish the safety minimum coeicients that structures should attend to during their service life for keeping their safety. However, the current design codes introduce a high number of uncertainties to existing structures, essentially associated to material proper-ties, loadings and work scenarios. Thereby, the employment of structural health monitoring (SHM) can be an interesting tool for structural characterization, because SHM can ofer accurate data for the structural behavior in real time.
SHM systems are composed by three principal systems that are: sensorial system, data receiving system and data process-ing system. In fact, in the recent years the sensors have been advancing towards more compact systems, better levels of data accuracy and less signal interferences. In this way, a large num-ber of optical sensors were implemented [3]–[6] since the year 2000, essentially motivated by their relatively low cost, the pos-sibility of sensors multiplexing, their immunity to interference from electromagnetic ields and because the optical sensors can be less intrusive than electrical sensors.
According to Diamantidis [7] the reliability assessment has as main aim the prediction of the structure’s failure probability under a determinate scenario, taking into account the limit state service or ultimate limit service, and also methods based on probabilistic models, due to high level of uncertainties associated with random variables [8]. Thus, the employment of SHM systems with proba-bilistic methods can be an interesting and important tool for risk prevention, being possible the structural performance character-ization under real service conditions, as well as the prediction about the structural behavior under dramatic scenarios. In this context, Dissanayake e Karunananda [9] proposed a new method for reliability analysis based on element failure and rein-forcement corrosion, and their method was applied to a railway bridge, in Sri Lanka, with 160 m of length. The results showed that the probabilistic model developed by the authors presents a good model for failure due to decreasing of the reinforcement area by corrosion process and element failure. Another similar study related with SHM systems combined with reliability analysis is reported by Liu et al [10], where a railway bridge on the Wis-consin river, in the United States, was instrumented with strain gauges and the traic loads efect on the bridge’s behavior was monitored. The data from the SHM system implemented on the bridge allowed the evaluation of reliability index in the current state, and were also used to predict the bridge’s reliability per-formance for the next 20 years. However, the cost of the sensing systems employed in both works mentioned above could have been minimized if optical sensors had been employed. In order to contribute for reliability assessment, this work pres-ents a simpliied methodology for structural safety assessment based on an optical system, which consists of data selection, preliminary statistical analysis focused on histogram construc-tion, probability assessment by GEV and determination of the failure probability. Thereby, an elevated reinforced concrete water reservoir located in Campus of Santiago, in the Univer-sity of Aveiro, Portugal, was instrumented with a bi-axial optical accelerometer [11] and continuously monitored since January 2014. From the data collected by longitudinal and transversal accelerations, the relative structural displacements due to wind
action were obtained and used as main variables for structural reliability analysis.
2. Reliability assessment method based
on relative displacements
The use of probabilistic methods for structural performance as-sessment under a determinate scenario can be a relevant help tool for structural integrity and safety management. The probabilistic methods can be interesting due to the fact that in the construction phase, structures are associated to a large number of uncertain-ties which are not included in the current design codes and also present a diiculty modeling by deterministic methods, making necessary the resource to probabilistic methods, which are most adequate for random variables processing.
In fact, the employment of probabilistic methods for reliability as-sessment should be adopted because there are some uncertain-ties introduced by geometric and material characteristics, and also load combination that structures can be submitted to during their service life, and in these cases the probabilistic models can be used for modeling the variable set [8, 11, 12]. Generally, the set of variables involved in the structural reliability assessment are repre-sented by R and E, where R represents the safety variable group for the analyzed scenario and E represents the variable group which afects negatively the structural safety. Then the structural probability of failure, Pf, can be written as:
( )
{
,
0
}
{
( ) ( )
}
=
£ =
£
Pf
3
g R E
3
r R e E
(1)
where,
g R E
( )
,
≤
0
represents the limit failure condition.So, considering expression (1) the failure probability, Pf, can also be written according to expression (2), where
f
x
is the probability density function of X, and X represents all random variables from the problem in study.(2)
From failure probability, Pf, the reliability index β can be estimated by expression (3), where ɸ-1 is the inverse of the standard normal
distribution function.
(3)
( )
1Φ
-= -
Pf
b
of curve that a data distribution can assume, one of the three forms of GEV should be adopted, namely: Gumbel distribution (Type I), Fréchet distribution (Type II) and Weibull distribution (Type III) [10]. The Gumbel distribution is based on the principle that the failure occurs when a determined set of values exceeds the safety value [8] and is frequently applied to modelling environmental phenom-ena, as for example wind velocity [14]; in addition the Gumbel dis-tribution has been recently used in SHM systems for service life prediction [8, 11, 13]. The Gumbel distribution for maximum val-ues can be deined by function Fx(x), according to expression (4), where α and u can be estimated from the data set analyzed, and x is the limit exceedance values in the distribution curve that will be analyzed. In fact, the α and u values can be obtained by expres-sions (5) and (6), where the variance
( )
X is a necessary value for determination of constant α, and( )
X is the average of Fx(x)function, for a given value of γ of 0.577.
(4)
( )
=
é
-
- (- )ù
ë
x uû
Fx x
exp e
a(5)
( )
X
= +
u
g
a
E
(6)
( )
226
=
X
p
a
V
Thus, the method for structural reliability assessment proposed in this work, based on random variables from wind velocity, namely structural displacements due to wind action, follows the present sequence: 1) selection of a data set, 2) establishment of an x limit value, in which the function G(x)
≤
0 represents failure, 3) con-struction of histograms based on obtained values from G(x)≤
0 considering the limit value of x, 4) adoption of an adequate proba-bilistic distribution curve, 5) determination of the statistic variables (,
,
α e u), 6) determination of failure probability Pf, taking inaccount the x limit value and 7) evaluation of reliability index, β.
3. Case study
3.1 Reinforced concrete elevated water reservoir
The elevated water reservoir [Figure 1-A] is a slender structure of reinforced concrete with a height of 35.25 m, built in 1989 in the campus of Santiago at University of Aveiro [Figure 1-B], Portugal, essentially composed by a laminar section of 30.90 m of height, 4 m of length and 0.30 m of thickness; one cylindrical hollow section with 30.90 m of height, outer diameter of 2.40 m and inner diameter of 1.20 m; and a rectangular structure with 4.35 m of height, 8.60 m
A
B
of longitudinal length and 4.00 m of transversal length. The present structure has a metallic bracing, composed by two hollow steel cylin-ders with 5 mm of thickness, placed at 1/3 and 2/3 of the total height. The reservoir instrumentation was done by employing a bi-axial optical accelerometer developed and tested by Antunes [15], posi-tioned in the structure top, as shown in the [Figure 1- C]. The im-plemented monitoring system was connected to a data acquisition system located in the Institute of Telecommunications of Aveiro, Portugal, by 790 m of optical iber [Figure 1-B].
In order to collect data on structural displacements due to wind ac-tion, the elevated reservoir has been monitored since January 2014 aiming the identiication of changes in the structural behavior that can compromise the safety state. In this way, the bi-axial optic accel-erometer has the function of collecting information in the transversal (D1) and longitudinal (D2) directions, essential accelerations for de-termining the natural frequency and relative displacements.
3.2 Data collecting, selection and processing
The natural frequency is given by the expression (7), where the mass m is characterized as inversely proportional of the square of the natural frequency,
f
, and directly proportional to square of the stifness ratio k. In this analysis the stifness ratio k was considered constant, and that only the m value could inluence the frequency value, due to water level variation inside the water reservoir. The structural displacements were collected only for cases in which the wind presents the same direction. In this way, the wind action was restricted to southeast direction, in order to coincide with the structure’s face with higher area, through which the wind action is supposed to present a greater efect on structure displacements in transversal and longitudinal directions.
1
2
=
k
f
m
p
From the data ofered by bi-axial optic accelerometer, the linear rela-tive displacements of the elevated reservoir were obtained accord-ing to expression (8), where s(t) is the displacement in function of the time and a(t) represents the acceleration in function of the time.
(8)
The natural frequency spectrums of the elevated reservoir for each direction (D1 and D2) were obtained by the Fourier transform (9), where ω = 2πf.
(9)
( )
( )
-=
ò
i tX
¥f t e dt
w ¥w
From analysis of a large data set, were selected the wind actions described in A and B, as shown in the [Table 1]. In D1 direction (transversal) the values of natural frequencies in the situation A and B presented the same frequency value, namely 0.900 Hz. However, taking into account the greater length of D2 (longitudinal direction) relative to D1, the possible mass variation inluenced by changes in the water level presented inluence in the natural fre-quency value, respectively 0.787 Hz and 0.793 Hz. The spectrums of the natural frequency collected are shown in [Figure 2], where A and B represent the wind behavior and D1 and D2 are transversal and longitudinal direction of the water reservoir respectively. It is also important to refer that for each measurement realized were considered 105 s of data record time, that correspond to 200.000 acceleration points. Once the acceleration spectrum was known, the velocity and structural relative displacements in the transversal and longitudinal directions were obtained and considered in func-tion of the time, as can be seen by [Figure 3].
In terms of data processing of structural relative displacements, the maximum values of structural displacements in both directions were obtained and processed as absolute values [Figure 4]. Then, a new data set was obtained and these values were employed in this work for evaluation of the reliability index.
Based in the relative displacements of the elevated reservoir under wind action, for both wind conditions A and B, and also based in the relations stablished by expression (7), the structure presents a higher stifness in the direction D2, for which smaller values of natural frequency already were expected.
4. Structural reliability assessment
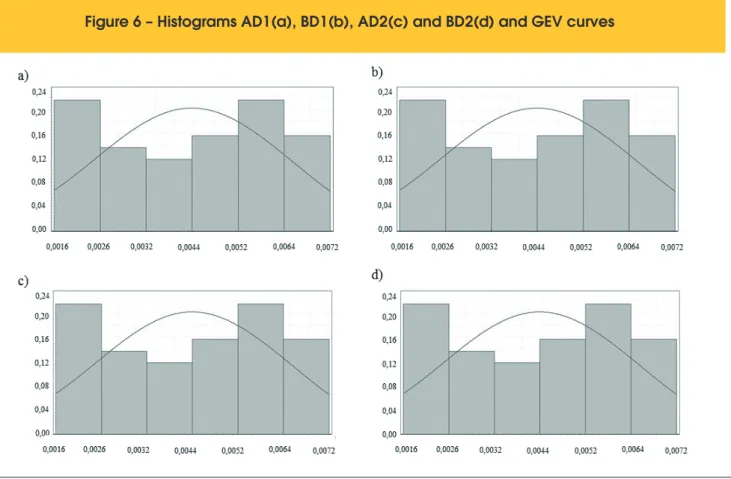
From the maximum relative displacements in both directions D1 and D2, were obtained the histograms showed in the [Figure 5]. The histograms AD1 and BD1 refer to maximum displacements in the transversal direction, and the histograms AD2 and BD2 refer to maximum displacements in the longitudinal direction of the water reservoir, for wind characteristics according to condi-tion A and B. The direccondi-tion D1 presents a more sensibility to wind action than the direction D2, for example, for wind velocity of 10.3
Table 1 – Wind characterization for situations A and B and measures
of natural frequencies of the water reservoir
Identification Data Wind velocity
(m.s-1) Wind direction
Natural frequency (Hz)
Transversal direction
Longitudinal direction
A 18/09/2014 8,9 SE 0,9 0,787
m/s in the SE direction the D1 maximum displacement is close of 0.0225 m, while in the D2 direction the maximum displacement is close of 0.0125 m. In fact, this maximums displacement values represent that the D1 direction is 180% more sensible to wind action than D2 direction.
In order to consider the frequency distribution of the maximum val-ues of relative displacement of the elevated reservoir were drawn GEV curves, as can be seen in the [Figure 6]. Once the values of average μ and standard deviation δ for a data set of X were calculated, the values of α and u were found based in the expres-sions (5) and (6) and then employed in the expression (4) aiming the deinition of the probabilistic function Fx(x). Finally the failure probabilities Pf were evaluated and the values of reliability index β were found using expression (3), where R was adopted as 0.03 m, in accordance with the maximum limit displacement allowed for a structure deined by ABNT NBR 15575 [1].
In the [Figure 7] the reliability indexes β are shown for two direc-tions, D1 and D2, in function of the wind velocity in the southeast direction, in which is perceptible the decreasing in the reliability index according to the increase of the wind velocity. It is noted that, when the wind velocity changes from 8.9 m/s to 10.8 m/s in the direction D1 the β values change 5.781 to 2.799. In relation to D2
direction, for the same variation in the wind velocity the β values present a variation 7.023 to 6.004. This variation represents that when the wind velocity changes from 8.90 m/s to 10.80 m/s in the D2 direction the failure probability increases 14.50%. However, the increase in the failure probability is more dramatic in the D1 direc-tion, where it is observed that the wind velocity increase represents a 51.56% greater chance of structural failure, essentially by dis-placements from wind action.
The reliability indexes β found by applying the proposed methodol-ogy for structural reliability assessment presented moderated val-ues and this highlights the necessity of continuous monitoring of the water reservoir. Were found the β values of 5.438 to 8.9 m/s and 2.713 to 10.3 m/s in the direction D1. Now, in the direction D2 were found the values of β of 6.136 to 8.9 m/s and 4.92 to 10.3 m/s. Nonetheless, the reliability indexes β found by the application of GEV present conident results (Kolmogorov-Smirnof < 0.05). By expressions (10) and (11) a predictive study about the reliability in-dex was performed by employment of the GEV data in the future,
( )
x
T
e
, wheree
x is the extreme value of a random variable, λ and nare constants to be determined according to data measured by statistic or graphic methods, T is the return period and ζ (s, t) is the ration be-tween of the GEV data in the future,
e
x( )
T
, and theFigure 2 – Natural frequency collected for A and B wind behavior
0,01 0,1 1 10
0,0 0,2 0,4 0,6 0,8 1,0 1,2 1,4
0,01 0,1 1 10
0,0 0,2 0,4 0,6 0,8 1,0 1,2 1,4
0,01 0,1 1 10
0,0 0,1 0,2 0,3 0,4 0,5 0,6
0,01 0,1 1 10
0,0 0,1 0,2 0,3 0,4 0,5 0,6
AD1
Po
w
er
am
pl
itu
de
Frequency (Hz)
0,787 Hz AD2
Po
w
er
am
pl
itu
de
Frequency (Hz)
0,900 Hz
BD1
Po
w
er
am
pl
itu
de
Frequency (Hz)
0,793 Hz BD2
Po
w
er
am
pl
itu
de
Frequency (Hz)
maximum values of
1, 2, 3,
e
i(
i
=
…
k
)
. For conservativeconsider-ations when the ζ (s, t) value is less than 1., it should be assigned as 1.0.
(10)
( )
= -
. ln ln (1
é
ê
-
-
1
ù
ú
ë
û
x
T
n
T
e
l
(11)
(
)
(
( )
)
1 2 3
,
max
, ,
=
=
¼
xk
T
s t T
e
z
e e e
e
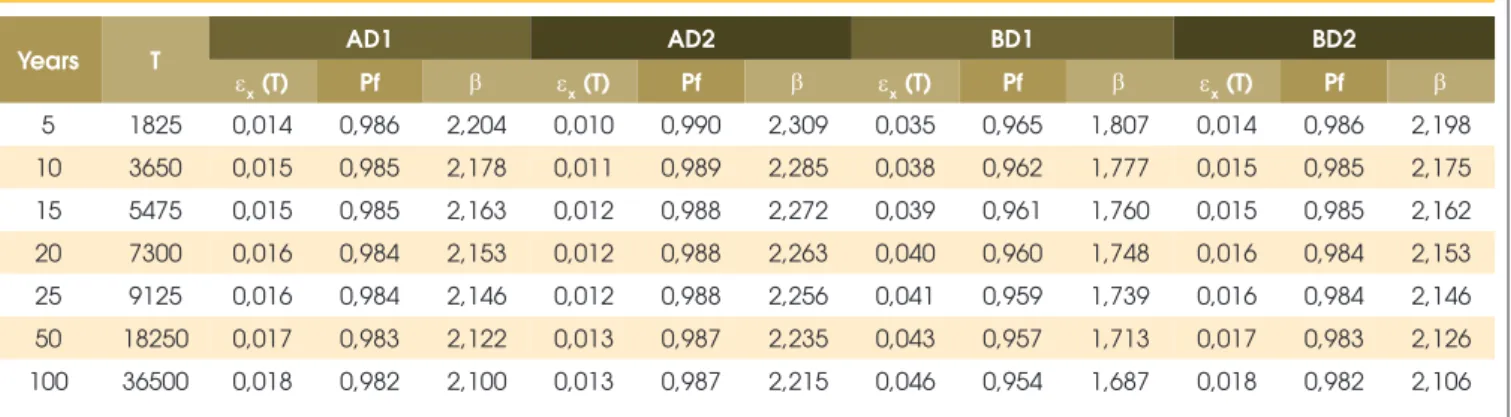
For the predictive reliability analysis, it was estimated that the annual number of times the water elevated reservoir is under conditions A and B is of 365. This way, for the next t years it will be T = 365 X t. [Figure 8] shows the results of the predictive reliability analysis for the next 5, 10, 15, 20, 25, 50 and 100 years. The details of the predictive analysis are shown in [Table 2]. It is important to highlight that in this study the decreases in the reliability index, β, are associated with the predicted maximum displacements provoked by wind actions. However, for a most accurate reliability prediction the results presented by Figure 8 should be associated with the water reservoir deterioration analysis.
5. Conclusions
This work presents a reliability monitoring system based on
Figure 3 – Spectra of acceleration, velocity and relative displacement in the transversal (D1)
and longitudinal directions (D2) of the water elevated reservoir under wind action A and B
-0,08 -0,06 -0,04 -0,02 0,00 0,02 0,04 0,06 0,08 -0,08 -0,06 -0,04 -0,02 0,00 0,02 0,04 0,06 0,08 -0,008 -0,006 -0,004 -0,002 0,000 0,002 0,004 0,006 0,008 -0,008 -0,006 -0,004 -0,002 0,000 0,002 0,004 0,006 0,008
0 20 40 60 80 100
-0,025 -0,020 -0,015 -0,010 -0,005 0,000 0,005 0,010 0,015 0,020 0,025
0 20 40 60 80 100
bi-axial optical accelerometer and a new methodology for reli-ability assessment based on maximum relative displacements. The reliability assessment methodology uses acceleration data provided by an optical sensor implemented in the top of a water reservoir located in the University of Aveiro, which has the aim to make measurements about the structure’s maximum rela-tive displacement indirectly, in the longitudinal and transversal direction. From the maximum displacements collected by the monitoring system, the safety limit value was established and then the reliability indexes calculated. In this perspective, the reliability monitoring system based on bi-axial optical acceler-ometer presented high eiciency and easy implementation in ield, besides a relatively low cost.
The methodology of reliability assessment proposed in this work proved of easy application and adequate to data collecting, espe-cially by utilization of GEV as a way to improve the modeling of the structural behavior induced by action of random variables, as wind velocity, in the case of this work.
The moderate values of β highlight the necessity of attention
Figure 4 – Absolute values of the
maximums relative displacement
0 10 20 30 40 50 60 70 80
0,000 0,005 0,010 0,015 0,020 0,025 0,030
AD1 AD2 BD1 BD2
M
ax
im
um
s
ab
so
lu
te
di
sp
la
ce
m
en
ts
(m
)
Collected data
Figure 5 – Histograms and distributions of maximums displacements
in the directions D1 and D2 for wind situation A and B
0,0000 0,005 0,010 0,015 0,020 0,025 5
10 15 20
25 HISTOGRAM AD1
DATA NUMBER = 51 MEAN = 0,0043
STANDARD DEVIATION = 0,00175 SUM = 0,21922
Fr
eq
ue
nc
y
Maximums displacements (m)
0,0000 0,005 0,010 0,015 0,020 0,025 5
10 15 20
25 HISTOGRAM DATA NUMBER = 78 MEAN = 0,01121
STANDARD DEVIATION = 0,00447 SUM = 0,287454
BD1
Fr
eq
ue
nc
y
Maximums displacements (m)
0,0000 0,005 0,010 0,015 0,020 0,025 5
10 15 20
25 AD2
HISTOGRAM DATA NUMBER = 69 MEAN = 0,00371
STANDARD DEVIATION = 0,00125 SUM = 0,25629
Fr
eq
ue
nc
y
Maximums displacements (m)
0,0000 0,005 0,010 0,015 0,020 5
10 15 20
25 BD2
HISTOGRAM DATA NUMBER = 65 MEAN = 0,0056
STANDARD DEVIATION = 0,00155 SUM = 0,36423
Fr
eq
ue
nc
y
to structural behavior, in terms of transversal and longitudinal displacements, once they present a high probability of exceed-ing the safety limit, especially for natural frequency values near or higher than 0.900 Hz in the transversal direction, and when the wind velocity was equal or higher than 10.80 m/s.
6. Acknowledgements
Esequiel Mesquita acknowledge CAPES Foundation by Doctoral fellowship number 10023/13-5. Paulo Antunes acknowledge the Fundação para a Ciência e Tecnologia (FCT) by Post-doctoral
Figure 6 – Histograms AD1(a), BD1(b), AD2(c) and BD2(d) and GEV curves
Figure 7 – Water reservoir reliability index in function of the wind velocity, for directions D1(a) and D2(b)
9 10
0 2 4 6 8 10
9 10
0 2 4 6 8 10
R
el
ia
bi
lit
y
in
de
x
(D
1)
Wind velocity (m/s) a)
R
el
ia
bi
lit
y
in
de
x
(D
2)
fellowship number SFRH/BPD/76735/2011.
7. References
[1] ABNT, “NBR 15575-2: Ediicaçoes habitacionais - Desem -penho. Parte 2: Requisitos para os elementos estruturais.,” Rio de Janeiro, 2013.
[2] European Comittee for Staandardization, “European Stan-dard 1990: Basis of structural design,” Brussels, 2001. [3] M. S. Laing, D. S. Homa, R. M. Harman, and C. H.
LAM-BERT, “Optical iber sensor and method for adhering an opti -cal iber to a substrate.” Google Patents, 2013.
[4] D. C. Betz, G. Thursby, and B. Culshaw, “Structural Dam -age Location with Fiber Bragg Grating Rosettes and Lamb Waves,” vol. 6, no. 4, pp. 299–308, 2015.
[5] P. Antunes, J. Dias, T. Paixão, E. Mesquita, H. Varum, and P. André, “Liquid level gauge based in plastic optical iber,” Measurement, no. January, 2015.
[6] F. Domingues, T. Paixao, E. Mesquita, N. Alberto, A. Frias,
R. A. S. Ferreira, H. Varum, P. Antunes, and P. Andre, “Liquid hydrostatic pressure optical sensor based on micro-cavity produced by the catastrophic fuse efect,” IEEE Sens. J., 2015.
[7] D. Diamantidis, “Report 32: Probabilistic Assessment of Existing Structures - A publication for the Joint Committee on Structural Safety (JCSS),” RILEM publications, France, 2001.
[8] C. Cremona, Structural Performance: probabilistic-based as-sessment, 1st ed. London: ISTE, 2011.
[9] P. B. R. Dissanayake and P. A. K. Karunananda, “Reliabil-ity Index for Structural Health Monitoring of Aging Bridges,” Structural Health Monitoring, vol. 7. pp. 175–183, 2008. [10] M. Liu, M. Asce, D. M. Frangopol, F. Asce, and S. Kim,
“Bridge System Performance Assessment from Structural Health Monitoring : A Case Study,” J. Struct. Eng., vol. 135, no. June, pp. 733–742, 2009.
[11] P. Antunes, C. A. Marques, H. Varum, and P. S. André, “Bi-axial Optical Accelerometer and High-Angle Inclinometer With Temperature and Cross-Axis Insensitivity,” IEEE Sens. J., vol. 12, no. 7, pp. 2399–2406, 2012.
[12] N. M. Okasha, D. M. Frangopol, D. Saydam, and L. W. Salvi-no, “Reliability analysis and damage detection in high-speed naval craft based on structural health monitoring data,” Struct. Heal. Monit., vol. 10, pp. 361–379, 2010.
[13] A. S. Nowak and A. M. Rakoczy, “Reliability-Based Cali-bration of Design Code for Concrete Structures Load and Resistance Model – General Information,” in 54 Congresso Brasileiro do Concreto, 2012, pp. 1–12.
[14] A. Haldar and S. Mahadevan, Probability, reliability and sta-tistical methods in engineering desing, 1st ed. New York: John Wiley & Sons, 2000.
[15] P. Antunes. Sensores ópticos para monitorização dinâmica de estruturas. Tese de Doutorado. Aveiro: Universidade de Aveiro, 2011.
Figure 8 – Reliability index prediction
for next 100 years
10 100
1,6 1,7 1,8 1,9 2,0 2,1 2,2 2,3 2,4 2,5 2,6
R
eli
ab
ili
ty
in
de
x
pre
di
ct
io
n
Time (Years)
AD1 AD2 BD1 BD2
Table 2 – Predicted values of water reservoir reliability indexes for the next 100 years
Years T AD1 AD2 BD1 BD2
ex (T) Pf b ex (T) Pf b ex (T) Pf b ex (T) Pf b
5 1825 0,014 0,986 2,204 0,010 0,990 2,309 0,035 0,965 1,807 0,014 0,986 2,198
10 3650 0,015 0,985 2,178 0,011 0,989 2,285 0,038 0,962 1,777 0,015 0,985 2,175
15 5475 0,015 0,985 2,163 0,012 0,988 2,272 0,039 0,961 1,760 0,015 0,985 2,162
20 7300 0,016 0,984 2,153 0,012 0,988 2,263 0,040 0,960 1,748 0,016 0,984 2,153
25 9125 0,016 0,984 2,146 0,012 0,988 2,256 0,041 0,959 1,739 0,016 0,984 2,146
50 18250 0,017 0,983 2,122 0,013 0,987 2,235 0,043 0,957 1,713 0,017 0,983 2,126