Predictors of Viral Pneumonia in Patients
with Community-Acquired Pneumonia
Ji Eun Kim, Uh Jin Kim, Hee Kyung Kim, Soo Kyung Cho, Joon Hwan An, Seung-Ji Kang, Kyung-Hwa Park, Sook-In Jung, Hee-Chang Jang*
Department of Internal Medicine, Chonnam National University Medical School, Gwang-ju, Republic of Korea
Abstract
Background:Viruses are increasingly recognized as major causes of community-acquired pneumonia (CAP). Few studies have investigated the clinical predictors of viral pneumonia, and the results have been inconsistent. In this study, the clinical predictors of viral pneumonia were investigated in terms of their utility as indicators for viral pneumonia in patients with CAP.
Methods:Adult patients ($18 years old) with CAP, tested by polymerase chain reaction (PCR) for respiratory virus, at two teaching hospitals between October 2010 and May 2013, were identified retrospectively. Demographic and clinical data were collected by reviewing the hospital electronic medical records.
Results: During the study period, 456 patients with CAP were identified who met the definition, and 327 (72%) patients were tested using the respiratory virus PCR detection test. Viral pneumonia (n560) was associated with rhinorrhea, a higher lymphocyte fraction in the white blood cells, lower serum creatinine and ground-glass opacity (GGO) in radiology results, compared to non-viral pneumonia (n5250) (p,0.05, each). In a multivariate analysis, rhinorrhea (Odd ratio (OR) 3.52; 95% Confidence interval (CI), 1.58–7.87) and GGO (OR 4.68; 95% CI, 2.48–8.89) were revealed as independent risk factors for viral pneumonia in patients with CAP. The sensitivity, specificity, positive- and negative-predictive values (PPV and NPV) of rhinorrhea were 22, 91, 36 and 83%: the sensitivity, specificity, PPV and NPV of GGO were and 43, 84, 40 and 86%, respectively.
Conclusion:Symptom of rhinorrhea and GGO predicted viral pneumonia in patients with CAP. The high specificity of rhinorrhea and GGO suggested that these could be useful indicators for empirical antiviral therapy.
OPEN ACCESS
Citation:Kim JE, Kim UJ, Kim HK, Cho SK, An JH, et al. (2014) Predictors of Viral Pneumonia in Patients with Community-Acquired
Pneumonia. PLoS ONE 9(12): e114710. doi:10. 1371/journal.pone.0114710
Editor:James D. Chalmers, University of Dundee, United Kingdom
Received:July 20, 2014
Accepted:November 12, 2014
Published:December 22, 2014
Copyright:ß2014 Kim et al. This is an
open-access article distributed under the terms of the
Creative Commons Attribution License, which permits unrestricted use, distribution, and repro-duction in any medium, provided the original author and source are credited.
Data Availability:The authors confirm that all data underlying the findings are fully available without restriction. All relevant data are within the paper and its Supporting Information files.
Funding:The authors have no support or funding to report.
Introduction
CAP remains a significant cause of morbidity and mortality [1,2]. The
development and application of diagnostic tests with improved sensitivity, such as the polymerase chain reaction (PCR), have led to recognition of the increasing role of respiratory viruses in CAP in all age groups [3]. These common respiratory viruses include influenza, parainfluenza viruses, adenoviruses, coronaviruses, respiratory syncytial viruses (RSV), metapneumoviruses and bocaviruses [4–6]. Evidence of viral infection was detected in 22% of CAP in adults [7]. Moreover, viruses were frequently found in the airways of patients requiring admission to intensive care units (ICU) with pneumonia, and patients with viral and bacterial infections had comparable mortality rates [7–11].
There are a number of studies on the subject of antiviral treatment for viral infections. Several studies showed the efficacy of antiviral agents including oseltamivir, zanamivir, amantadine and ribavirin [10,12–17]. But, the Cochrane review of randomized controlled trials of antiviral agents does not demonstrate efficacy in the treatment of influenza [18]. However, the original studies included in the Cochrane review did not include people with severe underlying disorders or patients with a severe presentation of influenza. For this reason, no conclusion can be made on the efficacy of antiviral treatment for viral pneumonia by the Cochrane review [19]. There is evidence of efficacy in the treatment of influenza pneumonia [20–22], and early empirical antiviral therapy is still recommended in critically ill patients in whom viral pneumonia is suspected [7].
Although viral pneumonia is increasingly recognized as a major cause of CAP and early antiviral therapy can reduce mortality, few studies have investigated the clinical predictors of viral pneumonia, and the results have been inconsistent [23–
26]. Moreover, evaluations of the diagnostic value of any clinical parameters, including sensitivity, specificity, and positive and negative predictive values, have not been performed. Although PCR methods are sensitive and real-time PCR enables rapid results in a clinically relevant time period, use of PCR is sometimes limited in CAP patients due to the associated costs [27]. This highlights the need for clinical predictors of viral infections in patients with CAP.
In this study, we describe the clinical parameters of viral pneumonia that would be useful in the development of diagnostic tests for respiratory viruses and early empirical antiviral treatment in patients with CAP.
Patients and Methods
Ethics statement
Patients
Adult patients ($18 years old) with CAP, who had tested for respiratory viruses by PCR in hospitalized patients and out-patients at Chonnam National University Hospital (900 beds, Gwang-ju, Republic of Korea) and Chonnam National University Hwasun Hospital (600 beds, Hwasun, Republic of Korea) between October 2010 and May 2013, were retrospectively identified. A case report form (CRF) was recorded at the time of admission for all pneumonia patients, which included clinical symptoms, underlying diseases, vital signs, CURB-65 score (the confusion, urea, respiratory rate, blood pressure, and aged 65 years or over score), and score on the pneumonia severity index (PSI). We reviewed the CRF which was stored in the hospital’s electronic medical records.
Definition
Pneumonia was defined as an acute illness with radiographic pulmonary
infiltration, with at least one of the following being present: fever .38
˚
C, WBC.12,000/mm3or,6,000/mm3, and change in the mental status in elderly patients over the age of 70 years [24]. CAP is defined as pneumonia acquired outside a hospital or long-term care facility. It occurs within at least 48 hours of hospital admission or in a patient presenting with pneumonia who does not have any of the characteristics of health care-associated pneumonia (i.e., hospitalized in an acute care hospital for two or more days within 90 days of infection; residing in a nursing home or long-term care facility having received recent intravenous antibiotic therapy; undergoing chemotherapy; chronic dialysis within the past 30 days; or wound care within the past 30 days of the current infection). The exclusion criteria were solid organ transplantation and anyone with a diagnosis of active tuberculosis or a fungal infection [28]. In this study, the viral pneumonia was confirmed by respiratory viruses multiplex PCR using respiratory specimens of the patients. Classification of radiologic findings was three types by chest computerized tomography (CT) confirmed by one clinician and two radiologists; lobar consolidation, centrilobular nodule, GGO.
Viral pneumonia was diagnosed using the Influenza Antigen Rapid Test kit (SD BIOLINE, Young-in, Republic of Korea), the Anyplex II RV16 detection kit (Seegene, Seoul, Republic of Korea), or a multiplex virus RT-PCR. Viruses that can be diagnosed using the above equipment include influenza viruses A and B; adenoviruses; RSV A and B; parainfluenza viruses 1, 2, and 3; coronaviruses 229E, NL63, and OC43; metapneumoviruses; rhinoviruses; enteroviruses; and boca-viruses. This test is generally done using specimens from nasopharyngeal/ oropharyngeal swabs, sputum, or transtracheal aspirate. The sensitivity and the specificity of the multiplex PCR kit used in this study are reported to be 95.2% and 98.6% [29].
sampling was taken at the time of admission before antimicrobial treatment commenced.
Statistical analyses
Categorical variables were compared using Fisher’s exact test or the Pearson x2
test, and continuous variables were compared using Student’s t-test or Mann-Whitney U-test, as appropriate. Multivariate analyses were performed using the logistic regression model in the backward stepwise conditional manner.
All significance tests were two-tailed, andp-values #0.05 were deemed to indicate statistical significance. Statistical analyses were performed using the SPSS software version 21.0 (IBM Corporation, Armonk, NY, USA).
Results
Etiology of CAP
During the study period, 456 patients with CAP were identified who met the definition, and 327 (72%) patients were tested with the respiratory virus PCR. Among the 327 patients, an etiologic diagnosis could be established in 204 cases (62%). In this study, 317 patients were tested using specimens from
nasopharyngeal swabs or sputum, with the exception of 10 patients who were intubated at admission using specimens from transtracheal aspirate.
Among 327 patients, respiratory viruses were detected in 60 (18%) patients, while 250 (76%) patients were diagnosed with non-viral pneumonia with negative PCR results, and 17 (5%) patients were diagnosed as being co-infected with a virus and bacteria. Co-infected patients (n517, 5%) were excluded from the study.
Among the 60 patients with respiratory viruses, influenza viruses was most common (n523, 38%). Other etiological agents included RSV (n59, 15%), rhinoviruses (n57, 12%), coronaviruses (n56, 10%), adenoviruses (n55, 8%), metapneumoviruses (n55, 8%), parainfluenza viruses (n53. 5%) and bocaviruses (n52, 3%).
Among 250 cases of non-viral pneumonia,Streptococcus pneumoniae pathogen was most common (n588, 35%). Other etiological pathogen included
Mycoplasma pneumoniae (n510, 4%),Klebsiella pneumoniae (n57, 3%),
Staphylococcus aureus (n55, 2%), Haemophilus influenza (n55, 2%), Escherichia coli (n53, 1%),Pseudomonas aeruginosa (n52, 1%),Moraxella catarrhalis (n51,
,1%), Proteus mirabilis (n51, ,1%) and Peptostreptococcusspp. (n55, 2%).
Clinical features and outcomes of viral pneumonia compared to
non-viral CAP
between viral and non-viral pneumonia. Viral pneumonia was characterized by a higher frequency of rhinorrhea, compared to non-viral pneumonia (p50.012). There was no significant difference in other symptoms between viral and non-viral pneumonia.
In terms of severity, CURB-65, PSI, ICU admission, mechanical ventilation and 30-day mortality were not significantly different between the two groups.
All of the patients with CAP were treated with empirical antibiotics at admission. After they tested positive for viral PCR, the influenza virus was detected in 23 patients who were given the antiviral agent; oseltamivir (n517) or peramivir (n56).
Table 1.Clinical features and outcomes of 310 patients with viral or non-viral community-acquired pneumonia.
No. (%) of patients
Characteristics Viral Pneumonia (N560) Non-viral Pneumonia (N5250)
P value
Demographic data
Male sex 43 (72) 194 (78) 0.397
Agea 67 (¡14) 70 (¡11) 0.106
Underlying diseases
Diabetes mellitus 12 (20) 50 (20) .0.999
Hypertension 15 (25) 77 (31) 0.433
Cancer 14 (23) 45 (18) 0.362
Chronic obstructive lung disease 12 (20) 79 (32) 0.084
Ischemic heart disease 7 (12) 21 (8) 0.452
Cerebral vascular accident 2 (3) 14 (6) 0.746
Chronic kidney disease 1 (2) 13 (5) 0.319
Symptoms
Fever 41 (68) 152 (61) 0.373
Cough 43 (72) 149 (60) 0.103
Sputum 31 (52) 134 (54) 0.886
Rhinorrhea 13 (22) 23 (9) 0.012
Dyspnea 22 (37) 112 (45) 0.310
Chest pain 3 (5) 26 (10) 0.228
Diarrhea 4 (7) 12 (5) 0.523
Severity and Outcomes
CURB-65b 1.3 (1, 2) 1.4 (1, 2) 0.094
PSIb 97 (68, 116) 102 (73, 126) 0.188
ICU admission 8 (13) 44 (18) 0.564
Mechanical ventilation 10 (17) 30 (12) 0.390
30-day mortality 10/58 (17) 38/249 (15) 0.843
30-day attributable mortality 9/58 (16) 38/249 (15) .0.999
Continuous variables were expressed as means¡SDsaor medians (IQRs)band were compared by the Student’s t testaor Mann-Whitney U testb. CURB-65: Confusion-Urea-Respiratory-Blood pressure-65 score, PSI: Pneumonia severity index, ICU: Intensive care unit.
Laboratory and radiological findings of viral pneumonia compared
to non-viral community-acquired pneumonia
The laboratory and radiological findings of CAP resulting from viruses or bacteria are shown in Table 2. Viral pneumonia was associated with a significantly higher lymphocyte fraction in the white blood cells, and significantly lower serum creatinine levels than non-viral pneumonia (p,0.05, each). However, no
significant differences were found in the total white blood cell counts (WBC) and C-reactive protein (CRP).
All of the patients underwent a chest CT. The GGO radiology pattern on chest CT was more frequently observed in viral than non-viral pneumonia (p,0.01).
Clinical features and outcomes, laboratory and radiological
findings of influenza pneumonia compared to pneumococcal
pneumonia
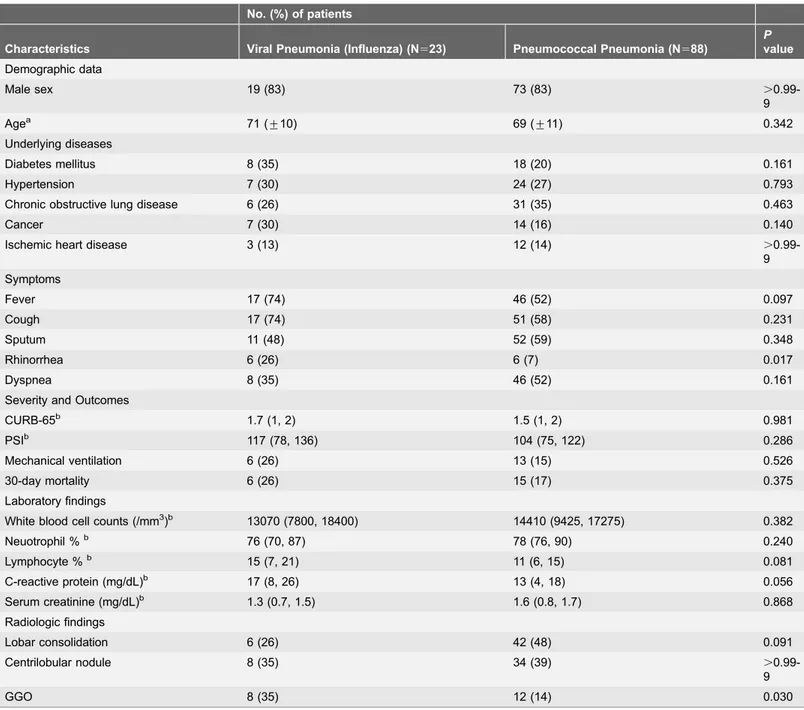
No differences were found in terms of age and gender ratio between influenza and pneumococcal pneumonia (Table 3). In terms of severity, the CURB-65 score, PSI, mechanical ventilation and 30-day mortality were not significantly different between the two groups (Table 3). However, influenza pneumonia was associated with significantly higher rates of rhinorrhea, and GGO on radiological findings than pneumococcal pneumonia (p,0.05, each).
Independently associated factors and predictors of viral
pneumonia in patients with CAP
Independently associated factors of viral pneumonia in patients with CAP are shown inTable 4. Rhinorrhea (OR 3.52; 95% CI, 1.58–7.87) and GGO (OR 4.68; 95% CI, 2.48–8.89) were seen as independent risk factors for viral pneumonia in patients with CAP.
The sensitivity, specificity, PPV and NPV of rhinorrhea were 22%, 91%, 36% and 83%, respectively. The sensitivity, specificity, PPV and NPV of GGO were and 43%, 84%, 40% and 86%, respectively. Fig. 1 shows the Receiver operating characteristics (ROC) curves for rhinorrhea, GGO and rhinorrhea or GGO for predicting viral pneumonia CAP. The resulting of Area under the curves (AUCs) were 0.562 (95% CI, 0.477–0.647) for rhinorrhea, 0.639 (95% CI, 0.555–0.723) for GGO, and 0.672 (95% CI, 0.592–0.751) for GGO or rhinorrhea.
Because the etiologic role of rhinoviruses, coronaviruses, and bocaviruses in patients with CAP is still in debate [30,31], we analyzed the data after excluding patients who were tested using a PCR and shown to have rhinoviruses,
Discussion
In this study, rhinorrhea and the GGO radiologic pattern were independently associated with viral pneumonia, and were specific predictors of viral pneumonia in patients with CAP.
The use of highly sensitive diagnostic tests in CAP patients increased the number of microbiological diagnoses and enabled identification of viral infection, despite an unknown etiology in ,50% of cases [32]. It is estimated that 100 million cases of viral pneumonia occur each year [30]. The prevalence of viral infection was 22–33% in CAP, and influenza viruses accounted for most cases of viral pneumonia (6–8% of CAP) [7,25,32]. In this study, viral infection was detected in 18% of CAP, slightly lower than reported previously, but influenza pneumonia accounted for 7% of CAP, which is similar to previous reports. The slightly lower value for viral pneumonia is possibly due to a delay in applying the diagnostic tests for the virus because this study was performed across two referral centers, not primary care clinics.
Previous studies have demonstrated that the PSI score, ICU admission, need of mechanical ventilation and mortality rate were not different between bacterial and viral pneumonia [26]. Our results were consistent with previous findings, and no differences in severity of disease and mortality were observed between viral and bacterial CAP.
Previous studies showed some clinical parameters associated with viral
pneumonia in patients with CAP, however, the results were inconsistent; age and an immunocompetent host were associated with viral pneumonia in some studies [33,34], but not in others [25]. The presence of a cough was associated with a higher incidence of viral pneumonia in one study [25], but in another study, it was associated with a lower frequency of a dry cough [26]. Several studies showed that purulent sputum, high fever, chest pain, an altered mental state, and dyspnea
Table 2.Laboratory and radiological findings of 310 cases of viral or non-viral community-acquired pneumonia.
No. (%) of patients
Characteristics Viral Pneumonia (N560) Non-viral Pneumonia (N5250)
P value
Laboratory findings
White blood cell counts (/mm3)a 12985 (7925, 12550) 13946 (9950, 17120) 0.300
Neuotrophil %a 77 (71, 86) 78 (76, 89) 0.239
Lymphocyte %a 13 (7, 18) 11 (5, 14) 0.032
C-reactive protein (mg/dL)a 14 (7, 20) 14 (5, 13) 0.764
Serum creatinine (mg/dL)a 1.1 (0.6, 1.3 ) 1.4 (0.8, 1.5) 0.025
Radiologic findings
Lobar consolidation 17 (28) 111 (44) 0.028
GGO 26 (43) 39 (16) ,0.001
Centrilobular 17 (28) 100 (40) 0.104
Continuous variables were expressed as medians (IQRs)aand were compared by Mann-Whitney U testa. GGO: Ground-glass opacity.
were present in similar proportions to non-viral pneumonia [24–26]. In this study, none of the above parameters were associated with, or were predictive of, viral pneumonia. Only rhinorrhea was associated with a viral etiology.
Some studies showed that WBC and CRP were increased significantly in individuals with bacterial pneumonia, compared with viral pneumonia [4,7,35]; however, in another study, WBC count and CRP levels were not different between
Table 3.Clinical features, outcomes, laboratory and radiological findings of influenza pneumonia, compared to pneumococcal pneumonia.
No. (%) of patients
Characteristics Viral Pneumonia (Influenza) (N523) Pneumococcal Pneumonia (N588)
P value
Demographic data
Male sex 19 (83) 73 (83) .
0.99-9
Agea 71 (¡10) 69 (¡11) 0.342
Underlying diseases
Diabetes mellitus 8 (35) 18 (20) 0.161
Hypertension 7 (30) 24 (27) 0.793
Chronic obstructive lung disease 6 (26) 31 (35) 0.463
Cancer 7 (30) 14 (16) 0.140
Ischemic heart disease 3 (13) 12 (14) .
0.99-9 Symptoms
Fever 17 (74) 46 (52) 0.097
Cough 17 (74) 51 (58) 0.231
Sputum 11 (48) 52 (59) 0.348
Rhinorrhea 6 (26) 6 (7) 0.017
Dyspnea 8 (35) 46 (52) 0.161
Severity and Outcomes
CURB-65b 1.7 (1, 2) 1.5 (1, 2) 0.981
PSIb 117 (78, 136) 104 (75, 122) 0.286
Mechanical ventilation 6 (26) 13 (15) 0.526
30-day mortality 6 (26) 15 (17) 0.375
Laboratory findings
White blood cell counts (/mm3)b 13070 (7800, 18400) 14410 (9425, 17275) 0.382
Neuotrophil %b 76 (70, 87) 78 (76, 90) 0.240
Lymphocyte %b 15 (7, 21) 11 (6, 15) 0.081
C-reactive protein (mg/dL)b 17 (8, 26) 13 (4, 18) 0.056
Serum creatinine (mg/dL)b 1.3 (0.7, 1.5) 1.6 (0.8, 1.7) 0.868
Radiologic findings
Lobar consolidation 6 (26) 42 (48) 0.091
Centrilobular nodule 8 (35) 34 (39) .
0.99-9
GGO 8 (35) 12 (14) 0.030
Continuous variables were expressed as means¡SDsaor medians (IQRs)band were compared by the Student’s t testaor Mann-Whitney U testb
CURB-65: Confusion-Urea-Respiratory-Blood pressure-65 score, PSI: Pneumonia severity index, GGO: Ground-glass opacity.
viral and non-viral CAP [26]. We found no differences in WBC count and CRP levels between viral and non-viral CAP, and these parameters were not helpful in differentiating the two. Univariate analysis showed that viral pneumonia was associated only with a significantly lower concentration of serum creatinine and a
Table 4.Independently associated factors for viral pneumonia in patients with community-acquired pneumonia.
Risk Factor
Logistic regression analysis without variable selection
Logistic regression analysis with backward conditional variable selection
OR 95% CI Pvalue OR 95% CI Pvalue
Lower Upper Lower Upper
Rhinorrhea 3.59 1.59 8.10 0.002 3.52 1.58 7.87 0.002
Lymphocyte % 1.01 0.98 1.04 0.436
Creatinine 0.63 0.39 1.02 0.629
GGO 4.35 2.27 8.34 ,0.001 4.68 2.46 8.89 ,0.001
GGO: ground glass opacity.
doi:10.1371/journal.pone.0114710.t004
Fig. 1. Receiver operating characteristics (ROC) curves of rhinorrhea and ground glass opacity in chest imaging as a predictor of viral pneumonia in 310 patients with community-acquired pneumonia.GGO: ground glass opacity. Area under the curve: (a) rhinorrhea, 0.562 (95% CI, 0.477–0.647); (b) GGO, 0.639 (95% CI, 0.555–0.723); (c) GGO or rhinorrhea, 0.672 (95% CI, 0.592–0.751).
higher lymphocyte fraction than non-viral pneumonia; however, multivariate analysis revealed no differences in these parameters between viral and non-viral CAP. Serum creatinine level was also not associated with viral pneumonia.
Previous studies suggested that radiology imaging of viral pneumonia was not predictive of its origin, because both bacteria and viruses could induce a broad range of changes on radiographic images of the chest [7,36,37]. However, it was suggested that viral pneumonia should be considered when multifocal GGO findings are observed [38]. Previous studies did not evaluate the sensitivity, specificity, PPV and NPV of the radiology findings for viral pneumonia in patients with CAP, in terms of which parameters were of help in the clinical decision to commence antiviral treatment. In our study, GGO was not sufficiently sensitive to detect viral pneumonia (indicating that other radiology findings are also commonly present in viral pneumonia) but was highly specific for viral pneumonia in patients with CAP. In our study, an AUC of 0.672 may not be sufficient for a clinical decision. However, there are no other clinical parameters that are preferable or useful for making decisions concerning empirical antiviral agents in clinical practice, although such parameters are badly needed. In our study, 73 patients had rhinorrhea or GGO, but only 10 (14%) of those patients were treated with antiviral drugs empirically, while 25 (40%) of the remaining 63 patients with rhinorrhea or GGO were diagnosed with viral pneumonia and were not treated with empirical antiviral agents.
In conclusion, symptom of rhinorrhea and GGO on radiology findings were independently associated with viral pneumonia. The sensitivity of these
parameters was low, which suggests that all patients with CAP should be tested for viral pneumonia. However, the high specificity of rhinorrhea and GGO suggests that these could be useful clinical indicators for empirical antiviral therapy such as oseltamivir, zanamivir, peramivir, and/or ribavirin for the patients with CAP [7], especially in severe or rapidly progressing cases.
Supporting Information
S1 Table. Clinical features and outcomes of 295 patients with viral or non-viral community-acquired pneumonia.Continuous variables were expressed as means
¡SDsaor medians (IQRs)band were compared by the Student’s t testaor Mann-Whitney U testb. CURB-65: Confusion-Urea-Respiratory-Blood pressure-65 score, PSI: Pneumonia severity index, ICU: Intensive care unit.
doi:10.1371/journal.pone.0114710.s001 (DOCX)
S2 Table. Laboratory and radiological findings of 295 cases of viral or non-viral community-acquired pneumonia. Continuous variables were expressed as medians (IQRs)a and were compared by Mann-Whitney U testa. GGO: Ground-glass opacity.
doi:10.1371/journal.pone.0114710.s002 (DOCX)
S3 Table. Independently associated factors for viral pneumonia in patients with community-acquired pneumonia. GGO: ground glass opacity.
doi:10.1371/journal.pone.0114710.s003 (DOCX)
Acknowledgments
Disclaimer: There were no conflicts of interest, and no financial support was received for this study.
Presented in part: ID Week 2014, Philadelphia, October 8–12, 2014 (abstract no. 792).
Author Contributions
Conceived and designed the experiments: HCJ. Performed the experiments: JEK. Analyzed the data: JEK HCJ. Contributed reagents/materials/analysis tools: UJK HKK SKC JHA SJK KHP. Wrote the paper: JEK SIJ HCJ.
References
1. Guthrie R(2001) Community-acquired lower respiratory tract infections: etiology and treatment. Chest 120: 2021–2034.
3. Templeton KE, Scheltinga SA, van den Eeden WC, Graffelman AW, van den Broek PJ, et al.(2005) Improved diagnosis of the etiology of community-acquired pneumonia with real-time polymerase chain reaction. Clin Infect Dis 41: 345–351.
4. Jennings LC, Anderson TP, Beynon KA, Chua A, Laing RT, et al. (2008) Incidence and characteristics of viral community-acquired pneumonia in adults. Thorax 63: 42–48.
5. Zhou W, Lin F, Teng L, Li H, Hou J, et al.(2013) Prevalence of herpes and respiratory viruses in induced sputum among hospitalized children with non typical bacterial community-acquired pneumonia. PLoS One 8: e79477.
6. Sandrock CE(2008) Severe febrile respiratory illnesses as a cause of mass critical care. Respir Care 53: 40–53; discussion 53–47.
7. Ruuskanen O, Lahti E, Jennings LC, Murdoch DR(2011) Viral pneumonia. Lancet 377: 1264–1275.
8. Hong HL, Hong SB, Ko GB, Huh JW, Sung H, et al.(2014) Viral infection is not uncommon in adult patients with severe hospital-acquired pneumonia. PLoS One 9: e95865.
9. Choi SH, Hong SB, Ko GB, Lee Y, Park HJ, et al. (2012) Viral infection in patients with severe pneumonia requiring intensive care unit admission. Am J Respir Crit Care Med 186: 325–332.
10. Pavia AT(2013) What is the role of respiratory viruses in community-acquired pneumonia?: What is the best therapy for influenza and other viral causes of community-acquired pneumonia? Infect Dis Clin North Am 27: 157–175.
11. An JH, Kim HN, Choi OJ, Kim GS, Kim UJ, et al.(2013) Was 2009 Pandemic Influenza A (H1N1) Mild Among Pregnant Korean Women? Chonnam Med J 49: 96–99.
12. Ison MG(2013) Clinical use of approved influenza antivirals: therapy and prophylaxis. Influenza Other Respir Viruses 7 Suppl 1: 7–13.
13. McGeer A, Green KA, Plevneshi A, Shigayeva A, Siddiqi N, et al. (2007) Antiviral therapy and outcomes of influenza requiring hospitalization in Ontario, Canada. Clin Infect Dis 45: 1568–1575.
14. Sandrock C, Stollenwerk N (2008) Acute febrile respiratory illness in the ICU: reducing disease transmission. Chest 133: 1221–1231.
15. Hong SD, Park SH, Kang SJ, Kwon YS, Kee SJ, et al.(2011) First Fatal Oseltamivir-Resistant 2009 Pandemic Influenza A (H1N1) Case in an Adult in Korea. Chonnam Med J 47: 127–129.
16. Kang SJ, Park KH, Kee SJ, Shin JH, Jung SI, et al.(2013) Virological clearance rate of high-dose oseltamivir or triple-combination antiviral therapy in complicated 2009 pandemic influenza A (H1N1) infection. Jpn J Infect Dis 66: 425–427.
17. Gueller S, Duenzinger U, Wolf T, Ajib S, Mousset S, et al.(2013) Successful systemic high-dose ribavirin treatment of respiratory syncytial virus-induced infections occurring pre-engraftment in allogeneic hematopoietic stem cell transplant recipients. Transpl Infect Dis 15: 435–440.
18. Jefferson T, Jones MA, Doshi P, Del Mar CB, Hama R, et al.(2014) Neuraminidase inhibitors for preventing and treating influenza in healthy adults and children. Cochrane Database Syst Rev 4: CD008965.
19. Leibovici L, Paul M (2014) Should we recommend neuroaminidase inhibitors for influenza? Clin Microbiol Infect.
20. Higuera Iglesias AL, Kudo K, Manabe T, Corcho Berdugo AE, Corrales Baeza A, et al. (2011) Reducing occurrence and severity of pneumonia due to pandemic H1N1 2009 by early oseltamivir administration: a retrospective study in Mexico. PLoS One 6: e21838.
21. Lee N, Choi KW, Chan PK, Hui DS, Lui GC, et al.(2010) Outcomes of adults hospitalised with severe influenza. Thorax 65: 510–515.
22. Muthuri SG, Venkatesan S, Myles PR, Leonardi-Bee J, Al Khuwaitir TS, et al.(2014) Effectiveness of neuraminidase inhibitors in reducing mortality in patients admitted to hospital with influenza A H1N1pdm09 virus infection: a meta-analysis of individual participant data. Lancet Respir Med 2: 395– 404.
24. Musher DM, Roig IL, Cazares G, Stager CE, Logan N, et al.(2013) Can an etiologic agent be identified in adults who are hospitalized for community-acquired pneumonia: results of a one-year study. J Infect 67: 11–18.
25. Huijskens EG, Koopmans M, Palmen FM, van Erkel AJ, Mulder PG, et al.(2014) The value of signs and symptoms in differentiating between bacterial, viral and mixed aetiology in patients with community-acquired pneumonia. J Med Microbiol 63: 441–452.
26. Sangil A, Calbo E, Robles A, Benet S, Viladot ME, et al.(2012) Aetiology of community-acquired pneumonia among adults in an H1N1 pandemic year: the role of respiratory viruses. Eur J Clin Microbiol Infect Dis 31: 2765–2772.
27. You JH, Chan ES, Leung MY, Ip M, Lee NL(2012) A cost-effectiveness analysis of "test" versus "treat" patients hospitalized with suspected influenza in Hong Kong. PLoS One 7: e33123.
28. Singanayagam A, Chalmers JD (2013) Severity assessment scores to guide empirical use of antibiotics in community acquired pneumonia. Lancet Respir Med 1: 653–662.
29. Kim HK, Oh SH, Yun KA, Sung H, Kim MN(2013) Comparison of Anyplex II RV16 with the xTAG respiratory viral panel and Seeplex RV15 for detection of respiratory viruses. J Clin Microbiol 51: 1137– 1141.
30. Cesario TC(2012) Viruses associated with pneumonia in adults. Clin Infect Dis 55: 107–113.
31. Jacobs SE, Lamson DM, St George K, Walsh TJ(2013) Human rhinoviruses. Clin Microbiol Rev 26: 135–162.
32. Johansson N, Kalin M, Tiveljung-Lindell A, Giske CG, Hedlund J(2010) Etiology of community-acquired pneumonia: increased microbiological yield with new diagnostic methods. Clin Infect Dis 50: 202–209.
33. Kim EA, Lee KS, Primack SL, Yoon HK, Byun HS, et al.(2002) Viral pneumonias in adults: radiologic and pathologic findings. Radiographics 22 Spec No: S137–149.
34. Zhang Q, Zhao ZW, Xing ZL, Zhang B, Zheng HF, et al.(2013) Analysis of the risk factors for influenza A (H1N1) pneumonia. Biomed Rep 1: 723–726.
35. Albrich WC, Dusemund F, Bucher B, Meyer S, Thomann R, et al.(2012) Effectiveness and safety of procalcitonin-guided antibiotic therapy in lower respiratory tract infections in "real life": an international, multicenter poststudy survey (ProREAL). Arch Intern Med 172: 715–722.
36. Franquet T(2011) Imaging of pulmonary viral pneumonia. Radiology 260: 18–39.
37. Miller WT Jr, Mickus TJ, Barbosa E Jr, Mullin C, Van Deerlin VM, et al.(2011) CT of viral lower respiratory tract infections in adults: comparison among viral organisms and between viral and bacterial infections. AJR Am J Roentgenol 197: 1088–1095.