article
Diversity Assessment of Lotic Macroalgal Flora by the Application of Taxonomic
Distinctness Index
Aure´lio Fajar Tonetto1,2, Pita´goras Conceic
¸a˜o Bispo
1& Ciro Cesar Zanini Branco1 1
Universidade Estadual Paulista, Departamento de Biologia, Biologia Assis, Sa˜o Paulo, SP, Brazil.
2
Corresponding author: Aure´lio Fajar Tonetto, e-mail:tonettoaf@gmail.com
TONETTO, A.F., BISPO, P.C., BRANCO, C.C.Z.Diversity Assessment of Lotic Macroalgal Flora by the Application of Taxonomic Distinctness Index.Biota Neotropica. 16(1): e0085. http://dx.doi.org/10.1590/1676-0611-BN-2015-0085
Abstract: The main aim of this study was to assess the diversity of four stream algal divisions (Cyanobacteria, Chlorophyta, Ochrophyta and Rhodophyta) by comparing results obtained with taxonomic distinctness index and diversity patterns of previous studies. The data were obtained from a study made in 1000 stream segments in North American biomes. The taxonomic arrangement of the taxa was created from species to division level in order to obtain the taxonomic tree, which is used in taxonomic distinctness index. The results of taxonomic distinctness index showed that stream macroalgal diversity was different from that commonly found. Herein, Ochrophyta was the division with the highest diversity, whereas in previous studies Chlorophyta has been in the first position. Cyanobacteria also presented different results, showing the lowest diversity with taxonomic distinctness index, but it is often one of the most diverse divisions in previous studies. The application of statistical methods should match the research aims and be appropriate to the data set collected. However, different methods can complement ecological analyzes, taking into account what aspect of the community the statistical measure better explains. Keywords: Biodiversity, taxonomic distinctness, macroalgae.
TONETTO, A.F., BISPO, P.C., BRANCO, C.C.Z.Avaliac¸a˜o da Biodiversidade de Macroalgas Lo´ticas pela
Aplicac¸a˜o do I´ndice de Distintividade Taxonoˆmica. Biota Neotropica. 16(1): e0085. http://dx.doi.org/ 10.1590/1676-0611-BN-2015-0085
Resumo: O objetivo deste estudo foi avaliar a diversidade de quatro diviso˜es de algas de riachos (Cyanobacteria, Chlorophyta, Ochrophyta e Rhodophyta), comparando os resultados obtidos com o ı´ndice de distintividade taxonoˆmica com os padro˜es de diversidade encontrados em trabalhos anteriores. Os dados foram coletados a partir de um estudo feito em 1000 segmentos de riachos em biomas da Ame´rica do Norte. O arranjo taxonoˆmico dos ta´xons foi criado a partir do nı´vel de espe´cies ate´ o nı´vel de divisa˜o, a fim de se obter a a´rvore taxonoˆmica, que e´ utilizada no ı´ndice de distintividade taxonoˆmica. Os resultados do ı´ndice de distintividade taxonoˆmica mostraram que a diversidade de macroalgas de riachos foi diferente do que e´ comumente encontrado. Aqui, Ochrophyta foi a divisa˜o com a maior diversidade, enquanto que no estudo original foi a divisa˜o Chlorophyta. Cianobacte´rias tambe´m revelaram resultados diferentes, mostrando a menor diversidade com o ı´ndice de distintividade taxonoˆmica, enquanto e´ frequentemente uma das mais diversas em trabalhos anteriores. A aplicac¸a˜o de
me´todos estatı´sticos deve coincidir com os objetivos da pesquisa e ser apropriada para o conjunto de dados coletados. No entanto, diferentes me´todos podem complementar ana´lises ecolo´gicas, levando em considerac¸a˜o o aspecto da comunidade que a medida estatı´stica melhor explica.
Palavras-chave: Biodiversidade, distintividade taxonoˆmica, macroalgas.
Introduction
In many parts of the world, the scientific community has been producing studies about community ecology of lotic environments (Allan 1995). Stream macroalgae have raised interest because of their important role in the primary pro-duction of such environments (Sheath & Burkholder 1985, Entwisle 1990, Sheath & Cole 1992, Hu & Xie 2006). In previous studies, diversity measures have been used as an important tool for a better understanding of the ecology of such organisms.
A positive characteristic of such index is its independence of the sampling effort, which facilitates the use and comparison of different data types (Clarke & Warwick 1998). Moreover, another aspect emphasized by TDI (and not raised by preceding models) is assigning weight to the taxonomic organization in the statistical analysis, which provides more detailed information about the diversity of communities.
So far, the application of this index has been limited to the assessment of fish biodiversity (Hall & Greenstreet 1998), coral reefs and macrozoobenthos (Piepenburg et al. 1997, Mistri et al. 2000). Therefore, this statistical tool has been little used for algal flora. For instance, Ceschia et al. (2007) is the only study of this nature regarding seaweeds from marine environ-ments. This study has assessed and compared the biodiversity of macroalgae in the Gulf of Trieste at two different times. The main aim of the authors was to assess the possible alterations in community structure owing to changes in environment, particularly those caused by human activities. The results of this study suggest that the level of TDI may have more general validity and, therefore, deserves to be further investigated.
Thus, we aimed to assess the diversity of lotic macroalgal communities in a wide region, applying the TDI, what was never used to assess the diversity of these organisms. Hence, we used data obtained from the taxonomic survey from 1,000 U.S. streams (Sheath & Cole 1992) for the major biomes of North America. We expected that the application of TDI would reveal a different relationship between macroalgal diversity and the North America biomes.
Materials and methods
Investigations on diversity of lotic macroalgae using the TDI, and the reliability of the results of this study, were carried out based on data published in the study by Sheath & Cole (1992). In this study, macroalgae were collected in 1,000 streams of North America, from latitude 73°N to 10°N. The taxonomic survey of this study showed the presence of 259 species of macroalgae, grouped into four divisions (Cyanobac-teria, Chlorophyta, Rhodophyta and Ochrophyta) and accord-ing to their occurrence in each biome. The list of species recorded by Sheath & Cole (1992) was implemented in MicrosoftsOffice Excel program, in the form of two tables,
namely: i) a table of presence/absence of species in each biome (Tundra, Boreal Forest, Conifers Forest, Hardwood-Hemlock Forest, Desert Chaparral, Deciduous Forest, Tropical Rain-forest and Coastal Plain), and ii) a table with the systematic arrangement of the species up to division level. The systematic arrangement used to make this table was based on Wehr & Sheath (2003). For the green algae (Chlorophyta), the taxo-nomic level family was taken away from analysis, since, according to Wehr & Sheath (2003), this taxonomic level is not clearly defined.
The evaluation of diversity of each algal division (Cyano-bacteria, Chlorophyta, Rhodophyta and Ochrophyta) by biome was carried out through the indices of taxonomic distinctness (Dþ
) and variation in taxonomic distinctness (Lþ ) based on qualitative data, as proposed by Warwick & Clarke (1995) and Clarke & Warwick (2001). The assessment of distinctness was performed using equal weights among hierarchical taxonomic levels (W: 111111). The values of Dþ and Lþ
were graphed in accordance with the biomes. This procedure allowed the comparison of the diversity of each algal
division in the habitats studied and also the verification of a possible correlation betweenDþ
andLþ .
Expected distinctness tests were applied in order to compare the results obtained from the TDI for each algal division and biome with expected values (Warwick & Clarke 1998, Clarke & Warwick 1998, 2001). This index is divided in two analyzes: Average Taxonomic Distinctness (AvTD orDþ
) and Variation in Taxonomic Distinctness (VarTD orLþ
). The value of Dþ
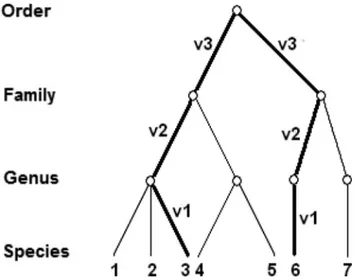
is simply calculated by adding the paths that connect each pair of species in a taxonomic tree divided by the number of paths (Warwick & Clarke 1995). Such paths are assumed to be the steps between each hierarchical level: species to genus, the genus to family, up to the same level of the species pair (Figure 1).
However, Clarke & Warwick (2001) realized that it would be feasible to observe equal values ofDþ
to communities that possess a distinct taxonomic structure, although with the same number of species. The example in Figure 2 suggests that a community with species belonging to several genera and one family may have Dþ
equal to another community with the same number of species, but belonging to a few genera and more families. Such differences in taxonomic structures can be observed by the variability of the distances between pairs in relation to the mean value, which is calculated by Dþ
. The change in the taxonomic distinctness (Lþ
) is simply the variance of the path traveled between the pairs of a taxonomic tree species.
The taxonomic distinctness observed (Dþ
and Lþ ) was compared with a reliance interval of 95%, based on random testing (5,000 randomizations) of the list of species of each algal division. The representation of results from this test can be represented by a funnel-shaped or ellipse chart. Such graphs describe a reliance interval (95%) calculated from the mean values of the index for each subgroup size within the total pool of species of each algal division. In this sense, the actual values of Dþ
andLþ
in the funnel/ellipse will be in the expected diversity limits for that species pool and, as a consequence, the values being positioned below or above the limits of the funnel/ellipse
Figure 1. Example of Taxonomic tree with a sample of 7 species showing the definition for steps (p1 - p6) traveled through hierarchical levels between a pair of species (in this case 3 and 6). A simple average for these paths defines the index of taxonomic distinctness (Dþ
will be understood to have respectively higher and lower than expected range.
All analyses were carried out using PRIMER 5.0 for Windows.
Results
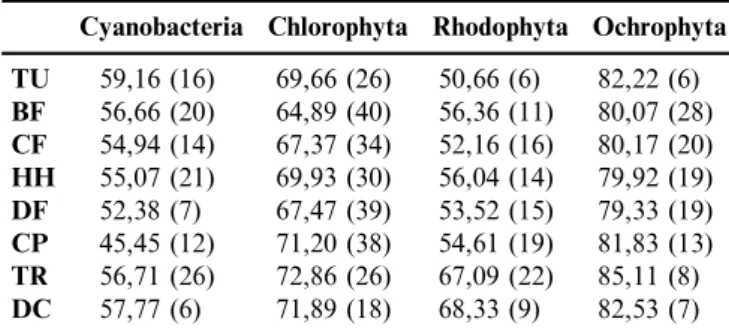
The results showing the numbers of species and the values ofDþ
andLþ
for algal division by biome/region are shown in Tables 1-2 and Figures 3-4.
Cyanobacteria exhibited the highest value ofDþ
(AvTD) in the Tundra biome and the lowest value for Coastal Plain (Table 1, Figure 3). The comparison between observedDþ
and the expected limits based on randomization of subsets from the overall species pool (Figure 4) showed that only Coastal Plain biome recorded values outside the reliance interval of 95%. Furthermore, it was clear that although only the Coastal Plain biome was below the lower limit of the funnel, the index values for the Deciduous Forest, Coniferous Forest and Hemlock-Hardwood Forest were positioned below the global mean of division, while the biomes of Tropical Rainforest and Boreal Forest recorded values near the global average.
Considering the division Rhodophyta, the TDI values showed that Desert Chaparral has the highest diversity for this algal group, whereas Tundra showed the lowest (Table 1, Figure 3). The analysis of the funnel for this algal division showed that, while no biome was outside the limits of the reliance interval, the index values were below the overall
average, except for Tropical Rainforest and Desert Chaparral (Figure 4).
Values of Dþ
for Chlorophyta division showed that maximum diversity of green algae was found in the Tropical Rainforest biome and the lowest one was observed in the Boreal Forest biome (Table 1, Figure 3). Index values were relatively heterogeneous among biomes, which led to an obvious scattering of biomes within and outside the limits of the reliance interval (Figure 4). The biomes of Conifers Forest, Deciduous Forest and Boreal Forest were positioned below the expected limit for the division. Other biomes lie within the funnel, some positioned above the global average and others close to it.
Finally, for Ochrophyta division, the TDI values for all biomes were high. The Tropical Rainforest biome was the one which recorded the highestDþ
, whereas the Deciduous Forest biome the lowest (Table 1, Figure 3). The high values of Dþ showed for this division were reflected in the positioning of all biomes above the global average of species, although included within the limits of reliance interval (Figure 4).
The TDI values for lotic macroalgae communities from the studied biomes in North America showed that the Tropical Rainforest recorded the greatest diversities for two algal divisions (Chlorophyta and Ochrophyta) and also high values for the two other divisions (Table 1). On the other hand, Coastal Plain reported the lowest value of TDI (Cyanobacteria).
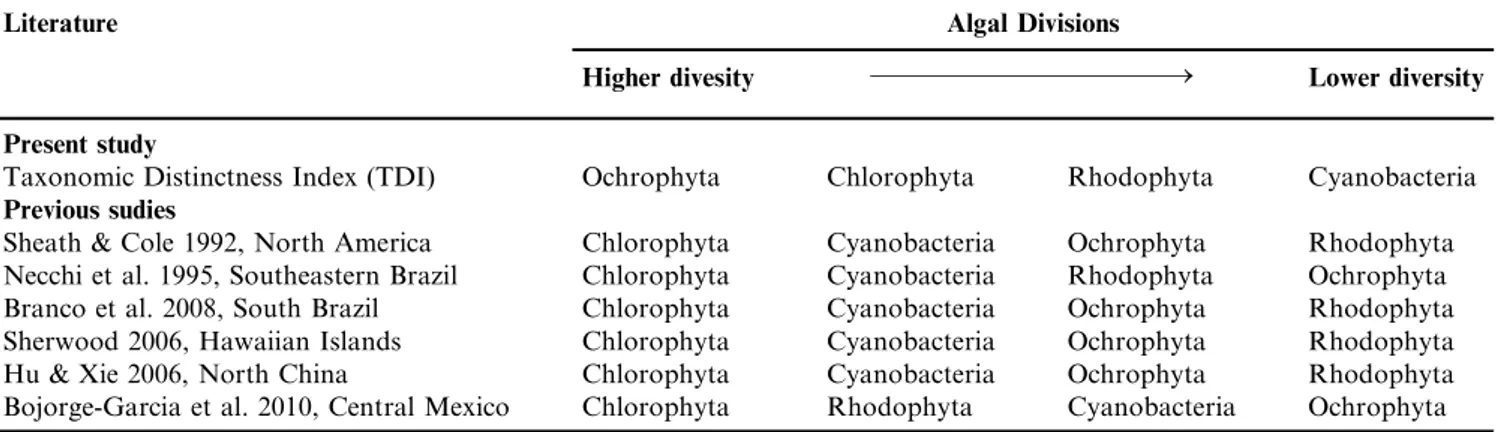
Table 3 shows the comparison between algal division diversity found here (using TDI) and the diversity found in previous studies. It is clear that Ochrophyta and Cyanobacteria changed their position among algal group diversity. While TDI revealed that Ochrophyta exhibited the highest diversity, in previous studies it was typically found as one of the lowest diverse group. Similarly, Cyanobacteria exhibited the lowest diversity regarding TDI analyses, but previously it was the opposite.
Discussion
The results of diversity from TDI found in this study will be discussed considering the main general patterns of stream macroalgal diversity reported in previous studies, including Sheath & Cole (1992) (e.g., Sheath & Burkholder 1985, Branco et al. 2009, Peres et al. 2010).
In general, Chlorophyta is reported as the most diverse division of algae in lotic macroalgae communities around the world (Sheath & Burkholder 1985, Sheath & Cole 1992,
Figure 2.Two examples of taxonomic trees (a and b) in which the index of taxonomic distinctness (Dþ
) is identical, but the variation in taxonomic distinctness (Lþ
) differs substantially, reflecting a large gap between the structure of trees. Figure extracted from Clarck & Warwick (1998).
Table 1.Values ofDþ
and the number of species sampled for each algal division by biome. TU – Tundra, BF – Boreal Forest, CF – Conifers Forest,HH– Hemlock-Hardwood Forest,DF– Deciduous Forest,CP– Coastal Plain,TR– Tropical Rainforest andDC– Desert-Chaparral.
Cyanobacteria Chlorophyta Rhodophyta Ochrophyta
TU 59,16 (16) 69,66 (26) 50,66 (6) 82,22 (6) BF 56,66 (20) 64,89 (40) 56,36 (11) 80,07 (28) CF 54,94 (14) 67,37 (34) 52,16 (16) 80,17 (20) HH 55,07 (21) 69,93 (30) 56,04 (14) 79,92 (19) DF 52,38 (7) 67,47 (39) 53,52 (15) 79,33 (19) CP 45,45 (12) 71,20 (38) 54,61 (19) 81,83 (13) TR 56,71 (26) 72,86 (26) 67,09 (22) 85,11 (8) DC 57,77 (6) 71,89 (18) 68,33 (9) 82,53 (7)
Table 2.Values ofLþ
for each algal division by biome.TU– Tundra,
BF– Boreal Forest,CF– Conifers Forest,HH– Hemlock-Hardwood Forest, DF– Deciduous Forest, CP– Coastal Plain,TR– Tropical Rainforest andDC– Desert-Chaparral.
Cyanobacteria Chlorophyta Rhodophyta Ochrophyta
TU 179,86 282,03 686,22 795,06
BF 221,63 321,14 524,95 631,62
CF 259,42 297,05 628,63 650,84
HH 254,62 285,74 590,94 626,76
DF 325,01 312,79 613,29 771,88
CP 215,02 265,82 771,05 820,41
TR 203,58 200,11 576,43 344,03
Branco et al. 2009, Peres et al. 2010). The same tendency was observed in Sheath & Cole (1992). However, using the TDI, the most diverse algal division was the brown algae. According to several studies involving classic measures of macroalgal diver-sity, Ochrophyta consistently appears as a group with low values of diversity (e.g. Krupek & Branco 2012, Necchi et al. 2003). In this context, our findings suggest that there is a high dispersion of their species along the taxonomic gradient, despite the brown macroalgae of lotic systems, which showed a limited occurrence and distribution.
Similar to Chlorophyta, Cyanobacteria has been considered as one of the most diverse algal group showing recurrently high specific richness (Krupek et al. 2007, Necchi et al. 2003). However, the diversity of Cyanobacteria of North American
streams, when applied the TDI, was the lowest among the four algal divisions analyzed. Although commonly exhibiting high occurrence, the species of this taxonomic group show low taxonomic dispersion, which means that the species found in the study area belong to few taxonomic groups.
Using TDI to investigate the latitudinal distribution of stream macroalgal groups, we observed that the green algae showed a clear latitudinal tendency, with values of diversity increasing from the Arctic to the tropics. This biogeographycal trend shown by Dþ
could not be recognized from the species richness data alone, and it is in complete accordance with increment in irradiance toward the tropics (Hut et al. 2013) and with the preference for a larger quantity of light typically observed for Chlorophyta (Richardson et al. 1983, Necchi Jr. 2004). Furthermore, pigment
Figure 3.Values ofDþ
(~) andLþ
(’) for algal divisions according to the biomes. TU – tundra, BF – Boreal Forest, CF – Conifers Forest, HH – Hemlock-Hardwood Forest, DF – Deciduous Forest, CP – Coastal Plain, TR – Tropical Rainforest, and DC – Desert-Chaparral.
Figure 4.Graphical representation of the values of average taxonomic distinctness (Dþ
contents of the green algae exhibit more efficient physiological activity under high irradiance (DeNicola & Hoagland 1992).
Considering the values of the TDI, we found that the most diverse biome was the Tropical Rainforest, with the highest values for Chlorophyta and Ochrophyta, and very high values for Rhodophyta and Cyanobacteria. This is a relevant result, mainly when confronted with data from species richness, a very common type of information used to describe and discuss stream macroalgal community structure and biogeography (see, for instance, the discussion presented by Sheath & Cole 1992). If only the species richness is considered, Boreal Forest was the North American biome with highest diversity in stream macroalgal communities. It is known that the characteristics of biomes are relevant in determining patterns of diversity and distribution of macroalgae communities (McGregor et al. 2006, Oliveira et al. 2013), but depending on the information used in these analyzes we can end up in different conclusions, even contradictory, as shown in the comparison presented above.
Regarding all results and discussion made herein, we showed that using TDI, algal groups contribute differently on stream macroalgal diversity than showed by previous studies. However, TDI cannot substitute other diversity measurements such as number of species or Shannon diversity (Ceschia et al. 2007). Instead of this, it is important to combine the statistical analyses to the project goals. Warwick & Clarke (2001) made a comparison among statistical analyses, and they found that some methods are more sensitive than others. Thus, in general, the data must be analyzed properly and in consonance to researcher’s questions, what may help to improve the inter-pretation of the information.
More specifically, traditional diversity measures based on species richness and evenness exhibit disadvantages regarding the assessment of biodiversity change on wide spatial and temporal scales (Warwick & Clarke 2001). Hence, measures based on species relatedness (e.g. taxonomic distinctness) rose to overcome these problems and they have been used widely for conservation purposes. Herein, we showed the differences between TDI results and typical lotic macroalgal diversity found previously. So, we suggest that TDI should be used as a complementary measure to species richness, which would favors a more accurate definition of biodiversity conservation priorities (Loidi et al. 2015). For instance, a species without close relations to any others would have higher priority for conservation than a species with many close relatives (Warwick & Clarke 2001).
In this context, it is possible to observe that the application of different diversity measures may reveal different results and conclusions, even based on the same data set. Although species richness have been used to assess the diversity in conservation programs, the taxonomic indices as TDI would help to understand better the general diversity patterns and to improve strategies of biodiversity conservation (Loidi et al. 2015), not only for stream macroalgae. Furthermore, TDI could be used in broad scale geographical comparisons of biodiversity, regarding more ecological questions, mainly those related to contrasting habitats. Finally, we expect that TDI must be further investigated to find application in a broad sense.
Acknowledgements
The authors would like to thanks to FAPESP for financial support granted to AFT (Proc. 2010/17563-0) and to CCZB (Proc. 2014/22952-6); and to CNPq for financial support granted to CCZB (Proc. 302354/2008-5).
References
ALLAN, D.J. 1995. Stream Ecology: structures and functions of run-ning waters. Universidade de Michigan, EUA. Kluwer Academic Publishers.
BRANCO, C.C.Z., KRUPEK, R.A. & PERES, C.K. 2009. Distribu-tion of stream macroalgal communities from the mid-western region of Parana´ State, southern Brazil: Importance of local scale variation. Braz. Arch. Biol. Technol. 52:379–386,http://dx.doi.org/ 10.1590/S1516-89132009000200015.
CESCHIA, C., FALACE, A. & WARWICK, R.M. 2007. Biodiversity evaluation of the macroalgal flora of the Gulf of Trieste (Northern Adriatic Sea) using taxonomic distinctness indices. Hydrobiology 580:43–56,http://dx.doi.org/10.1007/s10750-006-0466-8.
CLARKE, K.R. & WARWICK, R.M. 1998. A taxonomic distinctiness index and its statiscal properties. J. Appl. Ecol. 35:523–531. CLARKE, K.R. & WARWICK, R.M. 2001. A further biodiversity
index applicable to species list: variation in taxonomic distinct-ness. Mar. Ecol. Progr. Ser. 216:265–278,http://dx.doi.org/10.3354/ meps216265.
DENICOLA, D.M. & HOAGLAND, K.D. 1992. Influences of canopy cover on spectral irradiance and periphyton assemblages in a prairie stream. J. North. Am. Benthol. Soc., 11:391–404,http://dx.doi.org/ 10.2307/1467560.
ENTWISLE, T.J. & ANDERSEN, R.A. 1990. A re-examination of Tet-rasporopsis(Chrysophyceae) and the description of Dermatochysis gen.
Table 3. Hierarchical diversity of algal divisions (Cyanobacteria, Chlorophyta, Rhodophyta and Ochrophyta) in the present study (using Taxonomic Distinctness Index) and previous studies (richness).
Literature Algal Divisions
Higher divesity Lower diversity
Present study
Taxonomic Distinctness Index (TDI) Ochrophyta Chlorophyta Rhodophyta Cyanobacteria Previous sudies
Sheath & Cole 1992, North America Chlorophyta Cyanobacteria Ochrophyta Rhodophyta Necchi et al. 1995, Southeastern Brazil Chlorophyta Cyanobacteria Rhodophyta Ochrophyta
Branco et al. 2008, South Brazil Chlorophyta Cyanobacteria Ochrophyta Rhodophyta
Sherwood 2006, Hawaiian Islands Chlorophyta Cyanobacteria Ochrophyta Rhodophyta
Hu & Xie 2006, North China Chlorophyta Cyanobacteria Ochrophyta Rhodophyta
nov. (Chrysophyceae): a monostromatic alga lacking cell walls. Phy-cologia 29:263–274,http://dx.doi.org/10.2216/i0031-8884-29-3-263.1. HALL, S.J. & GREENSTREET, S.P. 1998. Taxonomic distinctness
and diversity measures: responses in marine fish communities. Mar. Ecol. Progr. Ser. 166:227–229.
HU, B.F. & XIE, S.L. 2006. Effect of seasonality on distribution of macroalgae in a stream system (Xinan Spring) in Shanxi Province, North China. Journal of Integrative Plant Biol. 48(8):889–896, http://dx.doi.org/10.1111/j.1744-7909.2006.00317.x.
KRUPEK, R.A., BRANCO, C.C.Z. & PERES, C.K. 2007. Dis-tribuic¸a˜o ecolo´gica das comunidades de macroalgas da bacia de drenagem do Rio das Pedras, regia˜o Centro-Sul do Estado do Parana´, Sul do Brasil. Rev. Bras. Bot. 30(2):173–182.
KRUPEK, R.A. & BRANCO, C.C.Z. 2012. Ecological distribution of stream macroalgae in different spatial scales using taxonomic and morphological groups. Braz. J. Bot. 35(3): 273-280.
LOIDI, J., CAMPOS, J.A., HERRERA, M., BIURRUN, I., GARCI´A-MIJANGOS, I. & GARCI´A-BAQUERO, G. 2015. Eco-geographical factors affecting richness and phylogenetic diversity patterns of high-mountain flora in the Iberian Peninsula. Alpine Botany. 125(2):137–146,http://dx.doi.org/10.1007/s00035-015-0149-z. MISTRI, M., CECCHERELLI, V.U. & ROSSI, R. 2000. Taxonomic
distinctness and diversity measures: responses in lagoonal macro-benthic communities. Ital. J. Zool. 67:297–301,http://dx.doi.org/ 10.1080/11250000009356327.
NECCHI, O.Jr. 1989. Geographical distribution of the genus Batra-chospermum (Rhodophyta, Batrachospermales) in Brazil. Ver. Bras. Biol. 49:663–669.
NECCHI, O.Jr., BRANCO, L.H.Z. & BRANCO, C.C.Z. 2003. Ecolo-gical distribution of stream macroalgal communities from a drainage basin in the Serra da Canastra National Park, Minas Gerais, Southeastern Brazil. Braz. J. Biol. 63:1–12,http://dx.doi.org/10.1127/ 1863-9135/2010/0178-0017.
NECCHI, O.Jr. 2004. Light-related photosynthetic characteristics of lotic macroalgae. Hydrobiologia, 525:139–55, http://dx.doi.org/ 10.1023/B:HYDR.0000038861.18999.7b.
PERES, C.K., BRANCO, C.C.Z. & KRUPEK, R.A. 2010. Long-itudinal distribution and seasonality of macroalgae in a subtropical stream impacted by organic pollution. Acta Limnol. Bras. 22 (2):199–207,http://dx.doi.org/10.4322/actalb.02202009.
PIEPENBURG, D., VOSS, J. & GUTT, J. 1997. Assemblages of sea stars (Echinodermata: Asteroidea) and brittle stars (Echinodermata: Ophiuroidea) in the Weddel Sea (Antarctica) and off Northeast Greend (Arctic): a comparison of diversity and abundance. Pol. Biol. 17:305–322,http://dx.doi.org/10.1007/PL00013372.
RICHARDSON, K., BEARDALL, J. & RAVEN, J.A., 1983. Adap-tation of unicellular algae to irradiance: An analysis of strategies. New Phytol. 93:157–91,http://dx.doi.org/10.1111/j.1469-8137.1983. tb03422.x.
WHER, J.D. & SHEATH, R.G. 2003. Freshwater Algae of North America – Ecology and Classification. Aquatic Ecology Series. HUT, R.A., PAOLUCCI, S., DOR, R., KYRIACOU, C.P. & DAAN,
S. 2013. Latitudinal clines: an evolutionary view on biological rhythms. Proceedings of the Royal Society, http://dx.doi.org/ 10.1098/rspb.2013.0433.
SHEATH, R.G. & BURKHOLDER, J.M. 1985. Characteristics of softwater streams in Rhode Island. II: Composition and seasonal dynamics of macroalgal communities. Hydrobiologia 128:109–118, http://dx.doi.org/10.1007/BF00008730.
SHEATH, R.G. & COLE, K.M. 1992. Biogeography of stream mac-roalgae in North America. J. Phycol. 28:448–460,http://dx.doi.org/ 10.1111/j.0022-3646.1992.00448.x.
WARWICK, R.M. & CLARKE, K.R. 1991. A Comparison of some methods for analysing changes in benthic community structure. J. Mar. Biol. Ass. U. K. 71:225–244,http://dx.doi.org/10.1017/S0025 315400037528.
WARWICK, R.M. & CLARKE, K.R. 1995. New ‘‘biodiversity’’ measures reveal a decrease in taxonomic distinctness with increasing stress. Mar. Ecol. Progr. Ser. 129:301–305.
WARWICK, R.M. & CLARKE, K.R. 1998. Taxonomic distinctness and environment assessment. J. App. Ecol. 35:532–543,http://dx.doi.org/ 10.1046/j.1365-2664.1998.3540532.x.