The Portucel Soporcel Group – The Goodwill treatment
under the International Standards
Mariana Collares Pereira
30-05-2011
Advisor: Professor Paulo Azenhas
Dissertation submitted in partial fulfilment of requirements for the degree of MSc in Business Administration, at Universidade Católica Portuguesa 2011
1 | P a g e
Abstract
The concept of Fair Value is increasingly relevant in the corporate world. For several years that listed companies in Europe and in the U.S. take this concept into consideration when preparing their financial statements, namely when measuring some assets and liabilities such as Financial Assets and Financial Liabilities, Goodwill and Biological Assets. In order to better understand how companies actually fulfill the requirements established by International Standards, this dissertation focuses on the Portucel Soporcel Group and on the accounting treatment of Goodwill, addressing specifically the way the company translates into its financial statements the concept of Fair Value, as well as the methodology used to estimate Goodwill and the corresponding recoverable amount. The Group follows International Standards in the preparation of financial statements and in the treatment of Goodwill, with data being obtained from reliable and renowned sources such as Reuters and being treated in combination with internally generated information, properly validated and periodically revised.
2 | P a g e
Acknowledgements
This thesis would not have been written without the support of my supervisor, Professor Paulo Azenhas, whose availability largely exceeded what his job entailed. I thank him deeply for having shared with me his knowledge and, above all, for his patience and enthusiasm.
I must also acknowledge the kind welcome Eng. Manuel Arouca and Dr. José Perdigão, at Portucel Soporcel, extended to me. Their insights and the information they provided me with were crucial to the development of this study.
Last but not least, this thesis symbolically represents the end of a journey that would have been impossible in the absence of my parents’ financial assistance and of the trust my friends and family have always deposited in me.
3 | P a g e
Table of Contents
ABSTRACT ... 1
ACKNOWLEDGEMENTS ... 2
TABLE OF CONTENTS ... 3
1.INTRODUCTION ... 4
2.LITERATURE REVIEW ... 5
2.1 Fair Value: concept ... 5
2.2 Fair Value: definition ... 7
2.2.1 Fair Value: Application to assets ... 8
2.2.2 Fair Value: Application to Liabilities ... 9
2.3 Fair Value: Valuation Techniques ... 10
2.3.1 Market Approach ... 10
2.3.2 Income Approach ... 11
2.3.3 Cost Approach ... 12
2.4 Fair Value: Hierarchy ... 13
2.4.1 Inputs Hierarchy - Level 1 ... 14
2.4.2 Inputs Hierarchy- Level 2 ... 14
2.4.3 Inputs Hierarchy- Level 3 ... 15
2.5 Fair Value debate ... 16
2.6 Fair Value and Economic Crisis ... 18
2.7 Business Combinations ... 19 2.7.1 The Concept ... 20 2.7.2 Method of accounting ... 20 2.7.3 Disclosure ... 22 2.8 Goodwill ... 23
3.CASE-STUDY: PORTUCEL ... 25
3.1 Industry Analysis ... 26 3.1.1 Production Cycle ... 26 3.1.2 Pulp Industry ... 27 3.1.3 Paper Industry ... 29 3.1.4 Future Trends ... 31 3.2 Company’s Overview ... 32 3.3 Goodwill in Portucel ... 34 3.3.1 Accounting Principles ... 34 3.3.2 Goodwill ... 363.3.3 Impairment tests for Goodwill ... 38
3.3.3.1 Valuation Technique ... 39
3.4 Case-study: Main Conclusions ... 45
4.CONCLUSION ... 49
5.EXHIBITS ... 52
4 | P a g e
1. Introduction
This dissertation centers on understanding the consequences of the adoption of the Fair Value accounting in the financial statements annually presented by companies. In order to do that, after a thorough review of the existing literature, the discussion is applied to Portugal – specifically, to the accounting practices of the Portucel Soporcel Group in the treatment of Goodwill. The first part of this essay consists of the Literature Review, that is, a theoretical analysis of the Fair Value concept and of the Goodwill caption, which will be analyzed in higher detail. Additionally, I explain the origin of the concept and its development. The ultimate aim of this exercise is to show how companies do implement these accounting measurements. I also point out some advantages regarding the use of this accounting method instead of its historically precedent alternative, the Historical Cost method.
In the second chapter, I present the Portucel Soporcel Group and conduct an analysis of the industrial sector it operates in. This is extremely important for the way the concept of Fair Value is implemented. I further explain the transition, in 2005, from the National Standards to International Standards, and its impact on the financial statements of the company. Finally, I study the way Portucel Soporcel Group effectively applies the concept of Fair Value to Goodwill.
In the conclusion, I make a brief summary of the theoretical explanation presented and apply it to the standard practices I have observed at Portucel Soporcel Group. This company resorts to this concept in a way mostly correspondent to International Standards. Accounting estimates are based on reliable entities such as Reuters and complemented by sound internal estimates, periodically revised. The combination of theory and practice sheds light on the importance of the concept of Fair Value and the difficulties it implies.
5 | P a g e
2. Literature Review
2.1 Fair Value: concept
In the early twentieth century, the concept of Fair Value was seen as part of financial accounting. Companies in the United States commonly revalued assets by writing them up or down, in order to illustrate their real value (Fabricant, 1938, in Choy, 2006). Nevertheless, after the Great Depression of 1929, President Franklin Roosevelt decided to abolish this practice, since he believed that the Fair Value accounting had been one of the main causes behind the bankruptcy of American companies (Stein & Wesbury, 2004, in Cascini & DelFavero, 2011). Therefore, the following years witnessed companies shifting from the Fair Value accounting method to its Historical Cost counterpart, based on reliable records (Walker, 1992, in Choy, 2006).
Over the last few decades, accountants, academics and researchers kept questioning what would be the best strategy to use in corporate financial statements, having attempted to assess the advantages and disadvantages of using the Fair Value rather than the Historical Cost approach. A main concern remains the possibility that two distinct companies which account their assets at their Fair Value could represent identical assets with different values, relying on conflicting judgments and assumptions (King, 2009).
Historical Cost supporters argue that the revaluation depends on the manager’s particular judgment, which could mislead investors (Daniels, 1934; Paton & Lettleton, 1940 in Choy, 2006). In addition, Historical Cost is based on observable documented values, thus reinforcing the credibility of corporate accounting (Ijiri, 1975, 1981 in Choy, 2006).On the other hand, Fair Value proponents defend that the main goal of financial statements is to provide investors with a real picture of the company. In their viewpoint, this is only possible if the assets and liabilities are accounted for at their current value. Sapra affirms that the Fair Value accounting is also a more transparent criterion (Sapra, No 09-35).
Also according to Sapra, there are three main ways of achieving transparency; the first one being increasing the number of reports published throughout the year. This methodology allows the homogenization of perceptions among all the interested parties in the market and leads to price efficiency. Secondly, companies should make an effort
6 | P a g e
to obtain more precise descriptions of their operations in the published financial statements. In reality, the only asset that a company can measure precisely is its cash balance. The value of the remaining assets is necessarily calculated through judgments and assumptions that cannot capture all the information available in the market. Finally, the third measure to promote transparency is by implementing the Fair Value accounting, according to which companies have to value their assets and liabilities at the market price or through the best possible estimate of their actual value. The Financial Accounting Standards Board (FASB) states that the main purpose of financial statements is to provide relevance and reliability (FASB No. 2 1980) and that for the information to be reliable it has to be “verifiable, neutral and to have representational faithfulness”.
Despite of all the debate about which measurement should be adopted, companies do not live in a perfect market where there is shared information and participants have a clear insight about the market environment. Therefore it is extremely important to have an accounting measurement which reduces the asymmetry of information between different parties1 (Sapra, No. 09-35).
According to the Securities and Exchange Commission (SEC), it is important to have a norm to use the Fair Value in companies because:
1. “The economy has become dynamic”, so it is essential to have a valuation that takes into account all variations and provide a reliable value. Stakeholders want to know what the real value of the asset is,
2. There were many companies in the U.S that were using wrong estimates providing unreliable values of their assets and liabilities.
For several years, the International Accounting Board Standards (IASB) and the FASB had as primary concern the achievement of a consensus that resulted in the drafting of norms that allow greater transparency in the financial information submitted by companies. Standard SFAS 157 was created in order to establish “consistency and comparability” between companies in the market. The two accounting boards considered that the use of Historical Cost is “out-of-date” and “lacks transparency” and that its replacement by the Fair Value measurement is crucial (Leone, 2008).
1
7 | P a g e
2.2 Fair Value: definition
The International Financial Reporting Standard (IFRS) defines Fair Value as “the amount for which an asset could be exchanged or a liability settled, between knowledgeable, willing parties, in an arm’s length transaction.”
According to the Exposure Draft of May 2009 (SFAS 157), on the other hand, Fair Value is “the price that would be received to sell an asset or paid to transfer a liability in
an orderly transaction between market participants at the measurement date (an exit price)”.
In the SFAS 157 definition, there is a specific reference to an exit price and to a selling price, whilst the IFRS does not explicitly mention an exit price. Another difference between these two definitions revolves around how they determine market participants. In the former, it is directly outlined, while the latter participants are described as “knowledgeable willing parties, in an arm’s length transaction.”
The following analysis is based on the definition of Fair Value contained in the Exposure Draft dated May 2009.
In order to compute the Fair Value of an asset or liability, this document states that a company should consider the specific characteristics of what is being analyzed. These can be based on the “unit of account” on the Group of assets or liabilities. The focus here is on assets and liabilities because they are the primary subject of accounting measurements (SFAS 157).
The same norm contends additionally that the transaction market for a specific asset can vary from company to company, depending on which market is the most advantageous (paragraph 9).
The orderly transaction notion is also an important element in this context, explained as “an orderly transaction (…) that assumes exposure to the market for a period before the measurement date”. The reason for this is that the value of a specific asset or liability should not be manipulated, in the same way the transaction should not be “forced” (paragraph 7).
8 | P a g e
Market participants are defined in paragraph 10, which says that they should be independent from the company and possess some knowledge about the asset or liability, besides being able to make an agreement in an environment of free deliberation.
Furthermore, the selling price should be directly observable or, in the absence of that possibility, derive from the best estimate calculated by the company. The price should include the transaction costs that are valid in other relevant IFRSs as well (paragraphs 15-16).
2.2.1 Fair Value: Application to assets
“An asset is a resource controlled by an entity as a result of past events and from which future economic benefits are expected to flow to the entity” ( IAS 38).
According to the Exposure Draft of May 2009, the Fair Value measurement considers that the economic benefit of an asset results from the “highest and best use” by the market participant, assuming that this use is “physically possible, legally permissible and financially feasible at the measurement date” (paragraph 17).
The highest and best use of an asset is determined by considering that an independent market participant and a company only need to conduct further inquiries regarding other uses of the asset if there is evidence that the current one is not the highest and
best use (paragraph 18).
Under this assumption there are two possible valuation premises for accounting an asset: by its value in-use or by its value in-exchange.
The value in-use premise assumes the perspective of the buyer. The purchase price for a specific asset is what the buyer understands that he or she will gain from its production capacity (King, 2006).
The value in-exchange reasoning proposes that the Fair Value of a specific asset is “the price that would be received in a current transaction to sell the asset to market participants who would use the asset on a stand-alone basis” (paragraph 22).
Both premises take for granted that the asset is sold individually, and not as part of a group of assets.
9 | P a g e
In the specific case of financial assets, only the value in-exchange premise should be used, given that it reflects any benefits that “would derive from holding that asset in a diversified portfolio” (paragraph 24).
King (2006) writes that the valuation that should primarily be taken into consideration is the value in-use premise since it “reflects the actual economics of the specific transaction”. However, the same author points out that for the FASB it is preferable to value assets conforming to the in-exchange premise, because this technique places more emphasis on market participants and on market transactions.
The choice of one premise over the other may have a significant impact in the reported income. For example, if a company accounts for a fixed asset under the in-use premise, it will increase the amount of depreciations and, consequently, decrease the earnings reported for that year (King, 2006).
2.2.2 Fair Value: Application to Liabilities
A Liability is defined as “an obligation of an entity arising from past transactions or events, the settlement of which may result in the transfer or use of assets, provision of services or other yielding of economic benefits in the future” (IASB).
The Exposure Draft indicates that when measuring a liability the company should assume that it could be or have been “transferred to the market participant at the measurement date”.
The same document states that, if there is no active market for the liability, the value that a company should recognize must be the same as the value of the corresponding asset. When there is an active market for that asset, the price of the asset represents the Fair Value of the liability. However, in the case where the observable price includes “third-party credit enhancement”, companies must adjust that value (paragraph 27). The Fair Value of a liability reflects the non-performance risk. This risk may change throughout the useful life of the liability and represents the degree of probability of the company not fulfilling the obligation. This risk includes credit and other factors that may influence the non-fulfillment of a certain obligation.
10 | P a g e
2.3 Fair Value: Valuation Techniques
There are three main ways of reaching an asset or liability’s Fair Value; a company should use the technique that best suits the circumstances that occur at a given period. It should consider the data availability, the observable and unobservable inputs as well as periodically revise the techniques used in order to understand if its approach remains the most appropriate one (Exposure Draft of May 2009).
Observable inputs are “developed on the basis of available market data and reflect the assumptions that the market participants would use when pricing the asset or liability” (FASB 157). Unobservable inputs are “inputs for which market data are not available and that are developed on the basis of the best information available about the assumptions the market participants would use when pricing the asset or liability” (FASB 157)
In the Appendix B of the Exposure Draft of May 2009 prior to a company’s decision regarding the best technique to apply in the case of a specific asset, the responsible executives or Board members must choose the valuation premise according to the
“highest best in use” and the most advantageous market.
The valuation technique elected by the company should aim at minimizing the unobservable inputs and maximizing the observable ones. The inputs’ relevance and availability might influence the choice of the valuation technique.
2.3.1 Market Approach
A company should adopt this method when there is an active market for the measured asset. In this case, the Fair Value of the asset should correspond to the market price. This valuation technique implies that if there is another asset in the market exactly the same as the one being measured by the company (with the same characteristics and in equivalent circumstances), then the value of the asset of the company has to reflect the market value of the identical asset (Barreca & Chen, 2009).
This approach is based on the principle of substitution, which defends that “the economic value of any asset or thing tends to be determined by the cost of acquiring
11 | P a g e
an equally desirable item”. It also portrays the premise that companies can compare opportunities (Claywell & Hanlin, 2009).
The Exposure Draft of May 2009 defines market approach as the method that “uses prices and other relevant information generated by market transactions involving identical or comparable assets or liabilities”. The Board assumes the market is efficient and reflects the real value of a certain asset or liability.
This technique is made possible by resorting to two methodologies: “completed
transaction method “or “guideline company method”. Both are based on the principle
that the transaction’s value is the market value with which both seller and buyer are satisfied.
According to Hanlin and Claywell (2009), this approach has some limitations. It departs from the assumption that the market is perfect while, in fact, it is affected by risk and comparability. These factors may influence the company’s value and, subsequently, the assets’ value.
2.3.2 Income Approach
The Exposure Draft of May 2009 states that this approach “uses valuation techniques to convert future amounts to a single present amount”.
The Fair Value amount is determined by the expectation about the future amounts of Cash Flows generated by a specific asset or liability. Nonetheless, present values are influenced by the availability of data and other specific facts and circumstances, such as the price comparability (Appendix C, Exposure Draft 2009).
Bennet Kpenty (2009) explains that the amount of money a buyer is willing to pay is directly linked to the Cash Flows that will be generated in the future (capitalization method). The author exemplifies the logic behind this method with a Shakespeare’s quotation: “What’s past is prologue?” in other words, an asset will generate in the future substantially the same Cash Flows generated in the past.
Additionally, this author defends that using Cash Flows is a way of reducing manipulation, since these are more reliable and capture all variations and market’s real trend.
12 | P a g e
The Exposure Draft of May 2009 also addresses how a company should discount Cash Flows in order to avoid over-predictions. For the Board, there are two possible techniques: the discount Rate adjustment and the Expected present value technique. The first one depends on the most likely Cash Flows calculated by comparison between existing companies in the market. To compute the present value of those Cash Flows, the company uses a rate that represents the inherent risk of the asset. The alternative method requires the company to estimate the weighted average Cash Flows and compute the present value using a rate that reflects the systematic risk2 of the asset or liability.
2.3.3 Cost Approach
This approach should be chosen when there is no active market for the asset and when it is impossible to determine the Cash Flows that such asset will generate in the future. It is frequently utilized for software, machinery and equipment (Barreca & Chen, 2009).
This technique is not recommended when the asset is unique, when the amortization and depreciation values are not reliable or when the asset has legal protection (Barreca & Chen, 2009).
The Exposure Draft of May 2009’s cost approach is a technique that “reflects the amount that would currently be required to replace the service capacity of an asset often referred to as current replacement costs”. It is to be used mainly for tangible assets and when the company uses the in-use premise, since “a market participant would not pay more for an asset than the amount for which it could replace the service capacity of the asset”.
The cost approach is based on “current cost new”. Theoretically, this should be the cost reproduction yet, in practice, there are two ways of achieving this value; either through “duplicate cost new” or through “replacement costs new”. Although related, they represent different concepts and different values.
The duplication cost new represents the amount that a company has to incur associated to the construction or acquisition of an identical asset. The replacement
2
Systematic risk of an asset or liability “refers to the amount by which an asset or liability increases the variance of a diversified portfolio when it is added to that portfolio.” (C13, Exposure Draft of 2009)
13 | P a g e cost new stands for the most economical acquisition cost of an asset that is able to
satisfy equal needs and possesses the same utility and functionality of the asset.
2.4 Fair Value: Hierarchy
The FASB decided to create an inputs’ hierarchy in order to increase comparability and consistency in Fair Value measurements by prioritizing certain inputs3 over others. KPMG elaborated a decision tree chart with the purpose of helping companies determine to which level an input belongs.
Source: KPMG
The Exposure Draft of May 2009 indicates three levels of inputs, also mentioning that “quoted prices in active market for identical assets or liabilities (level 1)” are the ones that a company should concentrate their attention on, while paying less attention to inputs belonging to the third level (considered as “unobservable”).
The document includes a section dedicated to providing companies with the information they should disclose for each asset and liability, such as the presentation of the hierarchic level to which an input belongs to as well as the potential transferences between levels.
3
14 | P a g e
2.4.1 Inputs Hierarchy - Level 1
Level 1 is defined by the FASB as “quoted prices (unadjusted) in active markets for identical assets or liabilities that the entity can access at the measurement date.” According to the contents of the paragraphs 46-48 of the Exposure Draft of May 2009, if the company does not have access to the market at the measurement date, the value to be taken into consideration should be the asset’s value at the time when the “restriction ceases”. Likewise, if the market price includes some restrictions, the company should adjust that value. In cases where the adjustment is significant, the input cannot be characterized anymore as belonging to level 1.
The Board states that the inputs included in this level are the most reliable ones, since the market is in constant variation and this pricing method is the one that best captures all changes. A company should use this type of inputs whenever possible. The asymmetry of information between companies and users under this inputs’ level is very low (Song & Thomas & Yi, 2008).
The Board further informs that if the quoted price after the measurement date has undergone a significant variation companies should report that change.
2.4.2 Inputs Hierarchy- Level 2
These inputs are “other than quoted prices included within level 1 that are observable for the asset or liability, either directly or indirectly” and “must be observable for substantially the full term of the asset or liability”.
In this hierarchical level, the valuation technique must be based on observable inputs that presuppose some adjustments based on unobservable inputs or on observable prices in inactive markets., it is also possible to include prices in this level that are influenced by market-based measures (Song & Thomas & Yi, 2008).
Appendix B4 suggests that the price of an asset or liability can be estimated considering Swap rates based on yield curves or observed at commonly quoted
4
15 | P a g e
ranges. A bank’s prime rate, share’s volatility and royalty rates should also be taken into consideration.
2.4.3 Inputs Hierarchy- Level 3
These are “inputs for the asset or liability that are not based on observable market data”. The Draft also says that “unobservable inputs shall be used to measure Fair Value to the extent that relevant observable inputs are not available.”
In this hierarchic level, companies have to use a market – to - market model, even when there is no active market. Thus, they have to place unobservable data models that will generate a less credible valuation (Huian, 2009).
Inputs at this level promote the highest degree of information asymmetry between companies. Therefore, users and investors might think that the information available to them is not reliable due to managerial discretion concerning the values presented (Song & Thomas & Yi, 2008). For Penman (2007 in Song & Thomas & Yi, 2008), it is extremely important to reduce the information asymmetry by monitoring the effectiveness of internal control systems.
Paragraphs 53-54 of the Exposure Draft of May 2009 argue that unobservable inputs should rely on the assumptions used by market participants. Those assumptions should include the inherent risk of a certain asset or liability and reflect the best available information.
In the disclosure section of the document, it is explicitly declared with respect to Level 3 inputs that companies should disclose all changing in valuation techniques and data significance, as well as explaining how the changing affects the Fair Value.
16 | P a g e
2.5 Fair Value debate
There is a mixed sentiment regarding the utility of using Fair Value vis-à-vis the Historical Cost measurement (Ronen, 2008). This section is focused on some aspects that are prominent in this debate.
Relevance versus Reliability
According to the FASB, financial information is useful if it is relevant and reliable. However, since it is almost impossible to achieve both qualities at the same time, there must be a trade-off. The Board considers reliability more valuable than relevance, while believing that investors are more concerned with the company’s current value.
The Historical Cost is obviously not as relevant as the Fair Value but is clearly more reliable (Johnson, 2005). The latter is especially less reliable when there is no active market for a certain asset or liability, forcing managers to use valuations with some degree of subjectivity (Song & Thomas & Yi, 2008) thereby increasing the asymmetry of information (Lansman, 2007; Penman, 2007 in Song & Thomas & Yi, 2008).
From Johnson’s point of view (2005), companies should use the Fair Value instead of the Historical Cost accounting principle, given that it renders the information presented in financial statements more relevant.
Transparency
Nally (2008) defends that the Fair Value measurement gives investors information about future expectations and managerial performance. In this author’s opinion, “Fair
Value, while imperfect, is the best available method to reflect market conditions”. Within
the overall financial statement’s values, the Fair Value measurement increases transparency in articulation with the natural dynamics of the market.
According to Sapra (2005), when a company uses market prices to measure the value of a certain asset or liability, the information regarding the risks that investors and outsiders incur related to that particular asset or liability is more trustworthy, allowing decisions to be taken more accurately.
17 | P a g e
Volatility and Procyclicality
Sapra (2005) also used a metaphor with a bridge in order to explain the volatility of the market’s behavior and prices. He stated that: “when a bridge moves, everyone adjusted their stance at the same time. The synchronized movement pushed the bridge that the people were standing on, and made the bridge move even more”. The financial market behaves in the same way: when an entity reacts in a certain direction impacting on other entities that is, hoarding. This behavior generates price volatility and this variation has an immediate impact on financial statements.
This author also states that “Fair Value measurement tends to amplify the movements in assets prices”. When prices fall, there is an incentive to sell the asset, thus putting additional pressure on the price; on the contrary, when the prices rise, the incentive is to hold on to the asset.
Moreover, Fair Value is a measurement that, when applied to assets, can generate a vicious cycle and cause a “contagion effect” (Laux & Leuz, 2009 in Strampelli, 2011) thus contributing to the procyclicality of the financial system (Laux & Leuz, 2009).
Manager’s Discretion
Another important topic of this debate is managerial discretion, especially relevant when there is no active market for the asset or liability at the measurement date. In this situation, the company should make a forecast based on internal data.
When there are level 3 inputs, companies have to determine some indicators, such as the level of activity or sales. These are based on judgments that allow companies to enjoy greater freedom in measuring the Fair Value (Cortese-Danile & Mautz & McCarthy, 2010).
In order to overcome the possibility of not attaining an accurate measurement, some authors stress the importance of an ethical business attitude.
18 | P a g e
2.6 Fair Value and Economic Crisis
Over the last few decades, the IASB and the FASB have been increasingly using the concept of Fair Value in the accounting rules they issue. Simultaneously, companies are shifting from the Historical Cost approach to accounting to its Fair Value alternative (King, 2006).
The Fair Value accounting allows companies to prepare the financial statements with the current value of assets and liabilities, relying on the principle that an asset should be reported at the amount correspondent to its worth on the measurement date (Zack, 2009). According to some authors, “valuation is an art, not a science”; therefore, a professional judgment is inherent to each valuation assignment (King, 2006).
The Fair Value accounting has been blamed by many authors of being one of the main causes behind the bankruptcies and corporate scandals at the beginning of this century, as well as the main responsible for the 2008 financial crisis. Following the events in which major American companies (Enron, WorldCom) were involved during this past decade, the IASB and the FASB worked together in order to promulgate rules aimed at making it easier for investors to understand asset’s values in financial statements and reduce the complexity of the financial statements.
In the aftermath of 2008, the Fair Value accounting was the object of intense discussions among regulators, academics and investors (Strampelli, 2011). This debate has resulted in the definition of two dominant and distinct theories. On the one hand, critics point to fact that the Fair Value accounting contributed to the worsening of the financial crisis, by accelerating and amplifying its negative consequences (Magnan, 2009). According to the American Banks Association, “the problem that exists in today’s financial markets can be traced to many different factors. One factor that is recognized as having exacerbated these problems is the Fair Value accounting” (Laux & Leuz, 2009).
For Steve Forbes (in Pozen, 2009), chairman of Forbes media, the main cause of the 2008 financial crisis was neither subprime mortgages nor credit default swaps, but mark–to-market accounting. Brian Wesbury (in Pozen, 2009) also quoted as saying that “the vast majority of mortgages, corporate bonds, and structured debt are still performing. But because the market is frozen, the prices of these assets have fallen below their true value”.
19 | P a g e
Those authors who disagree with the critical current contend that Fair Value accounting was not a contributor, but a messenger (Koonce, 2008). In this line of reasoning, this measurement was not the cause of the financial crisis, having actually provided early
warning signals that could have prevented the crisis if taken into consideration (Laux &
Leuz, 2009).
It was equally noted that the Fair Value accounting “has helped to bring problems to a head earlier and with less damage than if the market-value had not been applied” (Johnson Carrie, 2008, in Huian, 2009) and that it “warns companies to stay away from the most volatile assets”, since it takes into account the risks associated to each asset (Liz, 2008, in Huian, 2009).
Even if the Fair Value accounting contributed to the recent financial crisis, adopting the Historical Cost would not be a better solution (Laux & Leuz, 2009). In fact, this concept is characterized by a lack of transparency that could be even more damaging in this time of crisis. Others suggest that during the financial crisis, assets could be recorded at a fixed amount, since Fair Value “reacts too fast to the market” (Huian, 2009).
In a positive note, the IASB and the FASB have created a joint task Group to deal with the financial crisis and restore the confidence in the markets,
2.7 Business Combinations
The last century was marked, among other factors, by the globalization and the openness of the markets phenomena. Globalization is used here as referring to the integration through a global network of political ideas, goods and trends. In this context, the goods sold worldwide have become more homogenous and cultural tastes all over the world more uniform.
Since companies no longer operate within a single country and investors are aware of what is happening worldwide, it has become increasingly important to create a single accounting system in order to standardize financial statements. The goal is not only to allow the comparability of the financial information between companies in different countries, but also to harmonize the financial statements of companies operating in multiple countries.
20 | P a g e
Therefore, from 2005 onwards, all European listed companies are required to prepare their financial statements in accordance to the IFRS and the IAS, standards settled by the IASB.
In 2004, the IASB created IFRS 3, a norm that deals specifically with Business combinations. This standard was designed to improve the transparency in acquisition accounting, an area where “a lot of accounting manipulation has occurred in the past” (Calwell, 2006).
2.7.1 The Concept
IFRS 3 states that a business combination consists in the “bringing together of separate entities or businesses into one reporting entity”.
The acquirer (the company that purchases another) has to have the control of the acquiree (the company that was purchased); otherwise the transaction is not considered as a business combination (paragraph 3).5
Accounting for a business combination requires that “the acquisition cost has to be expensed and that the value of the assets and liabilities being acquired has to be reported at their Fair Value”. Before the adoption of IFRS 3, the prevailing International Standards required that business combinations were accounted based on the Historical Cost principle (Gore & Zimmerman, 2010).
2.7.2 Method of accounting
According to the same standard “all business combinations shall be accounted for by applying the purchase method” (paragraph 4). In SFAS 141, it is explicitly mentioned that this is the only accepted accounting method in this situation.
5
In paragraph 2,a there is an exception for joint ventures. Even if the acquirer has the control over other, if it is a joint venture it is not specifies in this standard but in IAS 31.
21 | P a g e
Therefore, the acquirer has to take into account all assets and liabilities recognized by the acquiree, plus the contingencies assumed by the purchased entity (paragraph 9). The document outlines four steps that companies should take into consideration, as follows:
Step1 – Identifying the acquirer
In all business combinations, there is an acquirer. The acquirer, as mentioned above, is the company that obtains control over another entity or business. The International Standards clearly mentions what is control and how a company obtains control over others.
A company controls another one when it has more than half of that entity’s voting rights. Control can be achieved directly, through an agreement with other investors or under a statute.
In the case of a merger or when the business combination involves more than two entities, it may be difficult to identify the acquirer. In any case, it has to be defined.
Step 2- Measuring the cost of the business combination
The acquirer has to measure the cost of the business combination. This includes, besides the Fair Value of the assets and liabilities, the equity instruments issued by the
acquirer, at the exchange date6, and any other direct costs attributed to the business combination, such as fees paid to lawyers or accountants (paragraph 37 and 38).
Step 3- Allocating, at the measurement date, the cost of the business
combination
According to the same document, a company should reliably recognize, at the acquisition date, the identifiable assets, the assumed liabilities and any non-controlling interest that should be measured at the corresponding Fair Value (paragraph 18). Additionally, it should not recognize future losses incurred as a result of the business combination.
6
The Exchange date cannot be the acquisition date if the business combination involves more than a single transaction (IFRS 3- Paragraph 25)
22 | P a g e
In the SFAS 141, the value of the business combination is referred to as difficult to determine if the purchase is not paid in cash. In this situation, when the payment is made resorting to other assets (such as preferred stock) (Cox & Elsea & McConnell, 2009), the Fair Value of the different components of the price being paid should be taken into consideration.
Step 4- Recognition and measurement of Goodwill or a gain from a bargain
purchase
Still under IFRS 3, Goodwill is defined as the “Future economic benefits arising from assets that are not capable of being individually identified and separately recognized” (Appendix A).
When the purchase price is higher than the net assets being purchased, the acquirer has to identify Goodwill. Goodwill is the difference between price paid in the transaction (with the consideration paid being considered at Fair Value) and the Fair Value of the net assets (Gore & Zimmerman, 2010). According to Sorin (2009), Goodwill includes all “unrecognized intangibles (and) is recorded as the difference between the total value of all financial, physical, and intangible assets less liabilities and the Fair Value of the underlying equity”
2.7.3 Disclosure
The acquiring company should include in its financial statements the “names and description of the combining entities”, the acquisition date, the percentage of control that it has over the acquiree and the components of the cost associated to the business combination, as well as information about future operations that are the result of the business combination.
23 | P a g e
2.8 Goodwill
Goodwill arises either through as a consequence of Business Combinations or as a result of the normal operations (internally generated Goodwill, discussed in IAS 38). Since the purpose of this dissertation is to analyze the treatment of this asset by Portucel Soporcel Group and compare it to what is required by International Standards, this issue will require a deeper analysis.
This concept and its valuation have changed over time. In the beginning of the twentieth century, Goodwill was defined as “encompassing the good and valuable relationships of a proprietor of a business with its customers” (Baldi & Trigeorgis, 2009). Today, Goodwill is a broader concept, which results from the evaluation of the earning generating capacity of a business (Baldi & Trigeorgis, 2009).
Regarding this concept and measurement, the IASB and the FASB reached a consensus (Bloom, 2009). Goodwill is an intangible asset7 with an infinite useful life. This class of assets has a growing importance in modern economy (Bloom, 2009). However, its Fair Value is hard to ascertain, as most of the times there is no active market (Sorin, 2009).8
According to Baldi and Trigeorgis (2009), Goodwill can be either developed internally or acquired as a part of a business combination. However, only the latter is recorded in the financial statements, since the former does not meet the conditions to be defined as an asset.
The same authors stated, in 2009, that there are two main methods to account for Goodwill. Companies can use the residual approach or the excess profits approach. The first method measures Goodwill as the “difference between the purchase price and the fair market value of an acquired company’s net tangible and identifiable assets”; the second approach explains Goodwill as the value that the combined companies can generate – above the expected profits for a similar business.
The IASB defends that companies should adopt the first method, since Goodwill must be accounted as a non-separable asset. The Board indicates that intangible assets
7
According to IAS 38, an intangible asset is an identifiable asset without physical substance, it must be controlled by the company and the company should expect future economic benefit.
8
24 | P a g e
with infinite useful life have to be tested for impairment and this is obviously the case of Goodwill.
Therefore, a standard was established (IAS 36 Impairment of Assets) with the goal of ensuring that companies do not classify their assets at more than their recoverable amount. This standard additionally identifies what the recoverable amount is and how a company can measure it, pointing to a specific treatment for the impairment of Goodwill.
In order to carry out the impairment test, companies must allocate the Goodwill created in a Business Combination, from the acquisition date, to cash-generating units (CGU) or to Groups of cash-generating units, likely to benefit from the synergies of the Business Combination.
25 | P a g e
3.
Case-study: Portucel
The aim of this dissertation is to understand how companies measure Goodwill and recognize it according to Fair Value accounting. To accomplish this goal, this paper will focus on the Portucel Soporcel Group, a listed Portuguese company among the 50 biggest operators worldwide in the pulp and paper industry9.
This chapter is composed of three parts. It starts with an analysis of the industry, in order to understand the key features of the sector, regarding both the pulp industry and the paper industry. This section also addresses some relevant aspects that may influence the sector in the future.
Secondly, there is an analysis of the company which explains the structure of the Group, providing some performance indicators and relevant facts as well.
The third and final part is dedicated to the evaluation of Goodwill and its validation under the Fair Value accounting within the Group. The acquisition of Soporcel by Portucel and its impact in terms of Goodwill calculation and subsequent impairment tests are presented and developed in this section.
As part of my research on the treatment of Goodwill by the Portucel Soporcel Group, I met with the Group’s Financial Director, Eng. Manuel Arouca, and with the Director of the Planning and Control Department, Dr. José Perdigão. They were kind enough to receive me and took the time to elucidate me regarding Goodwill’s calculation, the methodology adopted and the values obtained. However, since this is a listed company, some information – namely concerning forecasts – is confidential and I am therefore not allowed to disclose it in this essay.
9
26 | P a g e
3.1 Industry Analysis
A quick introduction to the sector this company operates in as well as the presentation of some macroeconomic factors and trends are useful to shed light on a few fundamental drivers that affect the Portucel Soporcel Group.10
In the pulp and paper industry, the main resource is wood; this raw material is obtained through forest exploitation. In Portugal, 34.8% of the national territory (3.4 millions of hectares) is forest (see Exhibit 1). The pulp and paper industry is responsible for the use of 6% of the Portuguese forest area (see Exhibit 2).
This industry is also highly regulated; all players are obliged to follow legal and environmental rules in order to maintain a sustainable position in the market.
3.1.1 Production Cycle
The production cycle comprises several activities (see Exhibit 3). The first step is the production of wood, while the last is the production of paper. However, between these two activities there is an intermediate phase during which a product known as pulp is generated. Pulp can either be sold directly in the market or used as a raw material for the production of paper.
The main purpose of forest management (the production cycle´s inaugural activity) is the assurance that there will be enough wood to transform for a determinant time period. After the preparation of the wood, it is transformed into pulp. The production of paper comes next, but there are yet a range of possibilities related to the recovery of energy11 and recycling, which can also be a source of revenue.
10
This overview will be focused on information available in CELPA, AICEP, UTIPULP, CEPI and companies in the industry, such as ALTRI and PORTUCEL
11
27 | P a g e
3.1.2 Pulp Industry
This product can be characterized as a commodity. This industry is also fragmented, since the collecting of wood is done mainly on a local basis due to high transportation costs.
In 2008, pulp’s world production totaled 192.1 million tons and Confederation of European Paper Industries (CEPI) Countries12 were responsible for 22% of that amount, as shown in the figure below. According to the CEPI’s report, the production of pulp underwent a decreasing phase between 2007 and 2009 (see figure 2). In the same report, Sweden appears as the biggest producer, responsible for 32% of the European production. Portugal, accountable for 7%, comes as the third biggest player, together with Germany (see Exhibit 4).
Source: CEPI 2009 Source: CEPI 2009
Figure 1: World’s Pulp production (Breakdown) Figure 2: Pulp Production in CEPI Countries
12
In 2009, the members of CEPI were: Austria, Belgium, Finland, France, Germany, Hungary, Italy, Norway, Poland, Portugal, Romania, Slovak Republic, Spain, Sweden, Switzerland, The Netherlands, and United Kingdom.
28 | P a g e
In terms of consumption, in 2009, the biggest market was North America. Nevertheless, the rest of the world has been increasing its importance in this industry, as illustrated below.
Source: CEPI 2009 Figure 3: World’s Pulp Consumption (Breakdown)
From a Portuguese point of view, a report released by AICEP in 2009 shows that the entire national production is in the hands of two corporations: Portucel and Altri. Each of them runs three factories, with a combined installed capacity of 2.2 million tons of pulp per year.
According to the same report, in 2008, the total production in Portugal reached 2.02 million tons, less than in 2007, therefore in line with the European trend. The document also pointed out that the reasons behind this downwards stance were the drop in the production on pine’s pulp and the bankruptcy of small factories, combined with the economic contraction resulting from the financial crisis.
In 2009, Portugal was in sixteenth place in the world ranking of pulp exports, with a market share of 1.7%. Exports represent almost 95% of the total production and the largest buyer of the domestic production is Spain (with a 34% share) (see Exhibit 6). Due to the contribution of markets such as China, Tunisia and Turkey, “the rest of
world” region is becoming more important for the Portuguese pulp export.
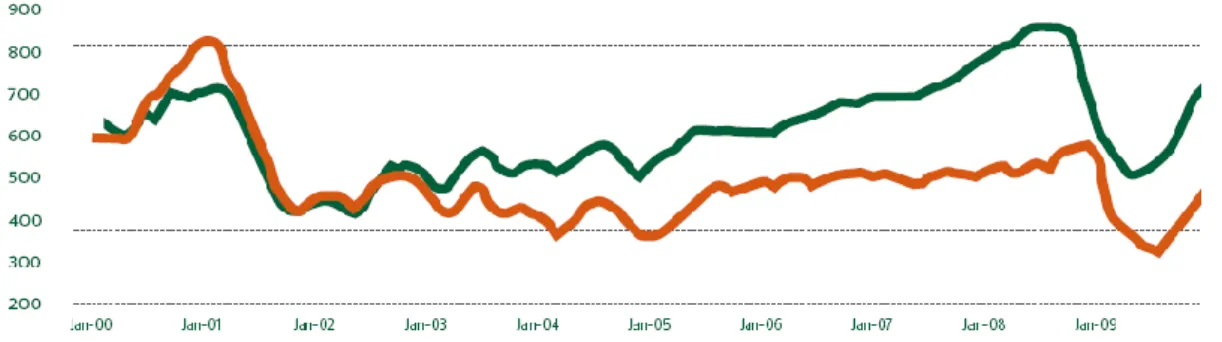
As shown below, this industry has recorded high price volatility, a fact which contributed to the closure of small companies worldwide and prompted others to slow down production in 2008 and 2009. This is clearly a cyclical industry, highly sensitive to business cycles and closely affected by the overall economic situation.
29 | P a g e
Source: Portucel Annual Report 2009 Figure 4: BHKP Price Evolution
3.1.3 Paper Industry
Paper is the result of the chemical transformation of pulp. Pulp consumption levels are related to paper production levels, the former being the raw material used in the production of the latter.
There are five main types of products that can be produced in this industry: Newsprint; Other Graphics (including UFW – Uncoated Wood Free – and CFW – Coated Wood Free _ which are the most important types of paper, representing almost 40% of the total production in CEPI countries); Case Materials; Other Packaging; and Tissues (see Exhibit 7).
In 2008, the total production of paper amounted to 390.9 million tons, with CEPI Countries representing 25% of the total. According to the CEPI’s report, the production of paper is also in a decreasing phase, following the aforementioned trend for pulp.
Source: CEPI 2009 Source: CEPI 2009
30 | P a g e 0% 5% 10% 15% 20% 25% 30% 35% 40% 45% CEPI Other Europe North America Asia Latin America Rest of the World
Regarding the paper produced by CEPI countries, the biggest producer in 2009 was Germany, with 24% of the total produced. Portugal does not occupy a prominent place in this field (see Exhibit 8).
In 2008, Asia was the main consumption market, representing almost 40% of the world consumption, as the graphic shows.
Source: CEPI 2009 Figure 7: World’s Paper Consumption
Looking at the Portuguese situation, a report made by Associação da Indústria
Papeleira (CELPA), in 2009 affirmed that the use of pulp for the production of paper
increased 3% in 2008, when compared to 2007. Another report from AICEP states that the Portuguese industry has made a significant progress in pulp and paper production, moving towards to a more integrated production process. In fact, until recently, Portugal was mainly a pulp producer. Nowadays, however, the country has been betting more on paper, ensuring the establishment of a complete supply chain, thus increasing the companies’ competitive advantage.
Concerning the Portuguese paper production, Graphic’s type, also known as
Printing&Writing Paper, represents 67% of the total production since 2004. This
segment is also Portucel’s core business.
Exports represent almost 87% of Portugal’s total sales of paper. Domestic sales have been losing importance over the years, while the Spanish market absorbs about 26% of the total exported. Europe still represents almost 75% of exports, but markets such as the Middle East, Asia and Oceania have been gaining an increasing weight (see Exhibit 9)
31 | P a g e
3.1.4 Future Trends
In 2009, due to the economic crisis, the global performance in this sector was negative. In the U.S and in Europe consumption fell 3% and 4%, respectively, while in Japan consumption dropped at an impressive 9% rate.
Since the pulp and paper demand is closely related to GDP growth, during a period characterized by the contraction of the economy, it is expected that the global demand for pulp and paper will fall reflecting directly the GDP evolution.
During the last few decades, paper demand in developed countries was influenced by two major and opposing factors. On the one hand, the increased use of computers has led to high growth mainly in the use of printing and writing paper. On the other hand, internet penetration has reinforced the gradual decline of the consumption of printing and writing paper and newspapers.
The emergent markets constitute the biggest challenge that all players in the developed countries have to face, due to their increasing consumption levels of both pulp and paper, and to the competitive prices achieved by the companies operating in these areas. Producers from emerging markets benefit from economies of scale, related to their capacity to expand their forest area and to lower labor costs.
Companies in the developed countries have to increase the efficiency in their supply chain in order to gain a competitive advantage vis-à-vis their counterparts from emergent markets. With the aim of creating a unified supply chain and mitigate volatility in the price of raw materials, while reducing costs and inefficiencies, companies in the developed countries have been integrating the production process..
Examples of how companies can reduce costs can be found in North America and in Europe, where companies are already investing in the manufacture of biofuels extracted from wood. This will increase operating margins, since biofuels can replace other types of fuel utilized in the production of paper. Integrating the supply chain can reduce costs by shrinking, for example, the elevated transportation costs associated mainly with the first phase of the production process.
The Chinese market is currently considered the best outlet for pulp companies because of its size and fast growth rates. Besides, China does not have many natural resources; which means that pulp demand must be satisfied largely through imports. In 2009, the consumption of pulp in the country grew by 44%, compared to 2008.
32 | P a g e
3.2 Company’s Overview
Portucel launched its industrial activity in 1953, in Cacia13. At that time, its core business was the production of pulp from pine wood. Until 2000, when Portucel acquired INAPA, SA14 , the company only produced pulp. After that acquisition, Portucel was able to produce both pulp and paper. One year later, Portucel bought Soporcel, a strong competitor in both the pulp and paper markets. This acquisition marked the formation of the Portucel Soporcel Group (see Exhibit 10 and 11), which became the fifth main player in the European ranking of Uncoated Woodfree (UWF) paper.
Nowadays, the Portucel Soporcel Group is one of Portugal’s strongest companies. In 2009, it was responsible for 3% of the national exports and 0.8% of the Portuguese GDP.
The Group is internationally recognized as having one of the most developed and largest industrial complexes in the industry. The new paper mill, located in Setúbal, which started its production activity in August 2009, is the world’s largest and technologically most advanced paper mill. This complex allows the Group to produce 1.6 million tons of paper annually. This investment also placed the Group at the forefront of the European production of UWF paper for printing and office, and guarantees it the sixth place, in the same category, in the worldwide ranking.
Besides the pulp and paper industry, the Group has been increasing its presence in the energy sector, having produced 1.84 TWH of electric energy in 2009 (17.5% more when compared to 2008). In this sector, the Group occupies an equally prominent position, leading the national production of biofuels.
The Group runs three paper mills located in Cacia, Figueira da Foz and Setúbal. Cacia produces pulp and energy. The other two mills, besides the production of energy, are integrated producers of pulp and paper. Nowadays, the Group employs 2,331 people directly plus several thousand workers indirectly.
This Group has 767 million shares outstanding with a nominal price of 1 euro each. The Group has 2.12% of own shares; the biggest shareholder, with 75.44% of the
13
Near Aveiro
14
33 | P a g e
outstanding shares, is Semapa15, followed by Bestinver Gestion, S.A., which controls 2.01% of the Group’s equity. The remaining shares belong to smaller shareholders (see Exhibit 12).
In 2009, Portucel’s share price performed in line with the PSI 20 index, registering an increase of 31%, which helped to offset the loss recorded in 2008. In 2009, the lowest registered market value for each share was 1.35€ and occurred on the 20th of March.
The biggest market capitalization took place on the 29th of September; the transaction price that day was 2.10€ per share. When compared to the paper and forest products
index, the Group’s stock outperformed the average of the Nordic companies, which
registered a loss of 7% (see Exhibit 13).
Portucel Soporcel Group has been developing a portfolio of differentiated products and brands, which allows the Group to target multiple segments with various brands. According to the Group’s annual report of 2009, brands represent 61% of the total sales.
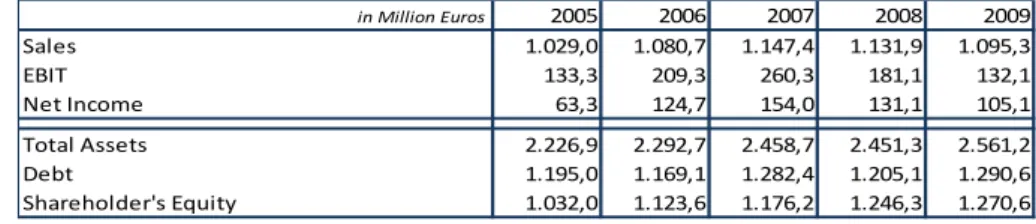
The Group’s brands are divided into two categories: office paper and offset paper. The most important brand is Navigator, the European market leader with a full range of office paper solutions. The Group also holds the well-known Pioneer, Inacópia, Target, Discovery, Multioffice and Explorer brands. In what concerns the Offset Paper, the most important brand is Soporset, the European market leader for high quality printing paper. The Inaset and Pioneer Graphic brands also belong to Portucel Soporcel. Figure 8 and Table 1, presented below, contain some useful indicators on the company’s operating and financial performance over the 2005-2009 period.
Table 1: Main Financial Indicators
15
Semapa is a Portuguese holding company present in three industries: pulp and paper industry through Portucel, cement industry through Secil, which is controlled 51%; and in the environment and animal transformation through 80% controlled ETSA.
in Million Euros 2005 2006 2007 2008 2009 Sales 1.029,0 1.080,7 1.147,4 1.131,9 1.095,3 EBIT 133,3 209,3 260,3 181,1 132,1 Net Income 63,3 124,7 154,0 131,1 105,1 Total Assets 2.226,9 2.292,7 2.458,7 2.451,3 2.561,2 Debt 1.195,0 1.169,1 1.282,4 1.205,1 1.290,6 Shareholder's Equity 1.032,0 1.123,6 1.176,2 1.246,3 1.270,6
34 | P a g e
Source: Portucel Soporcel 2009 annual report Figure 8: Financial Indicators
Net income fell 19.8% in 2009, reflecting the 3.2% drop in sales and the 31% rise in depreciations that resulted from the incorporation of the new paper mill. The 3.2% sales reduction mainly reflected the 5.6% reduction in the price of paper, which offset the rise in volume recorded in that year.
Earnings per share amounted to 0.141€ in 2009, 0.03€ less than in 2008.
The second graph demonstrates that the total assets increased in 2009. The main reason for that evolution was the incorporation of the Setúbal paper mill, that added 522.3M€ to Tangible Fixed Assets.
3.3 Goodwill in Portucel
3.3.1 Accounting Principles
Until 2005, all Portuguese companies followed the accounting rules described in the
Plano Oficial de Contas (POC), the Portuguese generally accepted accounting
principles.
From 2005 onwards, listed companies in Portugal had to adapt their accounting standards and financial statement’s structure to the international financial reporting standards (IFRS), set by IASB, a specialized board elected by the European Union16. These rules were adopted by all listed European Union companies and the aim was the
16 IASB 0 200 400 600 800 1.000 1.200 1.400 2005 2006 2007 2008 2009 Sales EBIT Net Income 0 500 1.000 1.500 2.000 2.500 3.000 2005 2006 2007 2008 2009 Total Assets Debt Shareholder's Equity
35 | P a g e
creation of a platform of comparison between companies, ensuring that the information was well presented and consistent.
Portucel Soporcel Group created in 2003 a specialized team to ensure that the transition phase was concluded on time and that the Group was ready to adopt the European standards. That team identified some differences between the old standards and the new ones, which were presented in the 2005 Annual Report in a section specifically devised not only to illustrate all changes brought about by the adoption of the new accounting standards but also to make a comparison with the previous accounting rules (see Exhibit 14).
Among the many changes observed during the transition phase, the ones which deserved more attention were related to the main topic of this dissertation, the Fair
Value measure. The Group identified the following assets as being the objects of a Fair
Value approach under the new rules:
1. Goodwill: Concerning this asset, both POC and IFRS accounted it in a similar
way. However, IFRS 3 does not accept the amortization of Goodwill and presented an alternative, Impairment Tests, to be done periodically. Additionally, the new standard established that companies had to recognize the negative Goodwill in the income statement.
2. Biological Assets: According to POC, the Group’s forest was accounted at the
Historical Cost. However, with the application of IAS 41, these assets had to be recognized at their Fair Value. All variations in the Fair Value of these assets over a certain period are accounted for in the correspondent income statement.
3. Financial Instruments: The POC affirmed that the gains or losses with financial
instruments were to be registered in financial statements, as required by the specialization criteria. With IAS 39, companies must recognize financial instruments at their Fair Value and all variations in the Fair Value must be recognized in the income statement.
Since 2005, Portucel Soporcel Group has been preparing its financial statements in accordance with the IASB’s rules. Financial statements are prepared respecting the
going concern principle, and some information is based on judgments and estimates.
36 | P a g e
of generating relevant adjustments. In 2009, the list comprised Impairment of Goodwill, Income Taxes and Fair Value of Biological Assets.
3.3.2 Goodwill
IFRS 3 defines Goodwill as “future economic benefits arising from assets that are not
capable of being individually identified and separately recognized.” This definition
recognizes that the value of a business as a whole may be greater than the amount which was invested in it; the difference obtained is acknowledged as Goodwill.
Before this accounting standard was issued, Goodwill was considered as an asset that was unaltered over time, until it became obvious that Goodwill was worthless and was written off.
At the time of Soporcel’s acquisition, the Goodwill, as defined in POC, was the difference between the investment made in the acquisition of subsidiaries and the revaluation of their assets.
The current standards settled by IASB treat Goodwill as an asset with an infinite useful life. Goodwill is not amortized; instead, it has to be tested annually for impairment. Additionally, this standard states that the amount amortized prior to the 31st of March 2004 is not written back and that an impairment loss cannot be reversed.
Moreover, the standard identifies the existence of the negative Goodwill, which arises in situations when a company acquired another for an amount lower than its Fair Value. Negative Goodwill should be credited in the income statement at the acquisition date. In the Portucel Soporcel Group, Goodwill is defined as “The excess of the cost of the
acquisition over the Fair Value of the Group’s share of the identifiable net assets acquired”, the Group also states that “If the acquisition cost is less than the Fair Value of the net assets of the subsidiary acquired (negative Goodwill), the difference is recognized directly in the income statement”. This definition is in line with what is
defined by IFRS 3.
For this company, the excess paid in the acquisition of an associate is recorded directly in the balance sheet under Investments in Associates. When the Group acquires a subsidiary, the excess paid is also recorded directly in the balance sheet, but is