Universidade de Trás-os-Montes e Alto Douro
Estudo Numérico da Gaseificação a Alta Temperatura
Dissertação de Mestrado em Engenharia Mecânica
José Miguel da Costa Fonseca Lopes Favas
Sob orientação do Professor Doutor Abel-Ilah Rouboa
III
Universidade de Trás-os-Montes e Alto Douro
Estudo Numérico da Gaseificação a Alta Temperatura
Dissertação de Mestrado em Engenharia Mecânica
José Miguel da Costa Fonseca Lopes Favas
Sob orientação do Professor Doutor Abel-Ilah RouboaComposição do Júri:
Doutor Joaquim Manuel da Silva Anacleto
Doutor Eliseu Leandro Magalhães Monteiro
Doutor Abel-Ilah Rouboa
V
Dissertação apresentada por José Miguel da Costa Fonseca Lopes Favas à Universidade de Trás-os-Montes e Alto Douro para cumprimento dos requisitos necessários à obtenção do grau de Mestre em Engenharia Mecânica, sob a orientação do Professor Doutor Abel-Ilah Rouboa do Departamento de Engenharias, da Escola de Ciências e Tecnologia da Universidade de Trás-os-Montes e Alto Douro.
VII
Agradecimentos
O homem é um ser que vive em sociedade, nesta cria relações interpessoais fortalecidas pelo respeito e ajuda mutua.
Todo o trabalho apresentado nesta dissertação e todo o meu percurso académico não teriam sido possíveis sem a ajuda incondicional dos meus pais, Luís e Virgínia. Mostrando sempre o seu total apoio em mim a eles lhes dedico este trabalho e o meu sincero agradecimento, Muito Obrigado.
A vida não é só feita de altos mas também de baixos, em ambos os instantes precisamos de alguém sempre presente ao nosso lado que nos faça companhia, enriquecendo recordações felizes e amparando nas mais infelizes. Este alguém para mim é a minha namorada, Marta Mestre, a qual nunca duvidou de mim, dando-me sempre o devido apoio e conselho oportuno, Muito Obrigado.
Nem só de trabalho vive o homem, verdadeiros momentos de lazer só podem ser realizados e apreciados com a presença de amigos. A todos eles capazes de proporcionar excelentes momentos de descontração e bem-estar na procura do gozo da vida o meu Muito Obrigado.
Ninguém nasce ensinado, estamos constantemente a aprender e a descobrir novas potencialidades. Mestres na área dos descobrimentos existem os professores, a eles um Muito Obrigado pelo conhecimento transmitido e em especial ao meu orientador, o Professor Abel-Ilah Rouboa, pela sua orientação e parecer de todo o trabalho realizado.
IX
Resumo
O agravamento das alterações climáticas tem levado a uma grande procura de formas de energia alternativas mais limpas, assim como aumentar a eficiência de formas de energia atuais. Como solução para estes problemas a gaseificação apresenta bons resultados.
Nesta dissertação desenvolveu-se um modelo computacional, recorrendo ao software Aspen Plus, para simulação do processo de gaseificação com e sem recurso de plasma. O modelo desenvolvido tem como base de funcionamento a minimização da energia de Gibbs para calcular os produtos da gaseificação. O modelo desenvolvido foi comparado com dados da literatura com resultados favoráveis atestando a sua veracidade. O modelo desenvolvido foi também sujeito a um estudo do processo de gaseificação para três tipos de biomassa: resíduos de floresta, vides e casca de café. Os parâmetros da gaseificação, como Razão de Equivalência, Rácio Vapor de Água/Biomassa e Temperatura do Gaseificador foram variados com o objetivo de obter frações molares para os constituintes do gás produto da gaseificação.
Recorrendo ao mesmo modelo, a produção de hidrogénio através de gaseificação também foi estudada para os combustíveis referidos anteriormente de forma a se teorizar condições de funcionamento ideais.
O Poder Calorífico Inferior do gás produzido para os diferentes parâmetros da gaseificação estudados foi teorizado.
Os resultados obtidos vão de encontro aos resultados já alcançados noutros estudos. A Razão de Equivalência apresenta melhores resultados para valores deste entre 0,2 e 0,3. O Rácio Vapor de Água – Biomassa tem um grande impacto na formação de H2, quanto maior mais elevada é a fração de H2, mas com o consequente aumento de vapor de água no produto final. A variação da Temperatura do Gaseificador é também responsável pela alteração das frações molares do Syngas.
XI
Abstract
Worsening climate changes are leading to a high demand for cleaner and alternative forms of energy, as well as increase the efficiency of current energy forms. As a solution to these problems gasification has shown good results.
In this dissertation a computer model was developed, using the Aspen Plus software as a mean to simulate the gasification process with and without the use of plasma. The model has as base of operating the minimization of Gibbs free energy to calculate the gasification products. The validation of the developed model was performed by comparison with literature data showing good agreement.
The model was also subjected to a study of the gasification process using three types of biomass, forest residues, vines pruning and coffee husks. The parameters of gasification, as Equivalence Ratio, Steam/Biomass Ratio and Gasifier Temperature were varied in order to obtain molar fractions of the constituents for the gasification product gas.
Using the same model, hydrogen production via gasification was also studied for the above-mentioned biomasses in order to theorize the ideal operating conditions.
The Lower Heating Value of the gas produced from the different studied gasification parameters was theorized.
The results are in agreement with results obtained in other plasma gasification studies. The Equivalence Ratio to have shown the best results was 0,2 and 0,3. The Steam – Biomass Ratio has a large impact on the formation of H2, the higher the value is the higher the fraction of H2 will be, but with a consequent increase in water vapor in the final product. The gasifier temperature variation is also responsible for changing the molar fractions of Syngas.
XIII
Palavras-chave
Gaseificação; Biomassa; Syngas; Desenvolvimento Sustentável; Plasma; Aspen Plus; Modelo Numérico.XV
Keywords
Gasification; Biomass; Syngas; Sustainable Development; Plasma Aspen Plus; Numerical Model.XVII
“Não deve haver fronteiras para o esforço humano. Somos todos diferentes. Por muito má que a vida aparente ser, há sempre algo que podes fazer e ter sucesso. Enquanto há vida à esperança.”
XIX
General Index
Figure Index ... XXI Graph Index ... XXIII Table Index ... XXV Nomenclature... XXVII
Main Introduction ... 1
Chapter I ... 9
1. Introduction ... 11
2. Technical approach and process simulation ... 13
2.1 Process modelling with Aspen Plus ... 16
2.2 Model assumptions ... 17
3. Model validation ... 18
4. Application ... 19
4.1 Effect of temperature ... 19
4.2 Effect of steam-to-biomass ratio ... 20
4.3 Hydrogen production ... 21
4.4 Lower heating value ... 21
5. Conclusion ... 23
Chapter II ... 25
1. Introduction ... 27
2. Technical approach and process simulation ... 29
2.1 Model Description ... 30
2.2 Process modelling with Aspen Plus ... 31
FEED1 ... 31
DRIER ... 31
XX
GASIFY ... 33
Gibbs free energy... 33
SEP1 and SEP2 ... 35
TORCH ... 35 2.3 Model Assumptions ... 36 3. Model Validation ... 36 4. Application ... 38 Equivalent Ratio ... 39 Results ... 39 SBR ... 41 Gasifier Temperature ... 43 H2 Production ... 46 LHV ... 48 5. Conclusion ... 50 Main Conclusion ... 51 References ... 55
XXI
Figure Index
Main Introduction
Figure 1 - Car with gasifier as used in 1945 ... 4
Figure 2 - Syngas Products ... 6
Chapter I Figure 2.1 – Process Flowsheet Gasification ... 14
Figure 2.2 - Flow sheet of biomass gasification simulation using Aspen Plus ... 16
Chapter II Figure 1.1 - Plasma Gasifier illustration ... 28
Figure 2.1 - Process Flowsheet Plasma Gasification ... 30
Figure 2.2 - Aspen Plus Plasma Gasification Esquematic ... 31
Figure 2.3 - DRIER ... 31
Figure 2.4 - DECMPOSE ... 32
Figure 2.5 - GASIFY ... 33
Figure 2.6 - SEP1 and SEP2 ... 35
XXIII
Graph Index
Main Introduction
Graph 1 - Syngas Production ... 7 Graph 2 - Distribution of Syngas Products ... 7 Chapter I
Graph 3.1 - Comparison of Aspen Plus and experimental results ... 18 Graph 4.1 - Effect of the temperature on the syngas composition ... 19 Graph 4.2 - Effect of the SBR on the syngas composition ... 20 Graph 4.3 - Effect of the SBR and temperature on the H2 molar fraction... 21 Graph 4.4 - Effect of the temperature on the syngas LHV ... 22 Graph 4.5 - Effect of the SBR on the syngas LHV ... 22 Chapter II
Graph 3.1 - Results Model vs Experimental ... 37 Graph 4.1 - ER effect on Syngas Composition - Forrest Residues ... 39 Graph 4.2 - ER effect on Syngas Composition – Vines ... 40 Graph 4.3 - ER effect on Syngas Composition - Coffee Husks ... 40 Graph 4.4 - SBR effect on Syngas Composition - Forrest Residues... 42 Graph 4.5 - SBR effect on Syngas Composition - Vines ... 42 Graph 4.6 - SBR effect on Syngas Composition - Coffee Husks ... 43 Graph 4.7 - GT effect on Syngas Composition - Forrest Residues ... 44 Graph 4.8 - GT effect on Syngas Composition - Vines ... 45 Graph 4.9 - GT effect on Syngas Composition - Coffee Husks ... 45 Graph 4.10 - H2 molar fraction - Forest Residues ... 46
Graph 4.11 - H2 molar fraction - Vines ... 47 Graph 4.12 - H2 molar fraction - Coffee Husks ... 47 Graph 4.13 - ER effect in LHV ... 48 Graph 4.14 - SBR effect in LHV... 49 Graph 4.15 - GT effect in LHV ... 49
XXV
Table Index
Chapter I
Table 3.1 - Proximate and ultimate analyses ... 18 Chapter II
Table 3.1 - Operating Parameters for Model Validation ... 37 Table 4.1 - Biomass Properties ... 38
XXVII
Nomenclature
ER Equivalence Ratio S/B Steam/Biomass Ratio GT Gasifier Temperature C Carbon CO Carbon Monoxide CO2 Carbon Dioxide H2 Hydrogen N2 Nitrogen O2 Oxygen CH4 Methane H2O Water (Vapour)1
3
The exponential development of “first world” countries over the last century is due in part to the abundance of fossil fuels. Fuels like these are characterized for being easy and cheap to both collect and use, but have a major effect in environmental protection. Their use is directly linked to rising global temperatures that lead to the onset of climate change [1]. With the recent 2015 Paris Climate Change Conference, new goals for carbon dioxide (CO2) emissions and greenhouse gases have been established, as well as a new approach in new alternative energy. In order to address this problem, Gasification has attracted great interest from researchers around the world [2].
Gasification is a thermochemical process that converts raw material (biomass, municipal waste, coal, etc.) into a combustible gas [3]. This fuel gas containing carbon monoxide (CO), hydrogen (H2), water vapour (H2O), CO2, tar and ash, has in it 70% to 80% of the energy originally present in the raw material [3].
Gasification is characterized by four stages [4]:
1. Drying during the heating of the fuel. The temperature inside the gasifier heats the fuel causing the moisture in the fuel to evaporate,
2. Pyrolysis is the decomposition of the fuel through the heat. This process is endothermic and produces 75% to 90% of volatiles and hydrocarbons, in the form of gases and liquids. The remaining non-volatile matter, which has great carbon concentration is referred to as tar.
3. Oxidation or combustion zone. At this stage the elements that constitute the fuel as C, H2 and oxygen (O2) are reacted in order to produce CO2 and water vapor. The combustion reaction is exothermic.
4. Reduction is the final stage of the gasification process. At this stage oxidation products; CO2 and H2O, are reduced to CO, H2, resulting in Syngas. At this stage the gas is typically cooled and removed from the gasifier for further processing.
The Gasification has grown from a simple process used to make "town gas" used in industrial lighting to an advanced fuel technology for today and for the future [5].
The process of gasification to produce fuel through organic matter was used in blast furnaces 180 years ago, since then the possibility of using this gas for heating or power generation had emerged in Europe, which used coal and peat as primary energy sources. With the turn of the century, the use of oil gained more interest, but during the
4
two world wars, especially World War II, shortage and rationing of oil led to a reintroduction of gasification. In 1945 about 900,000 vehicles, from trucks, buses, agricultural and industrial machinery would be using gasification gas as fuel. As an example of this use is presented in Figure 1 a car with a gasifier to produce fuel.
Figure 1 - Car with gasifier as used in 1945 [6]
After World War II the lack of a strategic start-up, and the availability of cheap fossil fuels has led to a decline in gas production industry. However, to be noted that countries such as Sweden continued to work and to produce gasification technology, leading to its deployment in emergency strategic plans [7].
Today there are about 64 producers of gasification equipment around the world and thousands of gasifiers producing gas from various raw materials.
As with all chemical reactions, these are subject to certain parameters that influence the efficiency and consequently the obtained products. Parameters such as temperature, time, and moisture of the raw material, volatile matter and gasification agent have a great influence on the gas composition obtained after gasification [8]:
• Temperature: The gasification temperature influence the speed of formation of the matter, since at higher temperatures the reactions take place faster and at different temperatures, different reactions occur. For example, the reaction CO +
5
H2O CO2 + H2 occurs at about 500-600 °C while the reaction C + H2O CO + H2 occurs at temperatures of about 1000-1100 °C. Furthermore, tar conversion into smaller molecules occurs at temperatures above 600 °C.
• Time: If the time a sample of raw material in the gasifier is too short, the gasification process will not end, as there is insufficient time for the reactions to reach equilibrium.
• Raw Material Humidity: The moisture present in the raw material has to evaporate in order to gasification to occur. This evaporation requires energy and decreases the temperature in the gasifier, which as stated above is an important factor in the process.
• Volatile Matter: The content of volatile matter is directly related to the reactivity of the raw material, the speed at which the fuel is converted into gas, higher volatile matter content translates into higher conversion of fuel.
• Gasification Agent: The gasification agent is the gas present in the atmosphere around the raw materials during gasification. Examples of gasifying agents are CO2, H2O, O2, and air (78.1% nitrogen (N2), 20.9% O2, 1.0% others), or a mixture between them. The use of different gasification agents results in a different reactivity and a different gas composition. The O2, is for example, much more reactive than H2O or CO2 and H2O is mainly used to produce hydrogen enriched gas. Finally, when an inert gas is present in the gasification agent, such as nitrogen in the air, it will also be present in the gas produced, requiring its removal which could represent costs.
The final product of gasification is the synthesis gas, Syngas, consisting of CO2, CO, H2, methane (CH4), H2O, inert gases small ash particles and tar [9]. The gas after leaving the gasifier has to be treated or cleaned (removal of particles and contaminants such as ash, tar, hydrogen sulfide and alkali metal [10]), and separate gases that do not present utility, such as inert gases and H2O. The resulting product, mainly CO, H2 and CH4 can be used in the most varying products as illustrated in Figure 2.
6
Figure 2 - Syngas Products [11]
As the Syngas is the product of gasification, the composition of this is directly linked with the gasification parameters mentioned above, as well as the type of gasifier. Thus, the Syngas can be produced with different calorific values [12].
When the gasifying agent is air, a large percentage of the gas produced will contain N2, an inert gas directly affecting calorific value [9]. One way around this comes with the use of O2, but involves a greater financial cost that may hinder its use [12].
Currently, gasification is made from a wide range of carbon-based fuels like coal, gas, oil, natural gas, coke, biomass, and waste [13]. Graph 1 presents the world Syngas production values in 2010, when the last referendum was made by the National Energy Technology Laboratory.
7
Graph 1 - Syngas Production [13]
The National Energy Technology Laboratory also developed a chart, shown below, Graph 2, displaying the percentage of production for each type of Syngas product.
Graph 2 - Distribution of Syngas Products [13]
An important evolution in gasification technology came with the introduction of plasma torches during the process. The plasma provides high temperature heat to the system, while completely decompose the organic portion of the fuel into its constituent elements and the inorganic portion into vitrified slag.
The transformation of inorganic matter in vitrified slag is a major advantage of gasification with plasma since the waste or the slag produced is not a problem for environmental protection or public health, later becoming its most viable treatment economically and environmentally compared with normal gasification.
0 5000 10000 15000 20000 25000 30000 35000 40000
Coal Oil Gas Coke Biomass /MSW
Sy n gas P ro d u ctio n (MW th ) 45% 38% 6% 11% Chemicals Liquid Fuel Gas Fuel Power
8
Gasification study is generally characterized by the use of computer software able to simulate the process. Different parameters such as temperature, fuels, and gasification agents, among others are studied. The use of software can encourage the study of gasification to researchers who have no access to their own gasification plants. This way the stagnation of technological development is prevented.
The aim of this work is to develop a numerical model, using the software Aspen Plus, able to simulate the gasification process with and without the use of plasma. The work was divided into two scientific papers.
The first paper, Chapter One, titled Hydrogen production optimization using steam in the biomass gasification process, describes the Aspen Plus model for normal gasification. The same was validated using data from the literature, and some simulations were also carried out in order to study the influence of Gasifier Temperature (GT), Steam to Biomass Ratio (S/B) and Equivalence Ratio (ER).
Chapter Two, titled Numerical Study of Gasification at High Temperature, portray the creation of the Aspen Plus model for gasification with plasma. In it the model is widely detailed, describing all the components and aspects used during the modeling process. Like the model in chapter one, this was also validated with data from the literature and simulations performed to study the parameters mentioned above.
In both chapters ideal running conditions for H2 production and LHV (Lower Heating Value) of the Syngas produced were also theorized.
9
Chapter I
Hydrogen production optimization using steam in the biomass
gasification process
11
1. Introduction
The industrial and domestic energy requirements are mostly met through fossil fuels. As these energy sources are depleting at a faster rate with increasing energy demands, future energy may be found from renewable energy sources. Biomass is the largest primary energy source in the world after fossil fuels [14].
In contrast to fossil fuels, biomass materials are not only available as substitutes, but also highly beneficial to hydrogen production. It is worth mentioning that the biomass does not add carbon dioxide to the atmosphere because it absorbs carbon dioxide from the environment during photosynthesis, and the carbon dioxide is then returned to the environment after combustion [15]. Because of this cycle, biomass carbon dioxide neutral, making it an advantageous fuel source and a leading choice for replacement of fossil fuels as the concern of global warming increases [16].
Biomass materials known as potential sources of energy are residues from forest related industries such as wood chips, sawdust, and bark and agricultural residues such as straw, husk and bagasse [17] [18].
Hydrogen as a clean energy carrier is expected to satisfy a considerable portion of the world´s future energy needs [19] [20]. A problem that rises is that fossil fuels make up approximately 97% of the contemporary source of hydrogen [21].
A number of thermochemical processes can convert the biomass to a fuel gas where gasification plays lead role [22]. Biagini et al. [23] conducted an experimental study to evaluate the performance of the different thermo-chemical technologies (i.e. combustion, gasification, electrolysis and syngas separation) for hydrogen production from biomass. They reported that the hydrogen production was maximized for the gasification/ separation process followed by the gasification/electrolysis and the least being the combustion/electrolysis. Therefore, among the aforementioned technology options, gasification of biomass is identified as the most efficient and economical route for hydrogen production.
12
Hydrogen, one of the important constituents of syngas, has been receiving more attention as a future energy carrier, being a clean fuel with higher energy density on mass basis. Hydrogen has the potential to be a replacement for conventional fuels if produced from a sustainable source.
Biomass steam gasification has recently received much attention as a clean process to produce hydrogen rich gas [24]. This is due to the unique physical properties of steam gasification. From the literature review it clearly observed that the gasification of biomass is usually performed in the presence of a mixture of air and steam.
Note that there are several commercial processes to produce hydrogen and syngas, such as pyrolysis and water hydrolysis, but due to low system efficiency of pyrolysis and high capital costs of water hydrolysis process [25], steam gasification is widely recognized as a promising technique for hydrogen production, which also results in a significant decline in harmful climate change risks.
The Aspen Plus simulator for biomass-derived hydrogen has been discussed by some authors [26] [27] [28] [29] and a review of gasification models using ASPEN Plus process simulator is given by Puig-Arnavat et al. [30].
Sreejith et al. [26] developed a Gibb’s free energy minimization model for steam gasification of biomass to derive the optimum process condition for gasification. Tar was not considered in the model and char conversion was taken as 100%. Maximum hydrogen concentration of 59.3% was predicted at a temperature of 973 K and steam to biomass ratio of unity.
Acharya et al. [27] developed a Gibbs free energy based model to simulate sorbent enabled steam gasification of biomass and compared it with their experimental results. Initially the hydrogen yield was found to be over predicted by the model and the deviation from experimental result is reduced by introducing suitable coefficients.
Shen et al. [28] developed a process simulation with Aspen plus to demonstrate the possibly available efficiencies of interconnected fluidized beds, and the effects of gasifier temperature and steam/biomass ratio on the composition of fuel gas, hydrogen yield, carbon conversion of biomass and recirculation of bed particles.
13
Al Amoodi et al. [29] studied the effect of important key variables on the polyethylene gasification under equilibrium conditions by Aspen Plus simulator. Usually the deviation of unmodified equilibrium models is considerable since the entire system will not be in thermodynamic equilibrium. One of the methods to tackle this problem is to model the processes involved in gasification separately. Thus, quasi-steady state models utilize experimentally observed data and correlations to reduce the deviation [18]. The objective of this work is to develop a numerical model, using Aspen Plus capable to simulate the gasification process. This method allows analyzing the molar fraction of syngas constituents produced in the gasification process. The model allows the user to specify the characteristics of the feedstock composition, ultimate and proximate analyses control the flow rate of the biomass, air and steam as well as the gasifier temperature.
2. Technical approach and process simulation
The model for the biomass gasification process was developed using the software Aspen Plus. This software allows is user to set a type of blocks that describe every stage of the process. These blocks can be all different and having their own specific working conditions.
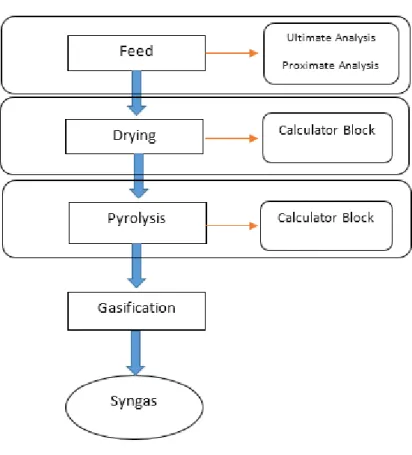
In this work the gasification process was divided into three stages, Drying, Pyrolysis and Gasification as described in the figure 2.1.
14
Figure 2.1 – Gasification process flow sheet
The Aspen Plus model developed in this paper has as heart of is process the minimization of the Gibbs free energy, in order to determinate the constituents of the final gas composition. The minimization of the Gibbs free energy for the application in the gasification process is described by Jarungthammachote and Dutta [31].
At the state of equilibrium, the Gibbs free energy of the system is minimized and defined by:
𝐺𝑡 = ∑𝑁𝑖=1𝑛𝑖𝜇𝑖 (1)
Where ni and μi are the number of moles and chemical potential of species i, respectively. Considering ideal gas behavior for the gases:
𝜇𝑖 = 𝐺𝑖0+ 𝑅𝑇 ln (𝑓𝑖
15
Where R and T are the universal gas constant and the temperature. fi denotes the fugacity of species i. The superscript 0 stands for standard thermodynamic quantity, thus 𝐺𝑖0 and 𝑓𝑖0 are the standard Gibbs free energy and the standard fugacity of species i. Eq. (2) can be expressed in terms of pressure as follows:
𝜇𝑖 = 𝐺𝑖0+ 𝑅𝑇 ln (
∅𝑃𝑖
𝑃0) (3)
Where ∅ is the fugacity coefficient. Usually f and P can have the same value as the pressure approaches zero. In these conditions, the real gas approaches the ideal gas. If all gases are assumed as ideal at one atmosphere, then Eq. (3) can be rewritten as:
𝜇𝑖 = 𝛥𝐺𝑓,𝑖0 + 𝑅𝑇 ln(𝑦𝑖) (4)
Where yi represents the mole fraction of gas species i. 𝛥𝐺𝑓,𝑖0 represents the standard Gibbs free energy of formation of species i, which is set to zero for all chemical elements. Replacing Eq. (4) in Eq. (1) the following is obtained:
𝐺𝑡= ∑𝑁𝑖=1𝑛𝑖𝛥𝐺𝑓,𝑖0 + ∑𝑁𝑖=1𝑛𝑖𝑅𝑇𝑙𝑛 ( 𝑛𝑖
𝑛𝑡𝑜𝑡) (5)
The objective of the problem is to find the value of set of ni for which total Gibbs free energy of the system is minimum, subjected to the elemental balance constraint given by:
∑𝑁𝑖=1𝑎𝑖𝑗𝑛𝑖 = 𝐴𝑗 (6)
Where aij is the number of atoms of the jth element in a mole of ith species and Aj is the total number of atoms of the jth element in the mixture. By applying Lagrange multiplier method the Gibbs free energy of the system can be minimized using the following expression [20]: 0 , ln 1 0 k i f i i j j ij i tot n L G n RT a n n
(7)where L is the Lagrange function and λj is the Lagrange multiplier. The above equation represents n equilibrium equations of each species present in the system. Consequently,
16
for each species present in the system an equation is taken from the Eq. (7) the remaining equations for Langrange multiplier comes from the mass constraint equations [32].
2.1
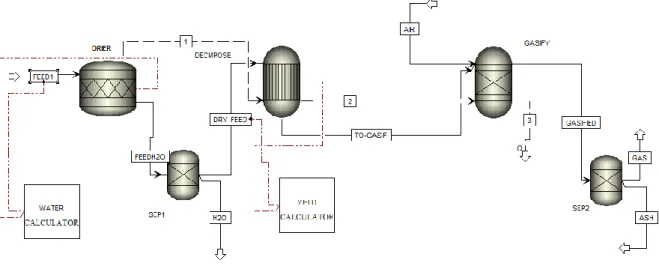
Process modelling with Aspen PlusA number of Aspen Plus blocks were used to develop the model. Figure 2 shows the Aspen Plus flow sheet of the process modeling for air-steam gasification. The main processes were simulated by three reactors: DRIER, DECMPOSE and GASIFY.
Figure 2.2 - Flow sheet of biomass gasification simulation using Aspen Plus
The first stage of the process is the drying which occurs in the block DRIER. Using a calculator block with a Fortran statement the drying process can be simulated to reduce the moisture content of the feedstock. The block DRIER is a stoichiometric reactor (RStoic), which utilizes the equation:
𝐹𝑒𝑒𝑑 → 0,0555084 𝐻2𝑂 (8)
The moisture content of the feedstock is supplied by the proximate analysis. After being dried, the feedstock plus moisture travels to the next block, SEP1. Here the moisture content of the feedstock is removed from the process carrying the dry feed to the next block, DECMPOSE a yield reactor (RYield). Through the ultimate and proximate analysis and a calculator block with a FORTRAN statement, Aspen Plus converts the nonconventional solid stream, into their constituents, C, H, O, N, and S. After the feedstock has been converted into its constituents it is ready to enter the gasifier,
17
GASIFY. The GASIFY is an RGibbs reactor that uses Gibbs free energy minimization as a model for multiphase chemical equilibrium. This reactor calculates the composition of the gasification gas by minimising the Gibbs free energy, and reaching a complete chemical equilibrium. Is in this block that air is introduced as a gasification agent through the AIR stream. The reactions occurring inside the reactor are the following [31]:
C + O2 = CO2 (9) C + 0.5O2 = CO (10) C + CO2 = 2CO (11) C + H2O = CO + H2 (12) CO + H2O = CO2 + H2 (13) C + 2H2 = CH4 (14) H2 + 0.5O2 = H2O (15) CH4 + H2O = CO + 3H2 (16)
As it leaves the reactor the gas passes by a new separator block (SEP2) that will remove the ash as slag from GASIFIED stream. The final gas product can be seen in the GAS stream.
2.2
Model assumptionsIn order to be able to simulate the gasification process in Aspen Plus, some considerations have to be done. FEED1 enters the system as a nonconventional solid stream. The properties of the stream are calculated by Aspen Plus, HCOALGEN enthalpy model and the DCOALIGT density model. Ash is a non-reactive nonconventional solid. The elements considered in this model are H2, N2, CO, CO2, CH4, H2O and C.
18
3. Model validation
The gasification runs were performed using forest residues. The proximate and ultimate analysis of this biomass are shown in Table 3.1.
Table 3.1 - Proximate and ultimate analyses [21]
Graph 3.1 gives the experimental and numerical results for forest residues gasification. The numerical results obtained with Aspen Plus are in good agreement with the experimental results. Little variations are found in molar fractions variation and can be attributed to the Aspen Plus model being steady state.
Graph 3.1 - Comparison of Aspen Plus and experimental results
0 10 20 30 40 50 60 H2 CO CH4 CO2 N2 Molar Fractions (%)
Aspen Plus Experimental Model
Ultimate analysis (wt. %) Proximate analysis (wt. %)
N 2,4 Ash 0,2
C 43 Volatile matter 79,8
H 5 Fixed carbon 20
O 49,6 Moisture 11,3
19
4. Application
The model developed has been used to perform a sensitivity analysis. The effect of gasifier temperature, steam-to-biomass ratio (SBR) and steam injection on syngas mole fraction, lower heating value (LHV) and hydrogen production has been investigated for the forest residues.
4.1
Effect of temperatureGasifier temperature will affect the overall composition of the final product. This happens because some chemical reactions occurring inside the gasifier are endothermic. A higher temperature favours products in endothermic reactions according to Le Chatelier’s principle. Graph 4.1 depicts the syngas molar fraction as a function of the gasification temperature.
Graph 4.1 - Effect of the temperature on the syngas composition
From Graph 4.1 it can be seen that the increase of the gasification temperature promotes the formation of a syngas with higher H2 and CO content and consequently higher syngas LHV. On the other hand, the CH4 and CO2 contents follow an opposite trend. CH4 decreases as a function of the temperature because the methane reaction formation is exothermic. These results are in agreement with the literature [24] [33].
0 5 10 15 20 25 30 35 40 45 50 600 633 667 700 733 767 800 833 867 900 Mo lar fra ctio n (% ) Temperature (ºC) H2 CO CH4 CO2 N2
20
Since the gasification agent used was air,the final gas composition has high molar concentration of N2 throughout the temperature range. This information can be useful when the composition of the final gas needs to be controlled and the temperature inside the reactor can be managed.
4.2
Effect of steam-to-biomass ratioThe steam-to-biomass ratio (SBR) is defined as the mass flow rate of the steam fed into the gasifier divided by the biomass feed rate in dry basis and is one of the important process parameters involved in steam gasification [34].
The main advantage of using steam as gasification agent is the enrichment of the molecular fraction of H2. Adding steam to the gasification process will increase the concentration of H2O leading to more water shift reactions (13). The SBR was varied over a range of values from 0.1 to 2.0 by holding the other variables constant. Graff 4.2 shows the syngas molar fractions as a function of the SBR.
Graph 4.2 - Effect of the SBR on the syngas composition
The use of steam as a gasifying agent increases the partial pressure of H2O inside the gasification reactor which favors the water gas (Eq.12), water gas shift (Eq. 13) and steam reforming reactions (Eq.16) , leading to increased H2 and CO2 and the decrease in CO production [35] as seen in Graph 4.2.
0 10 20 30 40 50 60 70 0,1 0,3 0,5 0,7 1,2 1,4 1,6 1,8 2,0 Mo lar fra ctio n (% ) SBR H2 CO CH4 CO2
21
4.3
Hydrogen productionCombining the two above gasification variables, temperature and SBR, it is possible to optimize the working conditions to magnify the H2 production. This effect is shown in Graph 4.3.
Graph 4.3 - Effect of the SBR and temperature on the H2 molar fraction
It can be seen that higher SBR leads to higher H2 content, while the H2 molar fraction for various SBR decreases as the temperature increases. Similar H2 molar fractions can be obtained with low SBR and high temperatures or high SBR and low temperatures.
4.4
Lower heating valueThe LHV is defined as the amount of heat released by fully combusting a specified quantity less the heat of vaporization of the water in the combustion product. According to Kaewluan and Pipatmanomai [36] LHV can be calculated as follows:
𝐿𝐻𝑉𝐺𝑎𝑠 = 10.79𝑌𝐻2 + 12.26𝑌𝐶𝑂+ 35.81𝑌𝐶𝐻4 (17)
Where Y represents the volume fraction of each component in the syngas on a dry basis. 0,0% 10,0% 20,0% 30,0% 40,0% 50,0% 60,0% 0,125 0,25 0,375 0,5 0,625 0,75 0,875 1 Te m p era tu re C º H 2 m o lar fra ctio n SBR
22
Figures 7 and 8 show the effect of the temperature and SBR on the syngas LHV, respectively.
Graph 4.4 - Effect of the temperature on the syngas LHV
Graph 4.5 - Effect of the SBR on the syngas LHV
The temperature and SBR show opposite behavior on the syngas LHV. The explanation can be based on the CO content. CO molar fractions increase with temperature (Fig. 4) and decrease with SBR (Fig. 5) and Eq. (17) denotes a higher influence of CO than H2 in the LHV. CH4 has an LHV three times higher than H2 and CO but the very low molar fractions do not influence the final LHV.
5,40 5,45 5,50 5,55 5,60 5,65 5,70 5,75 600 633 667 700 733 767 800 833 867 900 L HV ( MJ /m 3) Temperature (ºC) 0 2 4 6 8 10 12 14 0,0 0,5 1,0 1,5 2,0 L HV (MJ /m 3) SBR
23
5. Conclusion
The model developed in Aspen Plus has shown to be a useful tool in the study of the gasification process. The results obtained are in good agreement with experimental results.
The results indicate that the high temperature is more favourable for production of hydrogen. The simulation results also demonstrate that steam injection is a key factor to produce more hydrogen rich gas in the SBR range studied, but had a major effect on CO2 formation.
The temperature and the SBR show opposite behavior on the syngas LHV, which is attributed to the CO content in the syngas that increases with temperature and decreases with SBR.
25
Chapter II
27
1. Introduction
With the last 2015 Paris Climate Change Conference setting new goals for CO2 and pollution gases, new alternative energies are in the up rise. Fossil fuels besides being more depleted every day [37] contribute directly to the formation of greenhouse gases [1] so they need to be substituted for renewable and cleaner fuel. To address this problem gasification has become a major interest in recent years to a great number of researchers attracted for the advantages of using different kinds of feedstock [37]. Gasification is a thermochemical process that converts raw fuel into a fuel gas [38]. This fuel gas is constituted by carbon monoxide (CO), hydrogen (H2), water vapor (H2O), CO2, tar and ash. After filtration to remove tars and ashes, the final product is obtained, Syngas, which can be used as fuel. This synthesis gas, as is also referred, is converted from a variety of fuels being the most common: coal, biomass, plastic and municipal solid wastes [39]. Biomass gasification has been transformed into one of the most promising methods in the production of Syngas [2]. Biomass is and abundant resource, low in nitrogen and sulphur content [40], due to its formation nature is also seen as a carbon neutral fuel, not adding CO2 emissions [41].
The gasification is characterized by four phases, namely: drying, withdrawing water present in the fuel; pyrolysis, characterized by the decomposition of volatile matter; combustion, needed to supply heat to the system; and finally the gasification reactions which gives rise to the Syngas.
An important evolution in gasification technology came with the introduction of plasma torches during the process. The plasma provides high temperature heat to the system, while completely decompose the organic portion of the fuel into the constitutive elements and partly inorganic vitrified slag.
Plasma is the fourth state of matter, warming a solid forms a liquid, heating a fluid forms a gas, heating a gas creates a plasma [42]. During the heating of the gas particles collide with each other, ionizing, and forming free electrons and ions, giving the plasma properties such as the ability to conduct electric current [43]. About 99 % of all the matter in the known universe is in the plasma state [42].
28
The heart of the gasification process with plasma lays in the plasma torch, where an intense electric arc is created between two electrodes, which is crossed by a gas [44]. Despite the arc temperature being extremely high (roughly 13000 °C), the temperature where contact occurs with the fuel is much lower, between 2700 °C to 4500 °C [44].This temperature is sufficient to effect pyrolysis of complex hydrocarbons in simple gases such as CO and H2, whilst all inorganic components (glass, metal, silicones, heavy metals) are melted in a volcanic lava which after cooling vitrifies, the gas produced leaves the gasifier at about 1000 ° C to 1200 °C [44]. A gasifier scheme with plasma capability can be observed in figure 1.1.
Figure 1.1 - Plasma Gasifier illustration [11]
Due to the high temperatures the used fuels react in the gasifier decomposing into its most basic elements, even hazardous waste can be transformed into useful Syngas [45]. The inorganic part that ultimately vitrifies has the advantage of not being dangerous and can be used in various applications such as building material for roads and roofs [45].
Plasma gasification has already attracted interest from many researchers around the world. Some research carried out by Messerle et al. [46] which compared the coal gasification with plasma through experimental and computational simulations. They
29
concluded that both simulations have consistent values, validating the study of plasma gasification by computational means.
Another research prepared by Ojha et al. [47], studied the advantages of using a central plasma gasification for treating municipal solid waste in developing countries. As described advantages are: the elimination of toxic products safely and effectively producing Syngas as a greener approach to energy production from an environmental point of view.
The aim of this work is to create a computer model capable of simulating the gasification process with plasma. The software used was Aspen Plus since it does not require massive computational power, extending the use of the constructed model to increased research community.
The developed model was tested with data concerning the gasification from the literature. After validating the model, the same was used in the study of three gasification parameters, the Equivalence Ratio (ER), the ratio steam to biomass (SBR) and gasifier temperature (GT). Three types of biomass where used: coffee husks, vines pruning and forest residues. The fuels were also studied for their use in H2 production. The LHV of the gasification gas product for each parameter studied was also analyzed.
2.
Technical approach and process simulation
The model for the biomass plasma gasification process was developed using the software Aspen Plus.
The great advantage of Aspen Plus over other software able to simulate the gasification process comes from its lower computational capacity requirements.
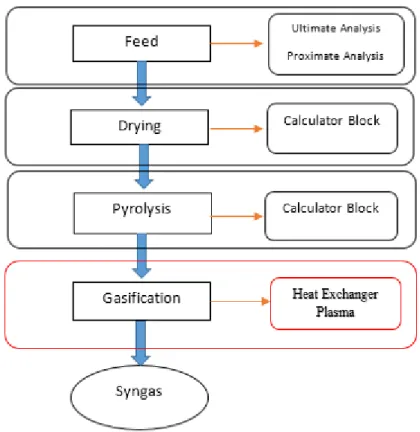
Aspen Plus works by a sequence of blocks, each with its operating conditions, simulating the process and presenting results at the end. For the simulation of the gasification process it was divided in four parts, namely: fuel inlet, drying, pyrolysis and gasification. A schematic summary of the steps leading to the creation of the model can be seen in Figure 2.1.
30
Figure 2.1 – Plasma gasification process flow sheet
2.1 Model Description
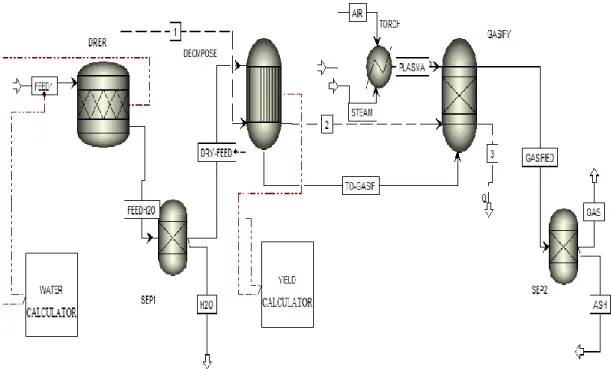
The simulation operation flow begins with the fuel inlet through the current FEED1 which enters the drier. Here the humidity of the fuel is removed by making use of a calculator block WATER CALCULATOR and a Fortran subroutine. The fuel and moisture flow through FEEDH2O leading to the first separator, SEP1, where moisture is removed from the process. The dried fuel is routed to the DECMPOSE in current DRY-FEED. In the DECMPOSE block, using the calculator block YIEL CALCULATOR, and a Fortran subroutine, the fuel is divided into its constituents C, O, H and N, which is introduced in the gasifier by the current TO-GASIF. At the same time, air (AIR) and steam (STEAM) flows are introduced in the heat exchanger (TORCH), where the plasma arc is simulated. The generated plasma current, PLASMA, enters the gasifier as a gasification agent. In the gasifier, GASIFY, the gasification process occurs and the software calculates the gas composition which is transported out of the gasifier by the current GASIFEID into the last separator, SEP2, where ash is removed cleaning the syngas (GAS) flow. The diagram of operation of the simulated process Aspen Plus can be seen in Figure 2.2.
31
Figure 2.2 - Aspen Plus plasma gasification scheme
2.2 Process modelling with Aspen Plus
FEED1
The fuel inlet in the model is carried out by the current FEED1. The fuel is defined in Aspen Plus as an unconventional solid and its characteristics calculated by the software using the proximate and ultimate analysis.
DRIER
32
The DRIER, figure 2.3, a stoichiometric block RStoic in Aspen Plus, responsible for moisture removal. The fuel present in FEED1 stream enters the block which together with the calculator block, WATER CALCULATOR, carry out a separation into two sub streams, fuel and moisture, which continue into the first separator SEP1 by the current FEEDH2O.
WATER CALCULATOR
In order to calculate fuel drying, Aspen Plus requires a calculation block able to identify the moisture presented by the proximate analysis. The FORTRAN code corresponding to the calculation block was taken from Aspen Plus manual [48].
DECMPOSE
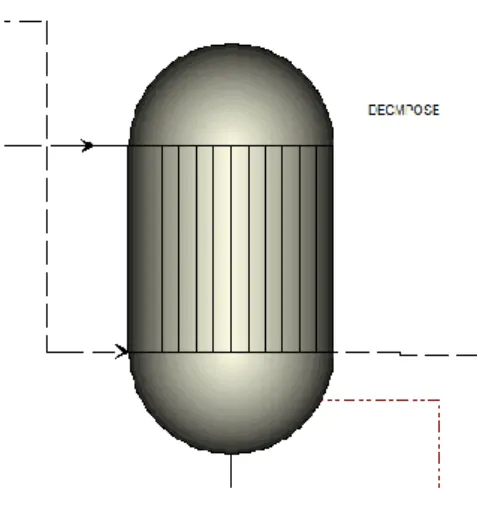
Figure 2.4 - DECMPOSE
The DECMPOSE presented by Figure 2.4, simulates pyrolysis in the gasification process. This block, a RYield in Aspen Plus, transform the unconventional solid fuel into its elements C, O, H, N. The molar fraction of the elements are calculated by the software making use of proximate and ultimate analysis and a calculator block, YIELD CALCULATOR, previously entered by the user in FEED1.
33
YIELD CALCULATOR
As with drying, the pyrolysis process in Aspen Plus requires a calculator block to assist the main block. Referring again to the Aspen Plus manual [48], the FORTRAN code was used to calculate pyrolysis for an unconventional solid.
GASIFY
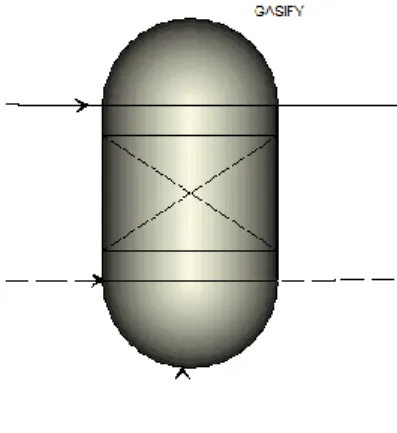
Figure 2.5 - GASIFY
The GASIFY, Figure 2.5, is responsible for simulating the gasification process. This block, an RGibbs in Aspen Plus, determinates the composition of the gas exiting the gasifier by minimizing the Gibbs free energy and assuming its chemical balance.
Gibbs free energy
The plasma gasification model uses Gibbs free energy minimization as a method to calculate Syngas composition. The numerical method is described for the gasification process by Jarungthammachote and Dutta [31]:
At the state of equilibrium, the Gibbs free energy of the system is minimized and defined by:
𝐺𝑡 = ∑𝑁𝑖=1𝑛𝑖𝜇𝑖 (1)
G t represents the total Gibbs free energy and ni the number of moles of species i.
μi is the chemical potential of species i that can be translated as:
𝜇𝑖 = 𝐺𝑖0+ 𝑅𝑇 ln (
𝑓𝑖
34
R and T are the universal gas constant and temperature. fi denotes the fugacity of species
i. The superscript 0 symbolises the standard thermodynamic quantity, thus 𝐺𝑖0 and 𝑓𝑖0 are the standard Gibbs free energy and the standard fugacity of species i. Equation 2 expressed in terms of pressure equals to:
𝜇𝑖 = 𝐺𝑖0 + 𝑅𝑇 ln (
∅𝑃𝑖
𝑃0) (3)
In equation 3, ∅ is the fugacity coefficient. Usually f and P can have the same value as the pressure approaches zero. In this conditions, the real gas approaches the ideal gas. If all gases are assumed as ideal at atmospheric pressure, then equation 3 can be rewritten as equation 4.
𝜇𝑖 = 𝛥𝐺𝑓,𝑖0 + 𝑅𝑇 ln(𝑦𝑖) (4)
yi, translates the mole fraction of gas species i and it is the ratio between ni and the total number of moles in the reaction mixture. 𝛥𝐺𝑓,𝑖0 represents the standard Gibbs free energy of formation of species i, which is set to zero for all chemical elements. Replacing equation 4 in equation 1 we get equation 5.
𝐺𝑡= ∑𝑁𝑖=1𝑛𝑖𝛥𝐺𝑓,𝑖0 + ∑𝑁𝑖=1𝑛𝑖𝑅𝑇𝑙𝑛 ( 𝑛𝑖 𝑛𝑡𝑜𝑡) (5)
The problem now lays in the form to find values of ni that minimize the objective function𝐺𝑡. The method usually used in problems like these is the Lagrange multipliers [32].
35
SEP1 and SEP2
Figure 2.6 - SEP1 and SEP2
The SEP1 and SEP2 blocks, represented by figure 2.6, are responsible for the removal of moisture and ash, respectively. This type of blocks with the designation Sep in Aspen Plus, perform the division of a current into others using the split fractions entered by the user.
In the case of SEP1 the current coming from the drier block FEEDH2O, has both fuel and moisture, using the separator moisture is completely removed from the process. Upon exiting the GASIFY gasifier, the current GASIFEID has both Syngas and ashes (not reactive materials), the introduction of SEP2 promotes the cleaning of the same current creating a new stream, GAS, containing clean Syngas without the presence of ash, and contaminants.
TORCH
36
The plasma arc is simulated in the model by the TORCH block, figure 2.7, a heater block in Aspen Plus. This block acts as a heat exchanger where the power of the plasma torch is entered by the user. This block is also held entry for gasification agents to the system through the current AIR and STEAM. These pass through the block, heating and being sent to the gasifier by the current PLASMA.
2.3 Model Assumptions
The simulation of the plasma gasification process requires that some assumptions being made. The ones present in this study are:
The model only takes into account the stationary and state free of chemical kinetics. The variable time will not influence the chemical reactions occurring in the gasifier. The time just is a unit of measurement for the flow of fuel, oxidant and products;
The process is considered isothermal. Only the gasifier temperature will influence the model of the gasification reactions;
The Aspen Plus model used for enthalpy was HCOALGEN and for density DCOALIGT;
The elements used in the model were: H2, O2, N2, CO, CO2, CH4, H2O and C; The plasma torch has a power of 40 kW;
Ash is a non-reactive nonconventional solid.
3.
Model Validation
The model was validated using experimental values from plasma gasification literature, obtained by Diaz et al [49].Operating parameters are shown in Table 3.1.
37
Table 3.1 - Operating Parameters for Model Validation
Grape Pomace Coffee Ground
Biomass (kg/h) 4.2 4.2
Steam (kg/h) 12 28
Air (kg/h) 0 0
Gasifier Temperature (°C) 1720 1220
Graph 3.1 shows the values obtained by the model developed in comparison with the literature values.
Graph 3.1 – Comparison of Aspen Plus and experimental results
As we can see from the graph 3.1, the values obtained by the model developed present results consistent with those obtained experimentally.
64 64,6 62 63,9 13 12,8 20 20,4 24 21,9 17 14,9 0 10 20 30 40 50 60 70
Experimental Model Experimental Model
Grape Pomace Coffee Ground
Sy n gas M o lar F rac ti o n C o mp o si ti o n ( % ) H2 CO CO2
38
4.
Application
Gasification is influenced by several factors. Parameters such as temperature and gasifier agent are major contributors, and those that allow to be weighed and thereby control the gasification process.
The fuels used were previously used in the literature, to study and research the gasification process, but without the use of plasma. The present fuels in this study are: biomass from forest residues, vines pruning and coffee husks. The characteristics of the same as the proximate and ultimate analysis, values entered in Aspen Plus, can be found in Table 4.1.
Table 4.1 - Biomass properties
Biomass properties
Forest residues
[50] Coffee husk [51] Vines pruning [33]
Ultimate analysis N 2,4 5,2 2,6 C 43 40,1 41,3 H 5 5,6 5,5 O 49,6 49,1 50,6 Humidity 11,3 25,3 13,3 Density (Kg/m3) 650 500 265
Net heat value
(MJ/Kg) 21,2 20,9 15,1 Proximal analysis Ash 0,2 2,5 3,1 Volatile matter 79,8 83,2 83,6 Fixed carbon 20 14,3 13,3 Chemical Formula 𝐶 𝐻1,510𝑂0,61𝑁0,002 𝐶 𝐻1,676𝑂0,918𝑁0,111 𝐶 𝐻1,598𝑂0,919𝑁0,054
39
Equivalence Ratio
According to Miaomiao Niu et al [52], ER is defined as the ratio of the oxygen to fuel divided by the oxygen under stoichiometric conditions to fuel with complete combustion of fuel. 𝐸𝑅 = 𝑜𝑥𝑦𝑔𝑒𝑛 𝑓𝑢𝑒𝑙 𝑚𝑎𝑠𝑠 ⁄ 𝑠𝑡𝑜𝑖𝑐ℎ𝑖𝑜𝑚𝑒𝑡𝑟𝑖𝑐 𝑜𝑥𝑦𝑔𝑒𝑛 𝑓𝑢𝑒𝑙 𝑚𝑎𝑠𝑠 ⁄ (6) Results
Setting a temperature of 1000 °C in the gasifier, a fuel flow rate of 8 kg/h, ER was varied between 0,1 and 0,6. Shown in graphs 4.1, 4.2 and 4.3, are the evolution of the molar fraction of Syngas by increasing the amount of air admitted to the system.
Graph 4.1 - ER effect on Syngas Composition - Forrest Residues
0,00 10,00 20,00 30,00 40,00 50,00 60,00 70,00 80,00 90,00 0,1 0,2 0,3 0,4 0,5 0,6 Mo lar Fract ion (% ) ER H2 CO CO2 N2
40
Graph 4.2 - ER effect on Syngas Composition – Vines
Graph 4.3 - ER effect on Syngas Composition - Coffee Husks
0,00 10,00 20,00 30,00 40,00 50,00 60,00 70,00 80,00 0,1 0,2 0,3 0,4 0,5 0,6 Mo lar Fract ion (% ) ER H2 CO CO2 N2 0,00 10,00 20,00 30,00 40,00 50,00 60,00 70,00 80,00 0,1 0,2 0,3 0,4 0,5 0,6 Mo lar Fract ion (% ) ER H2 CO CO2 N2
41
As air is introduced into the process, N2 directly increases and comes to occupy the largest portion of Syngas. This is explained by the fact that the N2 is an inert gas in the process not reacting with the other elements, and represents 79 % of the air introduced. The high concentrations of N2 on Syngas represent a disadvantage in the use of air as the gasifying agent.
The graphs also translate the evolution of H2 and CO with the increase of ER. Molar fraction values vary between 30 and 40 percent of Syngas, but go down at a considerable pace as soon as more air is added. By contrast, CO2 increases his fraction with increasing air, which proves the development of gasification for simple combustion. Similar results in ER variation can be seen in [53].
SBR
The use of steam as gasifying agent is used in the enrichment of the mole fraction of H2 in the final product. As a means of studying the introduction of water vapor into the gasification process, steam to biomass ratio, SBR, is the relation between the water vapor flow rate to the admitted biomass flow.
𝑆𝐵𝑅 = 𝑆𝑡𝑒𝑎𝑚 𝑚𝑎𝑠𝑠 𝑓𝑙𝑜𝑤
𝐵𝑖𝑜𝑚𝑎𝑠𝑠 𝑚𝑎𝑠𝑠 𝑓𝑙𝑜𝑤 (7)
Results
With a temperature in the gasifier set at 1000 °C, a biomass flow of 8 kg/h, and SBR between 0,5 and 2, simulations where carried out. Graphs 4.4, 4.5 and 4.6 represent the evolution of the molar concentration of Syngas with the increase of SBR.
42
Graph 4.4 - SBR effect on Syngas Composition - Forrest Residues
Graph 4.5 - SBR effect on Syngas Composition - Vines
0 10 20 30 40 50 60 70 0,5 0,7 0,8 1,0 1,2 1,3 1,5 1,7 1,8 2,0 Mo lar Fract ion (% ) SBR H2 CO CO2 0 10 20 30 40 50 60 70 0,5 0,7 0,8 1,0 1,2 1,3 1,5 1,7 1,8 2,0 Mo lar Fract ion (% ) SBR H2 CO CO2
43
Graph 4.6 - SBR effect on Syngas Composition - Coffee Husks
As expected, the introduction of water vapor in the process results in an increase of H2 molar fraction. Compared to the ER study the mere substitute of air for H2O results in an increased mole fraction of H2, about 30 % (max obtained for ER 0.1) to 47% (SBR of 0.5), an increase of approximately 56%. However, an increase in SBR carries out an increase in the percentage of H2O in the final gas product with values between 2% and 60 % as more steam is injected, an unwanted consequence.
This increase in H2 is due to the increased concentration of H2O in the combustion chamber, which in turn stimulates a greater occurrence of the water shift reaction, largely responsible for the appearance of H2. The same reaction is also responsible for CO2 molar fractions, as is also one of its products. The values obtained vary from 0% to approximately 20 % as SBR is increased. In the case of forest residues and vines the molar fraction of CO2 exceeds that of CO with a SBR of around 1.7, whereas in the case of coffee husks the molar amounts of CO2 and CO are for the amount of SBR equal to 2.
Beheshti et al. [54] have concluded the same type of hydrogen formation factors with steam injection.
Gasifier Temperature
One of the most important parameters in the gasification process is the gasifier temperature (GT). The mere fact that many of the gasification equations require a certain
0 10 20 30 40 50 60 70 0,5 0,7 0,8 1,0 1,2 1,3 1,5 1,7 1,8 2,0 Mo lar Fract ion (% ) SBR H2 CO CO2
44
temperature to occur, as well as being endothermic, puts the gasifier temperature as one of the largest contributors to the composition of Syngas.
Results
Setting an ER of 0.3 and a SBR of 0.5, the temperature inside the gasifier was varied between 900 °C and 2000 ° C. Querying graphs 4.7, 4.8 and 4.9, it is possible to analyze the variation of the molar fractions of Syngas, as the temperature of the gasifier is increased.
Graph 4.7 - Effect of the temperature on the syngas composition for forest residues
0,00 10,00 20,00 30,00 40,00 50,00 60,00 70,00 900 1022 1144 1267 1389 1511 1633 1756 1878 2000 Mo lar Fract ion (% ) Temperature -οC H2 CO CO2 N2
45
Graph 4.8 - Effect of the temperature on the syngas composition for vines
Graph 4.9 - Effect of the temperature on the syngas composition for coffee husks
The molar concentrations of CO, CO2 and H2, also change with increasing temperature. The CO2 and H2 have their mole fractions decrease with increasing temperature. This variation of the concentration values is due to the nature of the water shift reaction being exothermic. The high temperature of the gasifier does not favor the reaction leading to lower molar fractions of products, CO2 and H2, the opposite response to the increase in steam introduced into the system as in the case of SBR study. The CO as a water shift reaction reagent undergoes the inverse result of the foregoing, with the
0,00 10,00 20,00 30,00 40,00 50,00 60,00 900 1022 1144 1267 1389 1511 1633 1756 1878 2000 Mo lar Fract ion (% ) Temperature -οC H2 CO CO2 N2 0,00 10,00 20,00 30,00 40,00 50,00 60,00 900 1022 1144 1267 1389 1511 1633 1756 1878 2000 Mo lar Fract ion (% ) Temperature -οC H2 CO CO2 N2
46
increase in temperature favoring its mole fraction (maximum increase of 65 % for coffee husks). Ramzan et al. [55] in their plasma gasification study, have reached the same kind of molar fraction variation with temperature variance.
H2 Production
Combining two of the parameters studied previously, SBR and temperature, the variation of the molar fraction of H2 in Syngas was studied. The temperature was varied between 900 °C and 2000 °C, the SBR was varied between 0.2 and 2.
Results
Graphs 4.10, 4.11 and 4.12 show the results obtained. For the three fuels used, the mole fraction of H2 in the final product is always greater than 45 %. However, coffee husks have a higher capacity for H2 production, its lowest molar fraction is predominantly higher than 48% and presents a greater range of parameters in which the molar fraction is greater than 58%.
Graph 4.10 - H2 molar fraction - Forest Residues
0,2 0,6 1,0 1,4 1,8 900 1022 1144 1267 1389 1511 1633 1756 1878 2000 SBR Temperature -οC 58-60 55-58 53-55 50-53 48-50 45-48
47
Graph 4.11 - H2 molar fraction - Vines
Graph 4.12 - H2 molar fraction - Coffee Husks
0,2 0,6 1,0 1,4 1,8 900 1022 1144 1267 1389 1511 1633 1756 1878 2000 SBR Temperature -οC 58-60 55-58 53-55 50-53 48-50 45-48 0,2 0,6 1,0 1,4 1,8 900 1022 1144 1267 1389 1511 1633 1756 1878 2000 SBR Temperature -οC 58-60 55-58 53-55 50-53 48-50 45-48
48
LHV
The lower heating value (LHV) is defined as the amount of heat released by fully combusting a fuel less the heat of vaporization of the water in the combustion product. Kaewluan and Pipatmanomai [36] propose the following equation (Eq.8) to calculate LHV of a gas:
𝐿𝐻𝑉𝐺𝑎𝑠 = 10.79𝑌𝐻2+ 12.26𝑌𝐶𝑂+ 35.81𝑌𝐶𝐻4 (8)
The following graphs 4.13, 4.14 and 4.15 represent variations of LHV in Syngas produced, according to the variation of the parameters studied previously, ER, SBR, and GT. Graph 4.13 - ER effect in LHV 0,00 1,00 2,00 3,00 4,00 5,00 6,00 7,00 8,00 9,00 10,00 0 0,1 0,2 0,3 0,4 0,5 0,6 0,7 M J/ kg ER
49
Graph 4.14 - SBR effect in LHV
Graph 4.15 - GT effect in LHV
The results are in agreement with the values previously reported. Increasing ER translates into a reduction of the LHV in the absence of H2 and CO in Syngas. As regards to the variation of SBR, the increase would imply a slight decrease LHV since the CO fraction decreases and has a greater weight in equation (Eq.8) than that of H2.
8,00 8,50 9,00 9,50 10,00 10,50 11,00 11,50 0,0 0,2 0,4 0,6 0,8 1,0 1,2 1,4 1,6 1,8 2,0 2,2 MJ /kg SBR
Coffee Vines Forest
2,50 3,00 3,50 4,00 4,50 5,00 800 1000 1200 1400 1600 1800 2000 MJ /kg Temperature (ºC)
50
5.
Conclusion
The model developed in Aspen Plus has shown to be a useful tool in the study of the plasma gasification process. The results obtained are in good agreement with experimental results.
The results indicate that as temperature increases H2 tends to decrease an opposite effect of CO. The model results also reveal that steam injection is crucial to produce more hydrogen rich gas in the SBR range studied, but also translate in an increase of CO2 formation.
LHV values tend to follow CO concentration, increasing with higher temperatures and decreasing with steam injection.
51
53
The gasification is not a new theme and the new environmental concerns increasingly reinvigorate the use of this technology as a way of providing clean energy.
The use of plasma reinforces the idea of "green energy" by converting inorganic gasification waste in a material easy to handle, without raising environmental or public health problems. Janajreh et al. [56] in its gasification study of plasma through exergy analysis concluded that despite the use of plasma was translated into a small increase in efficiency compared with standard gasification, it presents an enormous advantage in the treatment of inorganic waste, even if this factor is not considered in energy and exergy studies.
The construction of the model presented here was not very linear. The lack of tutorials related to Aspen Plus and gasification, the scarcity of detailed description of the models found in the literature and the fact that I am pioneered the use of Aspen Plus software in the department of Mechanical Engineering from Escola de Ciências e Tecnologias of UTAD, have emerged as some obstructions, but with persistence and dedication the goal was achieved.
The model developed in this work meets all the requirements proposed in the beginning of it. It is able to provide reliable results on gasification as evidenced by the validations and by the results obtained.
Suggestions for future work
Research is a process of constant evolution and as such requires constant attention and growth.
The model presented in this work despite displaying good results is not perfect and can be further evolved to be possible a more extensive study of the gasification process. My proposals for future work are:
• Increase of chemical species used in order to encompass a larger amount of fuel as well as reactions which may occur in the gasifier and which were not considered.
• Develop the model more extensively in order to be able to simulate the gasification process regulated by the type of gasifier.
54
• Associate the model in this work with that of a fuel cell to study the potential of electricity production.
![Figure 1 - Car with gasifier as used in 1945 [6]](https://thumb-eu.123doks.com/thumbv2/123dok_br/15869226.1087794/32.892.181.711.283.627/figure-car-gasifier-used.webp)
![Figure 2 - Syngas Products [11]](https://thumb-eu.123doks.com/thumbv2/123dok_br/15869226.1087794/34.892.246.650.110.510/figure-syngas-products.webp)
![Table 3.1 - Proximate and ultimate analyses [21]](https://thumb-eu.123doks.com/thumbv2/123dok_br/15869226.1087794/46.892.170.726.331.510/table-proximate-and-ultimate-analyses.webp)
![Figure 1.1 - Plasma Gasifier illustration [11]](https://thumb-eu.123doks.com/thumbv2/123dok_br/15869226.1087794/56.892.302.569.402.804/figure-plasma-gasifier-illustration.webp)